Monday, March 26, 2018

US Market Outlook as at March 23, 2018

Dow Jones Industrial Average ('DJIA') has been swinging wildly for the past 2 months. The latest concern for Wall Street is the threat of a trade war started by Washington. Chartwise, DJIA is sitting right on the uptrend line as well as the 40-week EMA line (equivalent to the 200-day SMA line). If DJIA were to break below 23500 next week, the uptrend could be over. 


Chart 1: DJIA's weekly chart as at Mar 23, 2018 (Source: Stockchart.com)

The daily charts of DJIA and S&P500 show these indices are at their 200-day SMA line.


Chart 2: DJIA's daily chart as at Mar 23, 2018 (Source: Stockchart.com)


Chart 3: S&P500's daily chart as at Mar 23, 2018 (Source: Stockchart.com)

3 selected indices from France, Germany & Japan (3 largest OECD countries) show that their main market barometer have broken their uptrend lines.


Chart 4: CAC, DAX & NIKK's weekly chart as at Mar 23, 2018 (Source: Stockchart.com)

Fortunately, 3 selected indices from Asian markets (HSI, STI & BSE) show their main market barometers are still in an uptrend.


Chart 5: HSI, STI & BSE's weekly chart as at Mar 23, 2018 (Source: Stockchart.com)

Will Bursa Malaysia follow the Asian markets and stay afloat or will we tumble down if US markets go into a downtrend? We will have to wait and see.

Thursday, March 22, 2018

MREITs: Looking Attractive Again

This morning we saw Bursa instituting sizable buy-ins for 3 REITs that had dropped substantially over the past few days or weeks. This means that some fund(s) have been so aggressively selling down that the fund(s) had oversold the REITs. Does this mean the selling will end soon?

Note: For the benefit of those who are new to the stock market, a buy-in is instituted by the exchange if the seller of a security failed to deliver because of he doesn't have the security. Buy-in is normally carried out on T+4 and sellers who wish to sell to a buy-in must have ready security to deliver. The exchange will penalize the "short-seller" by levying a penalty equivalent to 10 bids on the security's last closing price. This penalty is then passed onto the successful seller to the buy-in. Thus, selling to buy-ins is a fairly popular sport among remisiers but the chance of success is no better than striking Magnum 4Ds.


Picture: Buy-in on Bursa (Source: BTX)

The charts of the above oversold REITs are given below. IGBREIT is at the uptrend line at RM1.47; PAVREIT broke the uptrend line at RM1.70 in November 2017; and SUNREIT just broke the uptrend line at RM1.65 two days ago.


Chart 1: IGBREIT's weekly chart as at Mar 21, 2018 (Source: Malaysiastock.biz)


Chart 2: PAVREIT's weekly chart as at Mar 21, 2018 (Source: Malaysiastock.biz)


Chart 3: SUNREIT's weekly chart as at Mar 21, 2018 (Source: Malaysiastock.biz)

The size of this morning buy-ins and the fact that 3 of them were REITs are pretty interesting. As you might have read, Feb has raised its benchmark fund rate from 1.5% to 1.75% yesterday. The interest rate hike is being carried out for many reasons, such as stronger economic growth and increased inflation rate. But what lie behind the plethora of reasons to raise interest rate is the equally important need to conserve bullets to fight the next recession or financial crisis. If interest rate remains zero-bound, Fed will have limited room to maneuver in the event of any economic slowdown or crisis.

If you look at the long term charts for 10 and 30-year Treasury yield, they are still in a downtrend, albeit risen fairly substantial off the low.


Chart 4:  10-year Treasury Yield as at Mar 21, 2018 (Source: Yahoo Finance) 

 
Chart 5: 30-year Treasury Yield as at Mar 21, 2018 (Source: Yahoo Finance) 

What does Treasury yield have to do with MREITs? Well, REITs are viewed as fixed income instruments, which move in an inverse correlation to the interest rate movement. If interest rate rises, the income produced by REITs will be worth less. Thus this will lead to a drop in the value of the REITs. This article from Forbes magazine makes the case for active management of our investment in REITs, taking advantage of period of selldown of REITs due to interest rate volatility in order to maximize our return from our investment. To wit, it concludes:

When thinking about the asset allocation implications of this phenomena, two things stand out:  First, interest-rate increases in and of themselves are not necessarily bad for REITs, and in fact, when measured over longer periods of time, They have generally been associated with periods of REIT out-performance. Second, REIT sell-offs associated with spikes in interest-rate volatility have often provided active REIT managers with opportunities to add exposure at attractive levels just as fundamentals were improving. The relationship between REITs and Interest rates is volatile and unstable, but this complex relationship leads to both short-term risk and long-term opportunity.

Based on the above, I think it may be a good time to slowly nibble into the beaten down REITs. I have posted above REITs when they were fairly attractive (here). This time I will sunstitute IGBREIT for CMMT while retaining SUNREIT and PAVREIT. The valuation table is given below:


Table: Selected REITs' valuation

Note:
I hereby confirm that I do not have any direct interest in the security or securities mentioned in this post. However, I could have an indirect interest in the security or securities mentioned as some of my clients may have an interest in the acquisition or disposal of the aforementioned security or securities. As investor, you should fully research any security before making an investment decision.

Tuesday, March 20, 2018

Astro: Looking Even More Attractive

Astro has been dropping over the past 4 months, from a high of RM2.90 to a low of RM2.14 now. If you look at the chart below, we can see that Astro share prices have been moving in a steep downward channel, ABCD which flattened out slightly into WXYZ. Occasionally it would go below the lower line before rebounding back into the downward channel (see C"D" and Y"Z"). Assuming this pattern persists, Astro may test the second lower, Y"Z" possibly at RM2.10 before recovery.

Astro (currently at RM2.16) is now trading at a trailing PER of 15.3 times (based on last 4 quarters' EPS of 14.1 sen) and has a dividend yield of 5.8% (based last 4 quarters' dividend totaling 12.5 sen). At these ratios, Astro is deemed fairly attractive.


Chart: Astro's weekly chart as at Mar 20, 2018_4.06pm  (Source: Malaysiastock.biz)

Conclusion

Based on satisfacoiry financial performance & attractive valuation, Astro is considered a good stock for long-term investment.

Note:
I hereby confirm that I do not have any direct interest in the security or securities mentioned in this post. However, I could have an indirect interest in the security or securities mentioned as some of my clients may have an interest in the acquisition or disposal of the aforementioned security or securities. As investor, you should fully research any security before making an investment decision.

Hevea: Trading at Attractive Valuation

Results Update

For QE31/12/2017, Hevea's pre-tax profit rose 27% q-o-q but dropped 66% y-o-y to RM10 million while revenue rose 12% q-o-q but dropped 9% y-o-y to RM133 million. PBT rose q-o-q due mainly to the better performance at the particleboard sector as the planned annual preventive maintenance was done in the previous quarter. Profit after tax rose sharply due to a tax credit as the company recognized RM4.34 million of deferred tax assets arising principally from unabsorbed allowances on investment tax allowances available to the company less temporary differences in respect of excess of capital allowance over book depreciation.
(Note: Hevea's latest quarterly result was announced on 27 February.)


Table: Hevea's last 8 quarterly results


Graph: Hevea's last 41 quarterly results

Financial Position

Hevea's financial position is deemed healthy with current ratio at 3.7 times and total liabilities to total equity of 0.2 times.

Valuation

Hevea (closed at RM0.93 yesterday) is now trading at a PE of 7.8 times (based on last 4 quarters' EPS of 12.03 sen). At this PER, Hevea is still deemed fairly valued. In addition, Hevea pays a decent dividend, with yield of 5.2%.

Technical Outlook

Hevea could be resting on its long-term uptrend line, SS at RM0.90.


 Chart: Hevea's weekly chart as at Mar 20, 2018_12.30pm  (Source: Malaysiastock.biz)

Conclusion

Based on improving financial performance, healthy financial position and mildly positive technical outlook, Hevea is deemed to be a good stock for long-term investment.

Note:
I hereby confirm that I do not have any direct interest in the security or securities mentioned in this post. However, I could have an indirect interest in the security or securities mentioned as some of my clients may have an interest in the acquisition or disposal of the aforementioned security or securities. As investor, you should fully research any security before making an investment decision.

Monday, March 19, 2018

MKH: Exciting Prospect Ahead

Result Update

For QE31/12/2017, MKH's net profit rose 171% q-o-q but dropped 59% y-o-y to RM16 million while revenue dropped 26% q-o-q & 26% y-o-y to RM194 million. Despite the drop in revenue by RM66.7 million, the profit before tax for the current quarter of RM27.4 million was higher compared to the immediate preceding quarter of RM17.0 million mainly due to improvement in loss before tax to RM0.4 million in the current quarter as compared to immediate preceding quarter loss before tax of RM12.8 million from the plantation division with lower average production cost and absence of biological assets written off of RM4.8 million. The lower revenue was mainly due to lower revenue from the property and construction division as the new development phases namely, Pinang and The Palm in Hill Park Shah Alam still at the preliminary stage of development.

Note: MKH's latest result was released on February 28, 2018.


Table: MKH's last 8 quarterly results


Graph: MKH's last 20 quarterly results

Future Prospect

In a recent article in The Edge Daily entitled"A Year of Harvest for MKH", MKH's Executive Chairman Tan Sri Alex Chen spoke about its palm oil estate achieving bumper harvest for current financial year as the palm oil trees reach their productive age, with projected output of 28 tonnes per hectare. In addition, its property development segment is expected to do well as it will be launching more projects with total GDV of RM1.15 billion. This will add to its total unbilled sales of RM903.5 million as at 31/12/2017.

Financial Position

MKH's financial position as at 31/12/2017 is deemed adequate with current ratio at 1.66 times and total liabilities to total equity at 1.07 times.

Valuation

MKH (closed at RM1.53 last Friday) is now trading at a trailing PER of 6.9x (based on last 4 quarters' EPS of 22.16 sen). Dividend yield of 3.3% is still respectable despite heavy investment in the plantation segment.

Technical Outlook 

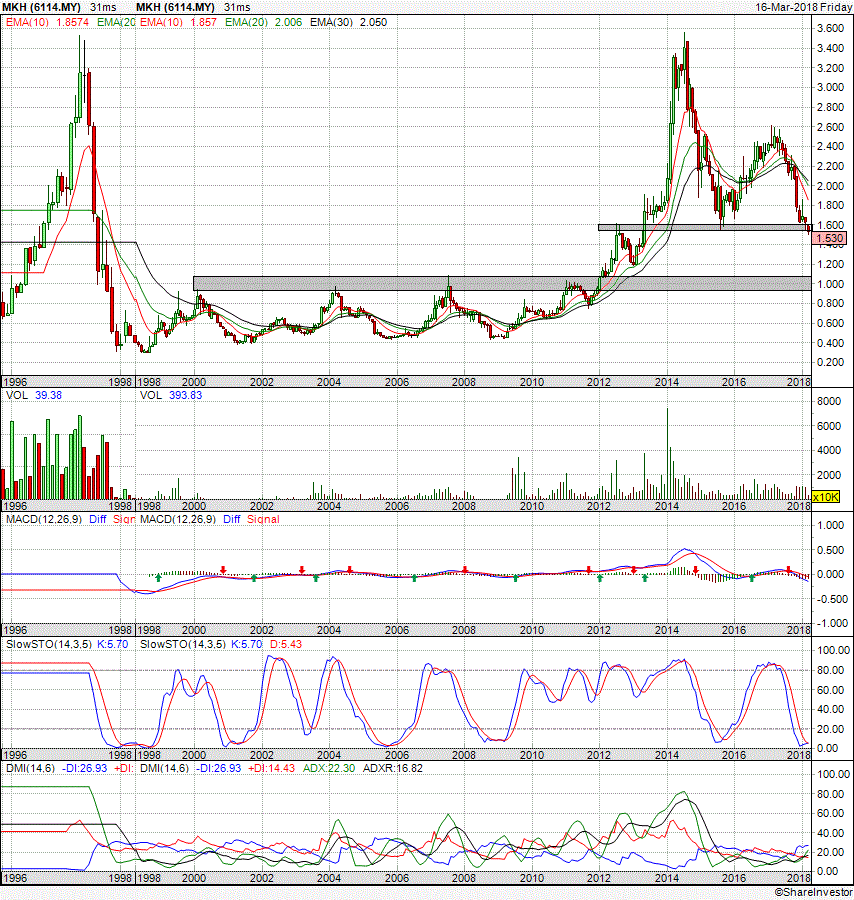
MKH has declined substantially from its peak at RM3.50 in June 2014. Currently it seems to have found good support at the horizontal line at RM1.50. If this strong support failed, its next strong support is at RM1.00.


Chart: MKH's monthly chart as at Mar 16, 2018 (Source: Shareinvestor.com)

Conclusion

Based on satisfactory financial performance, attractive valuation and positive technical outlook, MKH is a good stock to consider for long-term investment.

Note:
I hereby confirm that I do not have any direct interest in the security or securities mentioned in this post. However, I could have an indirect interest in the security or securities mentioned as some of my clients may have an interest in the acquisition or disposal of the aforementioned security or securities. As investor, you should fully research any security before making an investment decision.

APM: Earnings Remained Weak

Result Update

For QE31/12/2017, APM's net profit increased by 1% q-o-q but dropped 15% y-o-y to RM13 million while revenue increased by 12% q-o-q but dropped 4% y-o-y to RM328 million.  Revenue rose  q-o-q due to higher sale of OEMs parts in the Interior & Plastic Division, primarily driven by the new model launches in 3rd quarter of 2017. PBT rose 7.6% q-o-q due to improved performance recorded mainly in the Interior & Plastics Division, augmented by recognition of fair value gain on investment properties of RM4.7 million.

Profit after tax rose 23% q-o-q due to prior year deferred tax credit recognized in QE31/12/2017 while net profit rose marginally by 1% as non-controlling interests' share of net profit rose to RM5.959 million from RM3.159 million in QE30/9/2017.

Note: The latest result was released on February 28, 2018.


Table: APM's last 8 quarterly results


Chart: APM's last 39 quarterly results

Financial Position

APM's financial position as at 31/12/2017 is deemed healthy with current ratio at 2.94 times and total equity to total liabilities at 0.28 times. Its net cash is substantial at RM196 million or equivalent to RM0.84 per share.

Valuation

APM (closed at RM3.45 last Friday) is now trading at a PE of 17.3 times (based on last 4 quarters' EPS of 19.99 sen). If the net cash of 84 sen were deducted, APM would have a PER of 13.0 times. As the company is beginning to recover from weak automotive sales, there is good prospect of higher earning and improved PER.

Technical Outlook

APM is in a downtrend for the past 4 years. It is now resting on the strong horizontal line at RM3.50.


Chart: APM's monthly chart as at Mar 16, 2018 (Source: Shareinvestor.com)

Conclusion

Based on improved financial performance, healthy financial position & reasonably attractive valuation, APM is deemed a good stock for long-term investment.

Note:
I hereby confirm that I do not have any direct interest in the security or securities mentioned in this post. However, I could have an indirect interest in the security or securities mentioned as some of my clients may have an interest in the acquisition or disposal of the aforementioned security or securities. As investor, you should fully research any security before making an investment decision.

Tuesday, March 13, 2018

BAUTO: Earning's Rising Again


Results Update

For QE31/1/2018, BAuto's net profit increased 82% q-o-q or 61% y-o-y to RM40 million while revenue rose 19% q-o-q or 65% y-o-y to RM559 million.

Group revenue rose q-o-q mainly due to higher sales volume arising from the launch of the new CX-5 model in both the domestic and the Philippines market. In line with higher revenue, Group pre-tax profit soared primarily due to improved sales volume in the domestic operations arising from the new CX-5 model and higher share of profit contribution from its associate company, MMSB. The higher share of profit contribution from MMSB was mainly due to increase in production volume for the new CX-5 model to cater for both the domestic market and export to the ASEAN market (such as Thailand, Indonesia, the Philippines and Cambodia).


Table: BAuto's last 8 quarters' financial performance

From the graph below, we can see that BAuto's profits are curving up and revenue has surpassed the high recorded in QE31/10/2015.


Graph: BAuto's last 23 quarters' financial performance  

Valuation

BAuto (closed at RM2.02 yesterday) has a fair PER of 22 times (based on last 4 quarters' EPS of 9.1 sen). At this PER, BAuto is deemed fully valued. However if its earning continue to grow, the PER will drop and the stock will be more attractive.

Technical Outlook

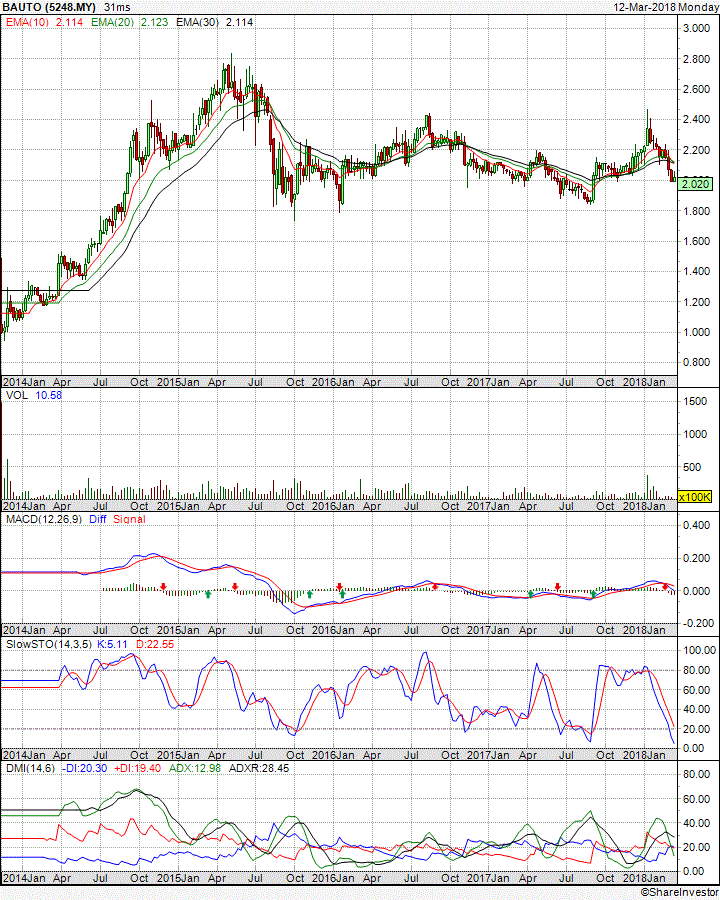
BAuto has been moving in a sideways for the 2 &1/2 years. The range is between RM1.80 & RM2.40.


Chart: BAuto's weekly chart as at Mar 12, 2018 (Source: Shareinvestor.com)

Conclusion

Based on improved financial performance, I revise the rating for BAuto from a HOLD to a BUY.

Note:

I hereby confirm that I do not have any direct interest in the security or securities mentioned in this post. However, I could have an indirect interest in the security or securities mentioned as some of my clients may have an interest in the acquisition or disposal of the aforementioned security or securities. As investor, you should fully research any security before making an investment decision.

Thursday, March 08, 2018

Market Outlook as at March 8, 2018

Yesterday FBMKLCI broke below its uptrend line at 1848. This breakdown of the heavily managed index, with hard to decipher pattern or trend may be cast aside for a while if not for a more serious breakdown of FBM70 index. Let's take a closer look at both indices which are appended below.

1) FBMKLCI rallied from December last year after it broke above the downtrend line, RR at 1725. It made a high at 1880 in late January. Subsequent attempt at that high failed, setting the stage for a possible double top reversal of this short rally. Yesterday it broke the uptrend line, SS at 1848. If it cannot recover back above this level, it may continue to slide to the next support at around 1820 & below that, at 1800.


Chart 1: FBMKLCI daily chart as at Mar 7, 2018 (Source: Shareinvestor.com)

2) FBM70 broke to the upside of a Cup-with-handle formation in December last year. Like FBMKLCI, this index made a high (of 16850) in late January. Subsequent attempt at that high failed, setting the stage for a possible double top reversal of this short rally. The subsequent sharp pullback tested the extension of the line connecting the top of the Cup (AB) at 15700. A rebound ensued until it was cut short by the selldown in US two weeks. This brought the index down to the same line again. Yesterday FBM70 convincingly broke below this line.


Chart 2: FBM70I daily chart as at Mar 7, 2018 (Source: Shareinvestor.com)

 Based on the double breakdown noted above, I expect our market to be very weak. If there is no sharp rebound to correct the above breakdown, we could well be going into a period of correction in the next few weeks.

Tuesday, March 06, 2018

Semiconductor Stocks: Down For Now

A few months ago, I mentioned about the change in forex outlook (more favorable for MYR) and its impact on share prices. I have recommended that you should shift from exporters to importers. 

If you have read thru some of the notes to the accounts of exporters that had suffered sharp drop in profits, you would have seen the similar commentary on the impact of this unfavorable forex movement. For instance, this is the explanation given by Thong Guan for its sharp drop in profits: "Lower profit before tax for the current quarter was mainly due to the reduction in gross profit margin in plastic products mainly due to lower selling prices of USD sales when translated to MYR as a result of the depreciation of the USD against MYR especially during the fourth quarter."

I can imagine a situation where exporters who had been enjoying super profit due to favorable forex movement in 2016 and early part of 2017, were pressured by their customers to "share" the profit in the form of lower prices. Naturally the recent drop in profits would lead to these exporters raising their prices again but the price increase will not be immediate nor will they match the swing in forex movement. This laggard effect would mean that exporters will have 2-3 quarters of lower profit. t

That's why we have seen a selldown for some exporters, like MPI and Unisem even though the Semicoductor Index in Philadelphia (SOX) is still trending higher. I believe that MPI and Unisem share price will likely to stabilize at the current level for a while before continuing they return to the prior uptrend. Thus these stocks could be good stocks to consider for long-term investment in the current weak market.


Chart 1: SOX's daily chart as at mar 5, 2018 (Source: Stockcharts.com)

Below are the charts for MPI and Unisem. They are now resting at their respective uptrend line support at RM8.70 for MPI and RM2.55 for Unisem.


Chart 2: MPI's weekly chart as at Mar 5, 2018 (Source: Malaysiastock.biz)


Chart 3; Unisem's weekly chart as at Mar 5, 2018 (Source: Malaysiastock.biz)

Note:

I hereby confirm that I do not have any direct interest in the security or securities mentioned in this post. However, I could have an indirect interest in the security or securities mentioned as some of my clients may have an interest in the acquisition or disposal of the aforementioned security or securities. As investor, you should fully research any security before making an investment decision.

US Market Outlook as at March 5, 2018


One month ago, when DJIA plunged 666 points, I posted that DJIA will have good support from the 100-day SMA line at 23982 then. DJIA has jumped up and down like a yo-yo since then - with more news on the Russian collusion and more Trump Tantrums - and yet this support at 100-day SMA line still holds. Last week we had another Trump Tantrum - the steel and aluminium tariff - and the support seems to kick in again. There is now signs that the opposition to the tariff is gathering strength and Trump is trying to find a way to save his face (maybe the Mexicans have to pay again).

Back to the chart; look out for the 100-day SMA line support at 24470 now, and the uptrend line support at 23700. If both of these supports failed, you should be worried. Of course, that's not to say that these supports will not break. They are still intact and the market may still come back up.


Chart: DJIA's daily chart as at Mar 5, 2018 (Source: Stockcharts.com)

Monday, March 05, 2018

Orna: Earnings Soared

Background

Ornapaper Bhd ('Orna') is involved in the production of corrugated boxes and carton boxes. Its current capacity is 84,000 MT per annum.

Historical Financial Performance

Orna's top-line and bottom-line jumped in FY2017. The company attributed the increased revenue to due to higher sale orders received and higher average selling price. This led to improvement in its bottom-line.


Table 1: Orna's last 9 years' financial performance


Graph 1: Orna's last 9 years' financial performance

Latest Financial Performance

In QE31/12/2017. Orna's net profit rose 43% q-o-q or 2-fold y-o-y to RM5.0 million while revenue rose 5% q-o-q or 27% y-o-y to RM90.8 million. Revenue rose q-o-q due to 6.6%-increase in sales volume and 19.0%-increase in average selling price for corrugated cartons and boards. In line with the increase in revenue, profit before tax increased from RM1.5 million in the corresponding quarter to RM6.1 million in the current quarter.


Table 2: Orna's last 8 quarters' financial performance


Graph 2: Orna's last 8 quarters' financial performance

Latest Financial Position

Orna's financial position as at 31/12/2017 is deemed healthy with current ratio at 1.6 times and gearing ratio at 0.7 times.

Valuation

Orna (cloased at RM1.63 in the morning session) is now trading at a trailing PER of 7.7 times (based on last 4 quarters' EPS of 21.1 sen). At this PER, Orna is deemed fairly attractive.

Technical Outlook

Orna rallied to an intra-day high of RM1.73 today before it corrected back to around RM1.60. On Feb 28, it also rallied to a significant high of RM1.70 before correction kicked in and brought the share price back to RM1.60 level. An upside breakout of RM1.70 may signal the continuation of the uptrend for this stock.


Chart 1: Orna's daily chart as at Mar 2, 2018 (Source: Shareinvestor.com)


Chart 2: Orna's monthly chart as at Mar 2, 2018 (Source: Shareinvestor.com)

Conclusion

Based on good financial performance & position, fairly attractive valuation and mildly positive technical outlook, Orna could be a good stock for medium-term investment.

Note:
I hereby confirm that I do not have any direct interest in the security or securities mentioned in this post. However, I could have an indirect interest in the security or securities mentioned as some of my clients may have an interest in the acquisition or disposal of the aforementioned security or securities. As investor, you should fully research any security before making an investment decision.

Presbhd: Earnings recovered

Result Update

In QE31/12/2017, Presbhd's profit before tax rose 117% q-o-q or 9-fold y-o-y to RM18 million while revenue rose 48% q-o-q or 191% y-o-y to RM72 million. Revenue rose q-o-q due to higher contribution Software & Services and Concession segments. The Group recorded higher PBT mainly contributed by contribution from Software & Services and Concession segments. The Group's NP dropped q-o-q due to higher tax expenses of RM10.1 million which in turn was due to under-provision of taxation of RM7.78 million and deferred tax charge of RM2.29 million.


 Table: Presbhd's 8 quarters' P&L


 Graph: Presbhd's 21 quarters' P&L

Latest Financial Position

As at 31/12/2017, Presbhd's financial position is deemed satisfactory with current ratio at 2.1x and gearing ratio at 0.5x.

Valuation 

Presbhd (closed at RM1.63 last Friday) is now trading at a PER of 44x (based on last 4 quarters EPS of 3.7 sen). The fair value of this stock is given by DCF absolute valuation method that takes into account the new SKIN contract that it has secured. Presbhd is valued by AMInvestment at RM2.08, CIMB at RM2.69 and Public Investment Bank at RM2.87.

Technical Outlook

Presbhd is in an intermediate downtrend line, with resistance at RM1.95-2.00. See Chart 1 below. However it may be in a long-term uptrend line with support at RM1.40. See Chart 2.


Chart 1: Presbhd's weekly chart as at Mar 2, 2018 (Source: Shareinvestor.com)


Chart 2: Presbhd's monthly chart as at Mar 2, 2018 (Source: Shareinvestor.com)

Conclusion

Based on satisfactory financial performance & position, and fairly attractive valuation, Presbhd is considered a good stock for long-term investment. The main concern is the weak technical outlook which may lead to price weakness in the near term.

Note:
I hereby confirm that I do not have any direct interest in the security or securities mentioned in this post. However, I could have an indirect interest in the security or securities mentioned as some of my clients may have an interest in the acquisition or disposal of the aforementioned security or securities. As investor, you should fully research any security before making an investment decision.

PMetal: Hit By Trump Tantrum


Donald Trump announced trade tariff on steel & aluminium import to the US last week after a meeting with business leaders and his Commerce Secretary. Trump's announcement surprised many, including his economic team. The impact on the stock market was swift as many markets dropped sharply on fear that the world may go into a trade war.

If you follow US politics, you will learn to expect the unexpected when it comes Donald Trump. The other thing that you should be aware of is that many of the decisions made by Donald Trump & his White House are either never implemented or were quietly dropped. I suspect the tariff decision may turn out to be another example of this category of decisions from this administration.

Meanwhile we can see PMetal dropping sharply today. The share price is now trading near the psychological RM5.00 mark, after it dropped to an intra-day low of RM4.91. If the psychological RM5.00 mark were to be violated, the stock may still find support at the 30-week SMA line at RM4.80.


Chart: PMetal's weekly chart as at Mar 5, 2018_11.45 (Source: ShareInvestor.com)

In FY2017, PMetal's exported about RM143 million of products to the American region (presumably America). This represents about 1.75% of its total sales valued at RM8.17 billion. Thus, the impact of a US tariff, if implemented, is likely to be minimal.


Table: PMetal's segmental results for FY2017

Based on the above, Trump's poor record of follow through on his decisions and PMetal's small exposure to the US market, I believe the selldown for PMetal is overdone. You should consider not selling your shares in PMetal, if you have any, or even nibbling into this stock at the current price. Good luck!

Note:
I hereby confirm that I do not have any direct interest in the security or securities mentioned in this post. However, I could have an indirect interest in the security or securities mentioned as some of my clients may have an interest in the acquisition or disposal of the aforementioned security or securities. As investor, you should fully research any security before making an investment decision.

Friday, March 02, 2018

Teoseng: In a Sweet Spot

Result Update

In QE31/12/2017, Teoseng's net profit rose 179% q-o-q or 237% y-o-y to RM12.8 million while revenue rose 8% q-o-q or 6% y-o-y to RM118 million. The revenue increased mainly due to the increase in selling price of eggs and sales quantity. Coupled with the lower raw material and operating cost, the pre-tax profit increased from RM3.1 million to RM11.9 million.


Table: Teoseng's 8 quarterly result


Graph 1: Teoseng's 21 quarterly result

Heading for Higher Profit

Poultry players can be involved in layer or broiler operation (to produce either egg or meat), upstream feedmill operation or downstream retail operation. Teoseng is involved mainly in layer operation and it is the biggest layer farm operator in the country. This is based on an old report from Bursadummy (here).


Table 2: Malaysian major poultry operators (Source: Bursadummy)

For Teoseng o make good profit, it needs to have good egg prices and low raw material prices. In the past 6 months, egg prices have been fairly firm at around an average of 35 sen apiece. If egg prices can stay at this level for a few more months, Teoseng will get a big boost in revenue. Teoseng will get a secondary lift in revenue due to higher output - unlike some operators which have not increased their output capacity due to earlier depressed egg prices.


Graph 2: Egg Average Price Chart as at Feb 9, 2018 (Source: DVS. gov.my)

Teoseng will benefit from lower corn prices. Corn, which is the main input for production of chicken feed, have been at the low for the past 3 years. Despite this favorable price, poultry farmers did not enjoy the full benefit due to weak MYR. Now that MYR has strengthened, the poultry farmer will enjoy the benefit of lower corn prices.


Chart 1: Corn price for 10 years to Feb 2018 (Source: Nasdaq.com)

Based on the above, I believe Teoseng is likely to see higher profit next few months.

Valuation

Teoseng (closed at RM0.985 yesterday) is now trading at a trailing PER of 84 times (based on last 4 quarters' EPS of 1.16 sen). However, if we annualized the profit (using the QE31//12/2017 number), the PER for Teoseng is 6 times. At this PER, the stock is deemed fairly attractive.

Technical Outlook

Teoseng is in a downtrend. If it can surpass the RM1.00-1.05, the stock may be over and the next upleg may begin.


Chart 2: Teoseng's weekly chart as at Mar 1, 2018 (Source: ShareInvestor.com)

Conclusion

Based on improved financial performance and attractive valuation, Teoseng could be a good stock for a recovery play.

Note:
I hereby confirm that I do not have any direct interest in the security or securities mentioned in this post. However, I could have an indirect interest in the security or securities mentioned as some of my clients may have an interest in the acquisition or disposal of the aforementioned security or securities. As investor, you should fully research any security before making an investment decision.

AEON: Tentative Signs of Recovery Appear

Background

AEON Co. (M) Bhd ("AEON") was incorporated on September 15, 1984, and listed on Bursa Malaysia in 1997. It is the leading chain of General Merchandising Stores and supermarkets in Malaysia, where most of its outlets are situated in suburban residential areas and catering for the middle income group. AEON Group is also involved in specialty store operations, shopping canter development and operations, credit card business and services.

Past Financial Performance 

AEON's profits peaked in FY2013 and then went into a decline for 3 years in FY2014-2016. Despite a lethargic top-line, AEON's bottom-line reversed in FY2017 due to higher margin and better operation expenses control.


Graph 1: AEON's last 9 yearly results

Recent Financial Performance 

For QE31/12/2017, AEON's net profit rose 321% q-o-q or 26% y-o-y to RM39 million while revenue rose 11% q-o-q or 5% y-o-y to RM1.07 billion. The profit before tax increased by 28.5% q-o-q due to higher margin and better operation expenses control.


Table: AEON's last 8 quarterly results


Graph 2: AEON's last 44 quarterly results

Latest Financial Position

As at 31/12/2017, AEON's financial position is deemed weak with current ratio at only 0.34x and total liabilities to total equity at 1.25x. The extremely low current ratio is due to the use of short-term borrowings and suppliers' credit to finance its property, plant & equipment which amounted to RM3.50 billion as at 31/12/2017. This low level of liquidity can be addressed by capital-raising or by monetizing the shopping centers owned by the group.

Valuation

AEON (closed at RM1.61 yesterday) is now trading at a PE of 23 times (based on last 4 quarters' EPS of 6.86 sen). At this PER, AEON is fully valued. If profit recovery materializes, then PER would drop and the stock will be more attractive.

Technical Outlook

AEON has broken below its long-term uptrend line, SS at RM1.60. If it can recover back above this support, the slow recovery may begin.


Chart 1: AEON's monthly chart as at Mar 1, 2018 (Source: ShareInvestor.com)


Chart 2: AEON's weekly chart as at Mar 1, 2018 (Source: ShareInvestor.com)

Conclusion

Based on improved financial performance, AEON could be a good stock for a recovery play.

Note:
I hereby confirm that I do not have any direct interest in the security or securities mentioned in this post. However, I could have an indirect interest in the security or securities mentioned as some of my clients may have an interest in the acquisition or disposal of the aforementioned security or securities. As investor, you should fully research any security before making an investment decision.