Wednesday, August 08, 2018

DUFU: Earning Soared

Result Update

For QE30/6/2018, Dufu's net profit rose 105% q-o-q or 72% y-o-y to RM12 million while revenue rose 11% q-o-q or 43% y-o-y to RM59 million. Revenue rose strongly q-o-q due to the strong demand in the HDD segment and together with the favorable USD exchange rates against MYR also attributed to the increase in profit before tax.


Table: Dufu's last 8 quarterly result


Graph: Dufu's last 20 quarterly result

Financial Position

Dufu's financial position as at 30/6/2018 is deemed healthy. Its current ratio and gearing ratio stood at 3.6 times and 0.3 times respectively.

Valuation

Dufu (closed at RM1.62 yesterday) is now trading at a trailing PER of 8.8x (based on last 4 quarters' EPS of 18.4 sen). At this PER, Dufu is deemed fairly attractive.

Technical Outlook

Dufu broke above its downtrend line, RR at RM1.05 in mid-July. The stock has been rallying higher ever since the bullish breakout. It may soon test the May 2017 high of RM1.65. To go higher, Dufu must break above this level. We will have to wait and see whether it can do so.


Chart 1: Dufu's weekly chart as at Aug 7, 2018 (Source: ShareInvestor)


Chart 2: Dufu's monthly chart as at Aug 7, 2018 (Source: ShareInvestor)

Conclusion

Based on good financial performance, healthy financial position and fairly attractive valuation, Dufu is a good stock for long-term investment. However the share price may be due for some correction after its recent sharp rally. It will be safer to buy on weakness than to charge in right now.

Note:

I hereby confirm that I do not have any direct interest in the security or securities mentioned in this post. However, I could have an indirect interest in the security or securities mentioned as some of my clients may have an interest in the acquisition or disposal of the aforementioned security or securities. As investor, you should fully research any security before making an investment decision.

HARTA: Strong Earning & Revenue Growth

Result Update

For QE30/6/2018, Harta's net profit rose 7% q-o-q or 30% y-o-y to RM125 million while revenue rose 15% q-o-q or 18% y-o-y to RM706 million. Revenue increased q-o-q driven by higher sales volume which increased by 6.4% and higher average selling prices. PBT rose 8% q-o-q in line with higher sales revenue attained, lower heat cost, chemical cost, upkeep of plant & machinery and improved operational efficiency.


 Table: Harta's last 8 quarterly results


Graph: Harta's last 43 quarterly results

Valuation

Harta (closed at RM6.17 yesterday) is trading at a trailing PER of 44 times (based on last 4 quarters' EPS of 14.16 sen). At this PER, Harta is deemed fully valued. However, its PEG ratio is fairly reasonable at 1.2 times based on EPS CAGR of 37% over the past 2 years.

Technical Outlook

Harta is trapped within a symmetrical triangle. If it can break to the upside of the triangle at the RM6.20, its uptrend will likely continue.


Chart 1: Harta's daily chart as at Aug 7, 2018 (Source: Shareinvestor.com)


Chart 2: Harta's weekly chart as at Aug 7, 2018 (Source: Shareinvestor.com)

Conclusion

Based on improved operating performance, strong leadership in the glove sector and capable management team, Harta is considered a good stock for long-term investment. Its rating is kept at HOLD due to its demanding valuation.

Note:
I hereby confirm that I do not have any direct interest in the security or securities mentioned in this post. However, I could have an indirect interest in the security or securities mentioned as some of my clients may have an interest in the acquisition or disposal of the aforementioned security or securities. As investor, you should fully research any security before making an investment decision.

Friday, August 03, 2018

Unisem: Earnings Rebounded

Results Update

For QE30/6/2018, Unisem's net profit rose 4-fold q-o-q but dropped 26% y-o-y to RM31 million  while revenue rose 7% q-o-q but dropped 6% y-o-y to RM343 million. Revenue & net profit dropped y-o-y primarily due to the depreciation of USD/MYR exchange rates as compared to the prevailing rates a year ago. The decline in net profits for the current quarter and financial period to date was further impacted by the lower profit margins arising from change in product mix. PBT rose q-o-q mainly due to foreign exchange gain of RM10.02 million as opposed to the foreign exchange loss of RM9.95 million previously as well as improvement in sales volume.


Table: Unisem's last 8 quarterly results


Graph: Unisem's last 55 quarterly results

Valuation

Unisem (closed at RM2.59 yesterday) is now trading at a PE of 17 times (based on last 4 quarters' EPS of 14.9 sen). At this PER, Unisem is deemed fully valued. It has a decent dividend yield of 3.9% fro those who wants to hold it for longer term.

Technical Outlook

Unisem tested its long-term uptrend line, SS at RM1.80 in May, and rebounded.


Chart 1: Unisem's monthly chart as at Aug 2, 2018 (Source: Shareinvestor.com)

However Unisem may not have broken above its downtrend since it peaked in August last year.


Chart 2: Unisem's weekly chart as at Aug 2, 2018 (Source: Shareinvestor.com)

Conclusion

Despite the improvement in its financial performance, Unisem's near term outlook is still uncertain due to negative technical outlook and fairly demanding valuation. I think one should take profit (if any) if Unisem reached the RM2.70 mark.

Note:

I hereby confirm that I do not have any direct interest in the security or securities mentioned in this post. However, I could have an indirect interest in the security or securities mentioned as some of my clients may have an interest in the acquisition or disposal of the aforementioned security or securities. As investor, you should fully research any security before making an investment decision.

Thursday, August 02, 2018

BPPLAS: An Attractive Packaging Stock

Background

BP Plastics Holding Bhd ("BPPLAS") is a Polyethylene (PE) Film manufacturer, supplying Cast Stretch and Blown Shrink films, and other PE packaging films and bags. It exports almost 80% of its products mainly to the Asian, Middle East and European region countries. 

BPPLAS has 2 manufacturing locations within the Sri Gading Industrial Estate in Batu Pahat, Joho. These factories have a total built-up area of 295,000 square feet and a production capacity of 6,500 metric tons per month.

Recent Financial Results

BPPLAS has just announced its result for QE30/6/2018. Its net profit rose 3% q-o-q or 192% y-o-y to RM4.75 million while revenue was mixed- down 3% q-o-q but up 12% y-o-y to RM82.6 million. Revenue dropped q-o-q due to more public holidays.

PBT dropped 10% q-o-q mainly due to lower production output arising from more public holidays. Net profit rose 3% q-o-q mainly due to deferred tax adjustment.

Table: BPPLAS's last 8 quarterly P&L

Graph 1: BPPLAS's last 19 quarters' P&L

Historical Financial Performance

BPPLAS's revenue has been rising steadily over the past 7 years. Profits jumped in FY2015 & FY2016 due to favorable forex regime. This benefit has dissipated as our RM rebounded in 2017. However, RM has weakened somewhat lately and this may help to boost the bottom-line for BPPLAS.


Graph 2: BPPLAS's last 11 years' P&L

Financial Position

As at 30/6/2018, BPPLAS's financial position is deemed healthy with current ratio and gearing ratio at 6 times and 0.2 times. Cash in hand amounted to RM36 million or RM0.19 per share.

Valuation

BPPLAS (closed at RM1.00 yesterday) is now trading at a PER of 11 times (based on last 4 quarters' EPS of 9.1 sen). If the cash in hand is deducted from the share price, then BPPLAS's PER will be lowered to 9 times. BPPAS also paid a decent dividend totaling 4 sen last 4 quarters- giving it a dividend yield of 4%. Overall, BPPLAS is deemed fairly attractive.

Technical Analysis

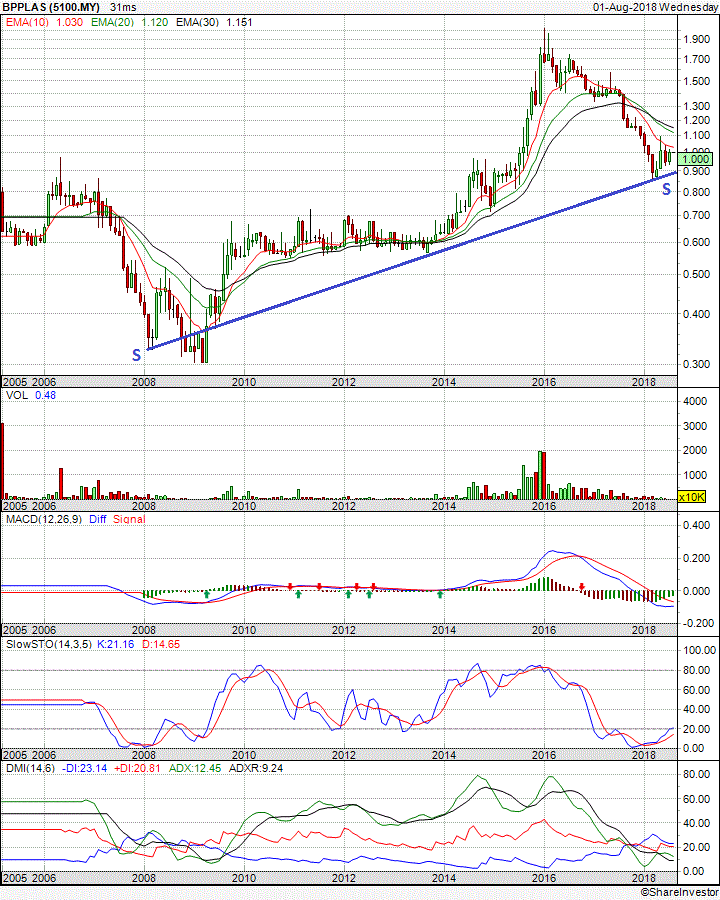
BPPLAS has tested and rebounded off its long-term uptrend line, SS at RM0.85 in April. It is still in an intermediate downtrend.


Chart 1: BPPLAS's monthly chart as at Aug 1, 2018(Source: Shareinvestor.com)  


Chart 2: BPPLAS's mweekly chart as at Aug 1, 2018(Source: Shareinvestor.com)  

Conclusion

Based on good financial performance & position and relatively attractive valuation, BPPLAS could be a good stock for medium-term investment. However its upside potential depends on whether it can break above the intermediate downtrend. If the share price can go above RM1.10, the stock may begin its next upleg.

Note:

I hereby confirm that I do not have any direct interest in the security or securities mentioned in this post. However, I could have an indirect interest in the security or securities mentioned as some of my clients may have an interest in the acquisition or disposal of the aforementioned security or securities. As investor, you should fully research any security before making an investment decision.

Wednesday, August 01, 2018

Perstim: Operational Earning Improved

Results Update

For QE30/6/2018, Pertim's net profit dropped 6% q-o-q but rose 328% y-o-y to RM12 million while revenue rose 2.4% q-o-q or 0.6% y-o-y to RM239 million. Revenue rose q-o-q due to higher sales volume coupled with higher selling price. The Group recorded a profit before tax of RM15.8 million compared with RM16.0 million in the Previous Quarter. The lower profit before tax was due to financial year adjustment in the Previous Quarter despite higher profit margin and higher sales volume in the Current Quarter.


Table: Perstim's last 8 quarterly P&L


Graph: Perstim's last 56 quarters' P&L

Valuation

Perstim (closed at RM4.84 yesterday) is now trading at a trailing PER of 15 times (based on last 4 quarters' EPS of 32.15 sen). If the last 2 quarterly earnings can be maintained for the next 2 quarters, then its full year EPS will be about 50 sen. That will lower its current year PER to 9.7 times- making the stock fairly attractive. In addition, Perstim has an attractive dividend payment record, with DY of 6.2%.

Technical Outlook

Perstim has broken above the strong horizontal resistance at RM4.50. This could signal the start of the next upleg for the stock.


Chart 1: Perstim's weekly chart as at July 31, 2018(Source: Shareinvestor.com)  

In addition, Perstim had tested its long-term uptrend line at RM3.50, and that line is still intact.


Chart 2: Perstim's monthly chart as at July 31, 2018(Source: Shareinvestor.com)  

Conclusion

Based on improved financial performance, attractive valuation and bullish technical outlook, I revise my rating for Perstim from a Sell to a BUY.

Note:

I hereby confirm that I do not have any direct interest in the security or securities mentioned in this post. However, I could have an indirect interest in the security or securities mentioned as some of my clients may have an interest in the acquisition or disposal of the aforementioned security or securities. As investor, you should fully research any security before making an investment decision.

Tuesday, July 31, 2018

Topglov: Just The Same Old Bad News!

Topglov failed in its bid to obtain a Mareva injunction from the KL High Court against Adventa Capital and related owners that will prevent dealings in their assets (here). This is part of the legal suit filed to seek damages and losses totaling RM715 million from the purchase of Aspion Sdn Bhd. Topglov claims that it had entered into the sale & purchase agreement based on misrepresentation made by Adventa Capital and related owners.

On opening, Topglov share price dropped to a low of RM9.72. However, the decline was short-lived and the share price recovered back above RM10.00 by 9.30 a.m.

At the current price of RM10.10, Topglov is trading at a PER of 29.8 times. That's just marginally higher than Supermx's PER of 28.1 times. For the largest rubber glove producer in Malaysia - and the world - to be trading at a PER nearly matching the smallest of the Big 4 rubber glove producers is a good buying opportunity.


Tuesday, July 24, 2018

Market Outlook as at July 25, 2018

In the past 12 days, our market has enjoyed a scorching rally off the low at 1660. FBMKLCI may soon encounter resistance at 1775 or 1795. Those who had bought in late June or early July, should be sitting on decent paper profit. I think it is a good idea to take some profit off the table. Since FBMKLCI has broken above its downtrend line, it is likely that the market can begin its recovery. This bullish breakout can be seen for the other indices- FBM70, FBMSCAP & FBMACE.


Chart 1: FBMKLCI's daily chart as at July 24, 2018 (Source: Shareinvestor.com)


Chart 2: FBM70's daily chart as at July 24, 2018 (Source: Shareinvestor.com)


Chart 3: FBMACE's daily chart as at July 24, 2018 (Source: Shareinvestor.com)


 Chart 4: FBMSCAP's daily chart as at July 24, 2018 (Source: Shareinvestor.com)

Meanwhile we should note that DJIA, which has managed to stay above its 200-day SMA line as well as its uptrend line, is now poised to test the line connecting its recent reaction highs (denoted at "AB"). If DJIA can surpass the AB line at 25400, it may continue with its prior uptrend.


Chart 5: DJIA's daily chart as at July 23, 2018 (Source: Stockcharts.com)

Despite the brouhaha about trade war, we can see Shanghai's SSEC index has rebounded somewhat in the past 2 weeks. While it must be noted that the worst is not over yet for SSEC as it is in a downward channel, it is still good to see this stock market - caught in the middle of Trump's terrible tantrum - is shaking it off and steeping up.


Chart 6: SSEC's daily chart as at July 23, 2018 (Source: Stockcharts.com)

Based on the above, I believe the time is right to buy some good blue chip stocks as well as attractive 2nd liners for long-term investment - especially if you have not done it yet. However this market will not go up in straight line fashion. If you feel like cashing in some of your paper profit - or you have been waiting to reduce position as long ago as May or June - the market is now at a level attractive enough for you to do so. But, don't forget to buy back when the prices eased back- which is not a guarantee. Good luck!

Monday, July 23, 2018

LIIHEN: Attractive Furniture Stock

Recent Financial Result

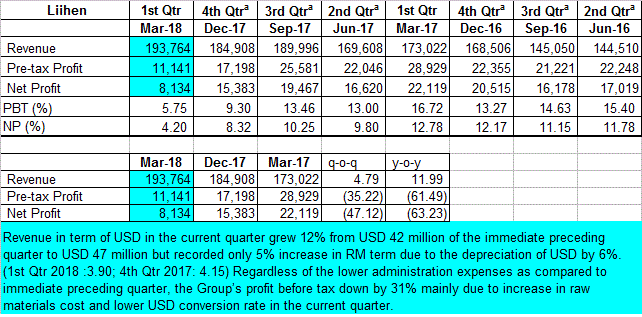
In QE31/3/2018, Liihen's net profit dropped 47% q-o-q or 63% y-o-y to RM8.1 million while revenue rose 4.8% q-o-q or 12.0% y-o-y to RM194 million. Revenue in term of USD grew 12% from USD 42 million of the immediate preceding quarter to USD 47 million but recorded only 5% increase in RM term due to the depreciation of USD by 6%. (1st Qtr 2018 :3.90; 4th Qtr 2017: 4.15) Regardless of the lower administration expenses as compared to immediate preceding quarter, the Group’s profit before tax down by 31% mainly due to increase in raw materials cost and lower USD conversion rate in the current quarter. With the USD strengthening in the past 3 months, Liihen's profits for QE30/6/2018 may enjoy a boost. [Note: Liihen's result for QE31/3/2018 was released on May 24, 2018.]


Table: Liihen's last 8 quarterly results


Graph: Liihen's last 22 quarterly results

Financial Position

As at 31/3/2018, Liihen's financial position is deemed healthy with current ratio at 2.2 times and total liabilities to total equity of 0.47 times. It has net cash of RM85.7 million or RM0.476 per share).

Valuation

Liihen (closed at RM2.84 at the end of the morning) is now trading at a trailing PER of 8.6 times (based on last 4 quarters' EPS of 33.1 sen). If the net cash is deducted from the share price, then the trailing PER would be lowered to 7.1 times. It paid total dividend of 18.5 sen last 4 quarters, which gives a dividend yield of 6.5%. The PER and DY numbers show Liihen to be an attractive stock.

Technical Outlook

Liihen has been in an intermediate downtrend from November last year. It could have broken above that downtrend line at RM2.75.


Chart 1: Liihen's daily chart as at July 23, 2018_12.30am (Source: Shareinvestor.com)

Liihen is still in a long-term uptrend line, with support at RM2.20.


Chart 2: Liihen's monthly chart as at July 23, 2018_12.30am (Source: Shareinvestor.com)

Conclusion

Despite weaker financial performance, Liihen is a good stock for long-term investment based on its healthy financial position, attractive valuation & bullish technical outlook.

Note:
I hereby confirm that I do not have any direct interest in the security or securities mentioned in this post. However, I could have an indirect interest in the security or securities mentioned as some of my clients may have an interest in the acquisition or disposal of the aforementioned security or securities. As investor, you should fully research any security before making an investment decision.

Thursday, July 19, 2018

BAT: Green Shoots of Recovery Sighted

Result Update

For QE30/6/2018, BAT's net profit rose 23% q-o-q but dropped 16% y-o-y to RM96 million while revenue dropped by 9% q-o-q or 17% y-o-y to RM638 million.

Revenue rose 6.5% q-o-q due to volume growth of 4.8% versus the first quarter of 2018. The Group registered a market share of 57.2% (new reporting vs. 53.5% at old reporting) in the second quarter of 2018 (based on restated legal market share), despite a 1.0ppt-decrease in market share registered by Dunhill to 39.7% from 40.7% in the first quarter 2018 (Note: The correction of 1.0ppt versus preceding quarter was partially due to the growth of Value for Money (VFM) segment and the continuous pressure of high levels of illegal and quasi legal (illegal tax stamps) trade.

Value for money brands increased its market share by 0.2ppt and Aspirational Premium brands increased their market share marginally by 0.2ppt.  This improving volume performance was the main driver for the second quarter revenue and gross profit growth of 6.5% (RM41 million) and 8.7% (RM 17 million) respectively, when compared to the preceding quarter.

Operating expenses were 9.7% (or, RM6 million) lower than preceding quarter. Operating expenses dropped due to lower overhead costs driven by cost base transformation initiatives the Group has undertaken and timing of other operating expenditure. As a result, Profit from Operations in the second quarter of 2018 grew 17.1% (RM22 million) when compared to the preceding quarter.


Table: BAT's last 8 quarterly results

BAT's revenue grew for the first time after declining for the past 3 years. Profits have been declining in a zig-zag fashion - with the magnitude determined by provisioning exercise or timing of expenses.


Graph: BAT's last 45 quarterly results

Valuation

BAT (closed at RM33.68 yesterday) is now trading at a PER of 22 times (based on the last 4 quarters' EPS of 151.7 sen). BAT has paid out quarterly dividend payment totaling of 154 sen over the past 4 quarters; thus giving a Dividend Yield of 4.6%. It is encouraging to note that dividend increased to 35 sen from 33 sen in QE31/3/2018.

Technical Outlook

BAT is still in a long-term downtrend line, with resistance at RM37.80-38.00.


Chart 1: BAT's weekly chart as at July 19, 2018 (Source: Malaysiastock.biz)


Chart 2: BAT's monthly chart as at July 19, 2018 (Source: Shareinvestor.com)

Conclusion

Based on possible turnaround in financial performance and increased dividend payment, BAT is now worth considering for long-term investment. However its next upleg will only begin once BAT managed to break above its downtrend line at RM37.80-38.00.

Note:
I hereby confirm that I do not have any direct interest in the security or securities mentioned in this post. However, I could have an indirect interest in the security or securities mentioned as some of my clients may have an interest in the acquisition or disposal of the aforementioned security or securities. As investor, you should fully research any security before making an investment decision.

MNRB: Share Price Plunged


Latest Development

MNRB has announced that it plans to carry out a Rights Issue to raise RM400 million by end of 2018. The proceed will be used for the following purposes:
1) RM300 million to fund 2 companies Takaful Iklas Bhd and a new company that will assume the general takaful business from Takaful Iklas Bhd; and
2) RM100 million to develop new products for the local insurance market.
As noted before, the market is adverse to any form of fund-raising exercise these days. Thus the market reacted very negatively to this Rights Issue announcement from MNRB. This resulted in the share price plunging as much as 35 sen to a low of RM1.99. See the daily & monthly charts below.


Chart 1: MNRB's daily chart as at Jul 19, 2018_3.30pm (Source: Shareinvestor.com)

 
Chart 2: MNRB's monthly chart as at Jul 19, 2018_3.30pm (Source: Shareinvestor.com)

Financial Performance

MNRB's financial performance over the past 5 quarters has been satisfactory. This compared favorably to the loss-making period from late 2014 to early 2016. The improved performance was attributable to favorable investment holding and takaful business as well as steady performance from the general reinsurance business which more than offset the poorer performance from the retakaful business.


 Table: MNRB's last 10 quarterly results

Looking at the long-term profit trend, MNRB is affected by competition which lowered its profit margin. The question is how will it improve its bottom-line if profit margin remains depressed.


Graph: MNRB's last 44 quarterly results

Valuation

MNRB (at RM2.04 as at 4.44pm) is now trading at a very low PER of 4.8 times (based on last 4 quarters' EPS of 42.8 sen). Its PBR is also undemanding at 0.4 time. BAsed on such attractive valuation, MNRB is a good stock for long-term investment.

Conclusion

Based on attactive valuation, MNRB is a good stock for long-term investment.

Note:
I hereby confirm that I do not have any direct interest in the security or securities mentioned in this post. However, I could have an indirect interest in the security or securities mentioned as some of my clients may have an interest in the acquisition or disposal of the aforementioned security or securities. As investor, you should fully research any security before making an investment decision.

Tuesday, July 10, 2018

Topglov: Technical Rebound


Topglov is having a strong technical rebound today. If you managed to buy yesterday, you may be keen to know what are the resistance levels to aim to take some profit. I think the natural level will be the psychological level of RM10.00. I have drawn a few horizontal lines where resistance can be expected- RM9.90, RM10.35 & RM10.70.


Chart: Topglov's daily chart as at July 10, 2018_2.45pm (Source: Shareinvestor.com)

Despite the strong rebound in the share price, some Topglov call warrants are still dropping. In selecting call warrants to buy, you follow this set of rules:
1. Select CWs with adequate time to expiry (say more than 3 months)
2. Select CWs with low premium (say, 10% or less)
3. Select CWs with good gearing
4. Select CWs that's not too deeply OTM

Of course, we have skipped the first rule in picking CWs to buy; that's select the tight right stock. In this case, I believe that Topglov is still a good stock to BUY.

From klsescreener, I have extracted all the CWs of Topglov. I have sorted them according to their expiry dates. Only 4 CWs meet the first rule on time to expiry (highlighted in yellow). Only one CW, Topglov-C29 meets the remaining 3 rules (Note: The premium of slightly above 10% is stretching the rule a bit).


Table: Topglov's CWs terms & valuation (Source: Klsecreener)

Topglov-C24, C27, C28, C30 & C31 have very short time to expiry and carry substantial (time value) premium. Avoid these 5 CWs.

Good luck!

Monday, July 09, 2018

Topglov: The Gloves Are Off

Last Friday, Topglov announced that it have taken legal proceedings against Adventa Capital Pte Ltd (“Adventa”) vide the KL OS and the Singapore OS, as well as Low Chin Guan, Wong Chin Toh and ACPL Sdn Bhd (“ACPL”) vide the Writ Action on 29.6.2018 and 2.7.2018.

This is in relation to Topglov’s wholly-owned subsidiary’s Top Care Sdn Bhd (“Top Care”)’s purchase of the 270,850,119 shares in Aspion Sdn Bhd (“Aspion”) from Adventa Capital for a fixed amount of RM1.37 billion in January this year.

Topglov claimed that Adventa & its sponsors have made misrepresentations which resulted in Topglov & Top Care entering into the agreement to purchase Aspion. Topglov and Top care are claiming for a sum of not less than RM714,862,759 arising from a conspiracy to defraud them.

The loss of RM714.86 million for Topglov, with outstanding issue shares of 1.28 billion units, translates to a loss of 56 sen per share. Its NTA will be reduced from RM1.78 to RM1.22. If we exclude the impact of this one-off exceptional loss, Topglov (now at RM9.00 @9.45am) is trading at a PER of 26 times (based on  last 4 quarters' EPS of 34.3sen). That's fairly attractive for a rubber glove stock. Even Supermx is now trading at a PER of 28 times (based on price of RM4.50 & last 4 quarters' EPS of 15.9 sen).

Chartwise, Topglov's immediate support is at the horizontal line at RM8.00. next support will be at the tentative uptrend line, SS at RM6.50. 


Chart: Topglov's monthly chart as at july 9, 2018 (Source: Shareinvestor,com)

Based on good financial performance & attractive valuation, Topglov is a good BUY.

Thursday, July 05, 2018

Hohup-WA: What's UP?!


Hohup-wa (now at RM0.125) is one of the top volume security traded today. This warrant has the following terms:
Exercise price: RM0.60
Expiry date: December 21, 2018 (169 days)
Conversion ratio: 1-to-1
As Hohup is now trading at only RM0.515, Hohup-wa is out-the-money. The entire amount of the warrant price of RM0.125 is conversion premium, and this will slowly decay over the next 169 days. Be careful if you choose to get into Hohup-wa.


Chart 1: Hohup-wa's daily chart as at July 5, 2018_4.40pm (Source: Shareinvestor.com)


Chart 2: Hohup's daily chart as at July 5, 2018_4.40pm (Source: Shareinvestor.com)

Note: I spoke about this in a BURSA MALAYSIA webinar entitled Warrant 101 on July 3. The first trap to avoid in trading warrant is a warrant exactly like Hohup-wa.

Sunday, July 01, 2018

Cypark: Earning Soared

Result Update

For QE30/4/2018, Cypark's net profit rose 53% q-o-q or 62% y-o-y to RM12 million while revenue increased by 18% q-o-q & % y-o-y to RM99 million. Revenue and profit before tax rose q-o-q mainly due to the better income contributed by the intense specialist work activities performed in the current stage of the project cycle in Environmental Engineering division.


 Table: Cypark's last 8 quarterly results


Graph: Cypark's last 32 quarterly results

Valuation

Cypark (closed at RM2.29 last Friday) is now trading at a PE of 9.3 times (based on last 4 quarters' EPS of 24.72 sen). At this multiple, Cypark is deemed fairly attractive.

Technical Outlook

Cypark broke its long-term uptrend line, SS at RM2.50 in April. Its decline has been checked by the horizontal line at RM2.20.


Chart 1: Cypark's monthly chart as at Jun 29, 2018 (Source: Shareinvestor.com)

On closer look, the horizontal support appears to be at RM2.25


Chart 2: Cypark's weekly chart as at Jun 29, 2018 (Source: Shareinvestor.com)

Conclusion

Based on the good financial performance and fairly attractive valuation, I consider a good stock for long-term investment. My rating is downgraded to a HOLD because of the breakdown below the uptrend line.

Note:
I hereby confirm that I do not have any direct interest in the security or securities mentioned in this post. However, I could have an indirect interest in the security or securities mentioned as some of my clients may have an interest in the acquisition or disposal of the aforementioned security or securities. As investor, you should fully research any security before making an investment decision.

AEONCR: Earning Rebounded Strongly

Result Update

For QE30/5/2018, AEONCR's net profit rose 21% q-o-q or 31% y-o-y to RM99 million while revenue rose 5% q-o-q or 8% y-o-y to RM326 million. Pre-tax profit rose 25% q-o-q mainly due to lower impairment loss on financial receivables.


Table: AEONCR's last 8 quarterly results

As noted previously, AEONCR's revenue & profits are at a new "high" territory!


Graph: AEONCR's last 44 quarterly results

Valuation

AEONCR (closed at RM14.40 last Friday) is now trading at a PE of 10.7 times (based on last 4 quarters' EPS of 135 sen). At this PER, AEONCR is deemed fairly attractive. In addition, it pays a decent dividend with DY of 2.9% (based on last year dividend of  41.13 sen).

Technical Outlook

Despite recent correction, AEONCR's uptrend seems intact as the decline was stopped by the 30-week EMA line.


Chart 1: AEONCR'sweekly chart as at Jun 29, 2018 (Source: Shareinvestor.com)


Chart 2: AEONCR's monthly chart as at Jun 29, 2018 (Source: Shareinvestor.com)

Conclusion

Based on satisfactory financial performance, fairly attractive valuation, steady growth prospect & positive technical outlook, AEONCR is a good stock for long-term investment.

Note:

I hereby confirm that I do not have any direct interest in the security or securities mentioned in this post. However, I could have an indirect interest in the security or securities mentioned as some of my clients may have an interest in the acquisition or disposal of the aforementioned security or securities. As investor, you should fully research any security before making an investment decision.