(Source: KLGreetings)
This is a personal weblog, reflecting my personal views and not the views of anyone or any organization, which I may be affiliated to. All information provided here, including recommendations (if any), should be treated for informational purposes only. The author should not be held liable for any informational errors, incompleteness, or delays, or for any actions taken in reliance on information contained herein.
Wednesday, September 08, 2010
Tuesday, September 07, 2010
MNRB- a cheap financial stock
Background
MNRB Holdings Bhd ('MNRB') is involved in re-insurance as well as in takaful insurance. In Malaysia, there are presently 5 reinsurers and 2 full-fledged retakaful operators (plus one branch retakaful operation).
Recent Financial Results
MNRB's recent financial results has been very erratic. For QE30/6/2010, MNRB managed to turnaround & chalked up a net profit if RM26 million on a turnover of RM387 million. MNRB was not impact by any significant provision for impairment loss & exceptional insurance claim during the quarter. Higher turnover is attributable to increase in gross premium written by re-insurance subsidiary.
MNRB expects to achieve good results for FYE31/3/2011.

Table 1: MNRB's last 10 quarterly results
From the chart below, we can see that MNRB's turnover has been growing steadily while its net profit could be due for an upswing.

Chart 1: MNRB's last 14 quarterly results
Valuation
MNRB (closed at RM2.70 yesterday) is now trading at a PER of 6 times (based on its last 4 quarters' EPS of 44 sen). In addition, MNRB is trading at a Price to Book of 0.6 time only. Based on these multiples, MNRB is deemed very attractive.
Technical outlook
Since its listing, MNRB has been trapped within a giant triangle, with resistance at RM5.10 & support at RM2.60. Presently, MNRB is trading at the support, which should be a good entry to this stock.

Chart 2: MNRB's monthly chart as at Sept 1, 2010 (Source: Tradesignum)
Conclusion
Based on attractive valuation & good technical support, MNRB could be a good stock for long-term investment.
MNRB Holdings Bhd ('MNRB') is involved in re-insurance as well as in takaful insurance. In Malaysia, there are presently 5 reinsurers and 2 full-fledged retakaful operators (plus one branch retakaful operation).
Recent Financial Results
MNRB's recent financial results has been very erratic. For QE30/6/2010, MNRB managed to turnaround & chalked up a net profit if RM26 million on a turnover of RM387 million. MNRB was not impact by any significant provision for impairment loss & exceptional insurance claim during the quarter. Higher turnover is attributable to increase in gross premium written by re-insurance subsidiary.
MNRB expects to achieve good results for FYE31/3/2011.
Table 1: MNRB's last 10 quarterly results
From the chart below, we can see that MNRB's turnover has been growing steadily while its net profit could be due for an upswing.
Chart 1: MNRB's last 14 quarterly results
Valuation
MNRB (closed at RM2.70 yesterday) is now trading at a PER of 6 times (based on its last 4 quarters' EPS of 44 sen). In addition, MNRB is trading at a Price to Book of 0.6 time only. Based on these multiples, MNRB is deemed very attractive.
Technical outlook
Since its listing, MNRB has been trapped within a giant triangle, with resistance at RM5.10 & support at RM2.60. Presently, MNRB is trading at the support, which should be a good entry to this stock.
Chart 2: MNRB's monthly chart as at Sept 1, 2010 (Source: Tradesignum)
Conclusion
Based on attractive valuation & good technical support, MNRB could be a good stock for long-term investment.
Monday, September 06, 2010
Eksons- an attractive timber stock
Background
Eksons Corporation Bhd ('Eksons') is involved in the manufacture & sale of veneer, plywood & sawn timber.
Recent Financial Results
For QE30/6/2010, Eksons's net profit increased by 302% y-o-y to RM9.2 million on the back of a 20%-increase in turnover to RM70 million. As compared to the immediate preceding quarter (QE31/3/2010), its net profit declined by 7.2% on the back of a 2%-decline in turnover. The decline in net profit was because the results for QE31/3/2010 includes an income of RM9.9 million arising from an adjustment to development cost recognized in the acquisition of Rusella Teguh SB.

Table: Eksons's 8 quarterly results

Chart 1: Eksons's last 8 quarterly results
Financial Position
Eksons's financial position as at 30/6/2010 is deemed very healthy with current ratio of 3 times and very little bank borrowings (of RM38 million) as compared to its shareholders' funds of RM371 million.
Industrial Outlook
Prices of timber and timber products are beginning to inch higher (see Chart 2 below). The higher prices should translated into better profitability for Eksons & other timber companies.

Chart 2: Prices of Timber & Timber products (Source: International Tropical Timber Organization, ITTO)
Valuation
Based on its close of RM0.945 today, Eksons is trading at a PE of 4.2 times (based on an annualized EPS of 22.5 sen). At this multiple, Eksons is deemed quite attractive. Assuming a PE of 7 times (for mid-size company), Eksons's fair value is about RM1.58.
Technical Outlook
Eksons is rising gradually after it broke above its downtrend line in April 2009. Its immediate horizontal support is at RM0.90-91 and its strong horizontal resistance is at RM1.25.

Chart 3: Eksons's weekly chart as at Sept 3, 2010 (Source: Quickcharts)
Conclusion
Based on better timber prices, improving financial performance, strong financial position, attractive valuation & finally positive technical outlook, Eksons is considered a good stock for medium-term investment.
Eksons Corporation Bhd ('Eksons') is involved in the manufacture & sale of veneer, plywood & sawn timber.
Recent Financial Results
For QE30/6/2010, Eksons's net profit increased by 302% y-o-y to RM9.2 million on the back of a 20%-increase in turnover to RM70 million. As compared to the immediate preceding quarter (QE31/3/2010), its net profit declined by 7.2% on the back of a 2%-decline in turnover. The decline in net profit was because the results for QE31/3/2010 includes an income of RM9.9 million arising from an adjustment to development cost recognized in the acquisition of Rusella Teguh SB.
Table: Eksons's 8 quarterly results
Chart 1: Eksons's last 8 quarterly results
Financial Position
Eksons's financial position as at 30/6/2010 is deemed very healthy with current ratio of 3 times and very little bank borrowings (of RM38 million) as compared to its shareholders' funds of RM371 million.
Industrial Outlook
Prices of timber and timber products are beginning to inch higher (see Chart 2 below). The higher prices should translated into better profitability for Eksons & other timber companies.
Chart 2: Prices of Timber & Timber products (Source: International Tropical Timber Organization, ITTO)
Valuation
Based on its close of RM0.945 today, Eksons is trading at a PE of 4.2 times (based on an annualized EPS of 22.5 sen). At this multiple, Eksons is deemed quite attractive. Assuming a PE of 7 times (for mid-size company), Eksons's fair value is about RM1.58.
Technical Outlook
Eksons is rising gradually after it broke above its downtrend line in April 2009. Its immediate horizontal support is at RM0.90-91 and its strong horizontal resistance is at RM1.25.
Chart 3: Eksons's weekly chart as at Sept 3, 2010 (Source: Quickcharts)
Conclusion
Based on better timber prices, improving financial performance, strong financial position, attractive valuation & finally positive technical outlook, Eksons is considered a good stock for medium-term investment.
Friday, September 03, 2010
Lonbisc- why the excessive Fixed Assets?
Lonbisc's bullish breakout has come & is nearly gone. What happened?

Chart: Lonbisc's weekly chart as at Sept 3, 2010 (Source: Quickcharts)
I revisited my earlier piece on Lonbisc (here) and examined its balance sheet thoroughly- something that I should have done previously. I was surprised that Lonbisc has a poor balance sheet as at 30/6/2010. Its current ratio was very low at 0.7 times- which means that if the company were to sell off all its stocks & collect back all its receivable, these proceeds plus the cash & bank balances, is only equivalent to 70% of its current liabilities. Its gearing ratio [or bank borrowings to shareholders' funds] is also fairly high at about 0.7 times. How did this come about? On closer study, it seems that the group has excessive Fixed Assets ('FA'). As at 30/6/2010, its FA stood at RM392 million or 79% of its Total Assets of RM499 million. This looks excessive when compared to its turnover of RM220 million for FY2010 (unaudited).
According to its annual report for FY2009, Plant & Machinery ('P&M') & P&M under installation totaled RM241 million or accounted for 76% of Total Assets. Even if we stripped off the P&M under installation of RM42 million, Lonbisc's P&M of RM199 million looks excessively high when compared to a turnover of RM184 million! This means that Lonbisc required RM1.00 of P&M to generate 92 sen of sales in FY2009.
If we look at Lonbisc a few years earlier, the situation is only slightly better. For FY2006, Lonbisc has P&M of RM71 million & P&M under installation of RM56 million and it achieved a turnover of RM108 million. This means that for every RM1.00 of P&M owned, Lonbisc generated RM1.52 of sales in FY2006. So, Lonbisc's assets utilization deteriorated from FY2006 to FY2009!
Let's compare Lonbisc with Mamee. If we look at Mamee's annual report for FY2009, we would see that Mamee had FA of RM117 million (of which P&M amounted to RM27 million). It recorded a turnover of RM411 million. This means that for every RM1.00 of P&M owned, Mamee generated RM15.22 of sales in FY2009.
Another company we can compared with is Cocoaland. Based on its results for FY2009, Cocoaland had FA of RM50 million (of which P&M amounted to RM13 million). It recorded a turnover of RM133 million. This means that for every RM1.00 of P&M owned, Cocoaland generated RM10.23 of sales in FY2009.
Despite the deterioration in its assets utilization, Lonbisc continued to increase its investment in FA. As noted earlier, its FA stood at RM392 million as compared to its turnover of RM220 million for FY2010 (unaudited).
This very odd situation raised many questions. Among them are:
1. Why does Lonbisc require so much P&M as compared to Mame & Cocoaland?
2. Why is Lonbisc acquiring more P&M as reflected in the presence of P&M under installation in FY2006 as well as in FY2009?
3. Is the recent sale of its stake in Lay Hong part of a program to address the imbalance in its Assets & Liabilities?
Until some of these hard questions are answered satisfactory, I doubt investors would want to invest more in this stock. As such, I believe Lonbisc should be rated a SELL ON STRENGTH.
Chart: Lonbisc's weekly chart as at Sept 3, 2010 (Source: Quickcharts)
I revisited my earlier piece on Lonbisc (here) and examined its balance sheet thoroughly- something that I should have done previously. I was surprised that Lonbisc has a poor balance sheet as at 30/6/2010. Its current ratio was very low at 0.7 times- which means that if the company were to sell off all its stocks & collect back all its receivable, these proceeds plus the cash & bank balances, is only equivalent to 70% of its current liabilities. Its gearing ratio [or bank borrowings to shareholders' funds] is also fairly high at about 0.7 times. How did this come about? On closer study, it seems that the group has excessive Fixed Assets ('FA'). As at 30/6/2010, its FA stood at RM392 million or 79% of its Total Assets of RM499 million. This looks excessive when compared to its turnover of RM220 million for FY2010 (unaudited).
According to its annual report for FY2009, Plant & Machinery ('P&M') & P&M under installation totaled RM241 million or accounted for 76% of Total Assets. Even if we stripped off the P&M under installation of RM42 million, Lonbisc's P&M of RM199 million looks excessively high when compared to a turnover of RM184 million! This means that Lonbisc required RM1.00 of P&M to generate 92 sen of sales in FY2009.
If we look at Lonbisc a few years earlier, the situation is only slightly better. For FY2006, Lonbisc has P&M of RM71 million & P&M under installation of RM56 million and it achieved a turnover of RM108 million. This means that for every RM1.00 of P&M owned, Lonbisc generated RM1.52 of sales in FY2006. So, Lonbisc's assets utilization deteriorated from FY2006 to FY2009!
Let's compare Lonbisc with Mamee. If we look at Mamee's annual report for FY2009, we would see that Mamee had FA of RM117 million (of which P&M amounted to RM27 million). It recorded a turnover of RM411 million. This means that for every RM1.00 of P&M owned, Mamee generated RM15.22 of sales in FY2009.
Another company we can compared with is Cocoaland. Based on its results for FY2009, Cocoaland had FA of RM50 million (of which P&M amounted to RM13 million). It recorded a turnover of RM133 million. This means that for every RM1.00 of P&M owned, Cocoaland generated RM10.23 of sales in FY2009.
Despite the deterioration in its assets utilization, Lonbisc continued to increase its investment in FA. As noted earlier, its FA stood at RM392 million as compared to its turnover of RM220 million for FY2010 (unaudited).
This very odd situation raised many questions. Among them are:
1. Why does Lonbisc require so much P&M as compared to Mame & Cocoaland?
2. Why is Lonbisc acquiring more P&M as reflected in the presence of P&M under installation in FY2006 as well as in FY2009?
3. Is the recent sale of its stake in Lay Hong part of a program to address the imbalance in its Assets & Liabilities?
Until some of these hard questions are answered satisfactory, I doubt investors would want to invest more in this stock. As such, I believe Lonbisc should be rated a SELL ON STRENGTH.
Mudajaya- going for the Test of the Low
Mudajaya has been drifting lower over the past few days. From the 60-minute chart below, we can see that Mudajaya has broken the horizontal lines of RM4.06 and RM3.90. Its next support is at RM3.75. The indicators are negative with RSI going deep into oversold territory & the -ve DMI is swinging up (both are precursors to a sustainable trending action in the same direction of the current trend).

Chart 1: Mudajaya's 60-minute chart as at Sept 3, 2010_11.13am (Source: Quickcharts)
From the daily chart below, we can see that the next horizontal support is at RM3.20-3.30.

Chart 2: Mudajaya's daily chart as at Sept 3, 2010_10.00am (Source: Quickcharts)
For those having the stock, you may want to reduce your position ahead of the test of the recent low of RM3.75. If Mudajaya can recover from the test of low, you may buy back the shares sold earlier. If it breaks below the RM3.75 level, you should close your position in this stock.
For those looking to get into the stock, you may do so once the test of the low has yielded a favorable results. This will take the form of a sharp rebound above RM3.85-3.90. This is a high risk & high reward trade that is strictly for the strong heart & nimble finger. If the trade does not work out in your favor (with a breakdown below the RM3.75 level), we may be staring at a quick move to the next horizontal line of RM3.20-3.30.
Check out an example of Test of the Low (here).
Chart 1: Mudajaya's 60-minute chart as at Sept 3, 2010_11.13am (Source: Quickcharts)
From the daily chart below, we can see that the next horizontal support is at RM3.20-3.30.
Chart 2: Mudajaya's daily chart as at Sept 3, 2010_10.00am (Source: Quickcharts)
For those having the stock, you may want to reduce your position ahead of the test of the recent low of RM3.75. If Mudajaya can recover from the test of low, you may buy back the shares sold earlier. If it breaks below the RM3.75 level, you should close your position in this stock.
For those looking to get into the stock, you may do so once the test of the low has yielded a favorable results. This will take the form of a sharp rebound above RM3.85-3.90. This is a high risk & high reward trade that is strictly for the strong heart & nimble finger. If the trade does not work out in your favor (with a breakdown below the RM3.75 level), we may be staring at a quick move to the next horizontal line of RM3.20-3.30.
Check out an example of Test of the Low (here).
Thursday, September 02, 2010
Petdag- rising like a rocket!
Background
Petronas Dagangan Bhd ('Petdag') is in the marketing and distribution of various petroleum products, such as motor gasoline, aviation fuel, kerosene, diesel, fuel oil, bunker fuel, lubricants, LPG, and asphalt.
Recent Financial Results
Petdag has recently announced its results for QE30/6/2010, where its net profit increased by 24% q-o-q to RM199.7 million while turnover was unchanged at about RM5.456 billion. The increased net profit on a q-o-q basis was attributable to lower operating expenditures.
Compared to the previous corresponding quarter (QE30/6/2009), Petdag's net profit declined by 2.9% on the back of a 14.2%-increase in turnover. The higher turnover on a y-o-y basis was higher selling prices & sales volume while lower net profit was attributable to lower gross profit.

Table: Petdag's 8 quarterly results

Chart 2: Petdag's last 9 quarterly results
Valuation
Petdag (closed at RM10.80 yesterday) is now trading at a PE of 14.2 times (based on last 4 quarters' EPS of 75.80 sen). At this multiple, Petdag is deemed fairly valued. If we assumed a PE of 15 times, the value of Petdag would be about RM11.40.
Technical Outlook
What really interest me is the long-term chart of Petdag. Chart 2 is the monthly chart plotted on log scale, which shows a stock that is in an uptrend line. Petdag has recently broken above the strong horizontal resistance of RM9.20 and it could be slowly rally towards the parallel line at about RM17-18.00.

Chart 2: Petdag's monthly chart as at Sept 1, 2010_log scale (Source: Tradesignum)
If we look at Chart 3, which is a monthly chart plotted on arithmetic scale, we can see from a different perspective the potential of the current rally in the stock. If the current breakout can travel a distance equivalent to 1 time the distance between the breakout level & its recent low of RM6.20, then the target price could be RM12.20. Alternatively, it may travel a distance equivalent to 1.68 time the distance between the breakout level & its recent low, then the target price could be RM14.24.
In 2007, Petdag broke above its then strong horizontal resistance of RM4.00 & traveled a distance of 1.68 time the distance between the breakout level (of RM4.00) & the low of about RM1.00.

Chart 3: Petdag's monthly chart as at Sept 1, 2010_arithmetic scale (Source: Tradesignum)
Conclusion
Based on technical consideration, Petdag could be a trading BUY or a medium-term investment. However, Petdag is trading very close to its full value of RM11.40 (assuming a PE of 15 times).
Note: Petdag is trading at RM11.80 as at 4.12pm!
Petronas Dagangan Bhd ('Petdag') is in the marketing and distribution of various petroleum products, such as motor gasoline, aviation fuel, kerosene, diesel, fuel oil, bunker fuel, lubricants, LPG, and asphalt.
Recent Financial Results
Petdag has recently announced its results for QE30/6/2010, where its net profit increased by 24% q-o-q to RM199.7 million while turnover was unchanged at about RM5.456 billion. The increased net profit on a q-o-q basis was attributable to lower operating expenditures.
Compared to the previous corresponding quarter (QE30/6/2009), Petdag's net profit declined by 2.9% on the back of a 14.2%-increase in turnover. The higher turnover on a y-o-y basis was higher selling prices & sales volume while lower net profit was attributable to lower gross profit.
Table: Petdag's 8 quarterly results
Chart 2: Petdag's last 9 quarterly results
Valuation
Petdag (closed at RM10.80 yesterday) is now trading at a PE of 14.2 times (based on last 4 quarters' EPS of 75.80 sen). At this multiple, Petdag is deemed fairly valued. If we assumed a PE of 15 times, the value of Petdag would be about RM11.40.
Technical Outlook
What really interest me is the long-term chart of Petdag. Chart 2 is the monthly chart plotted on log scale, which shows a stock that is in an uptrend line. Petdag has recently broken above the strong horizontal resistance of RM9.20 and it could be slowly rally towards the parallel line at about RM17-18.00.
Chart 2: Petdag's monthly chart as at Sept 1, 2010_log scale (Source: Tradesignum)
If we look at Chart 3, which is a monthly chart plotted on arithmetic scale, we can see from a different perspective the potential of the current rally in the stock. If the current breakout can travel a distance equivalent to 1 time the distance between the breakout level & its recent low of RM6.20, then the target price could be RM12.20. Alternatively, it may travel a distance equivalent to 1.68 time the distance between the breakout level & its recent low, then the target price could be RM14.24.
In 2007, Petdag broke above its then strong horizontal resistance of RM4.00 & traveled a distance of 1.68 time the distance between the breakout level (of RM4.00) & the low of about RM1.00.
Chart 3: Petdag's monthly chart as at Sept 1, 2010_arithmetic scale (Source: Tradesignum)
Conclusion
Based on technical consideration, Petdag could be a trading BUY or a medium-term investment. However, Petdag is trading very close to its full value of RM11.40 (assuming a PE of 15 times).
Note: Petdag is trading at RM11.80 as at 4.12pm!
Wednesday, September 01, 2010
How to make a call?
Recently, I've received an unpleasant, albeit polite comment (from reader nmb), which I have appended below:
This is a serious comment & it deserves to be addressed properly in a post. To start off, I would say that we are only human and we would much prefer flattery to unpleasant comments on our blog. However, I believe that continuous learning & self-improvement can only take place if one faces up to his or her shortcomings. In that spirit, I would like to address the comment posted by the reader nmb.
Let's begin with the purpose of this blog, which is a platform for me to communicate with my clients. Before I've started this blog, I used to write to them by emails. I find this to be a one-way communication, with very little feedback. In fact, this hasn't changed much as most of my readers are not my clients & none of my clients has ever posted any comments on my blog. However, I find the blog to be a better mean of communicating with my clients for the following reasons:
1. I can communicate with a wider audience which led to an improvement in my calls.
2. I can receive more feedback, comments & questions which allows me to look into different stocks or areas that I've overlooked.
The setting up of this blog has been a great learning experience. It is like taking a crash course in investment because one has to be familiar with something before one can comment on it. This led to a lot reading & studying. I have maintained a rigorous ritual of reading up on company news and announcements, especially results announcements. For example, I read about 800 results announcements in the last 2 weeks of August. This process is repeated in the months of November, February and May- as most of the listed companies have their financial year end at either December or June (with a small number in March) and as such, they must announce their quarterly results towards the end of the second month after the end of each quarter.
The information in this blog is generally published information. My input is mostly in the area of analysis & the drawing of conclusion. To do that, I rely on my working experience as a banker and remisier as well as my training as an accountant. I have also read up a fair bit on technical analysis which I strongly believe is critical to successful investing.
To make general market call, one must have some working knowledge of the economy & the impact of various policies or decisions taken by policy makers. That's one area that I am quite comfortable with. Before the age of the internet, I used to read the columns of Lester Thurow, Milton Friedman and Paul Samuelson in my school days (as my father was a subscriber to Newsweek) and today I continue to read up regularly on economics matters. This knowledge has come in very handy (here). I supplement this with my technical analysis of the main market barometers, such as DJIA and our FBM-KLCI (here).
When it comes to stock selection, I rely on fundamental analysis as well as technical analysis. A good stock satisfies a fundamental analyst but a great stock satisfied both the fundamental analyst and the technical analyst. Sometime, a stock satisfied the technical analyst but failed to impress the fundamental analyst or vice versa. We should not ignore such stocks because the fundamentals or the technicals of that stock may change one day. However, I would normally treat a stock that satisfies the technical requirement as a trading BUY.
If you do not do any fundamental or technical analysis before buying a stock, then you are either buying blindly or based on tips. Tips can come from many sources, with the usual one being your remisiers' tips and the more desirable (but illegal) one being the insiders' tips. The later is hard to come by and the former is hard to avoid. When you are in the market long enough, you would learn one very important lesson- there is no such thing as a sure thing. Similarly there is no such thing as first class information. A person with first class information would not want to share it with you unless you are his brother-in-law or until he is bloated with the same stock.
Having said what I must say in my defense, I must also admit that some of the points made by reader nmb are fair comment. Why call a buy on a stock that has gone up? Why not make the call them before they go up? I've tried to do the later but it is next to impossible. Many a time when you made a call on a stock that you think is about to move, the stock just do nothing but sit pretty (here). To be sure, I would rather make the BUY call when the stock has achieved a technical breakout. That would necessary mean that the share price has gone up- sometime a bit, but more often than not, quite substantially. When the readers get into the stocks, they may suffer a whipsaw. This happened very often when the stocks in question are fairly illiquid. Unfortunately, this is part & parcel of the game. The way to avoid this is to get in slowly or later but who can say whether the rally would wait for you. A train that has left the station would not reverse to pick up a few strays (here).
Finally, nobody can read the market correctly all the time. In a bull or a bear market, you appear smarter than you really are. In an uncertain market- either in its bottoming phase or its topping phase (like now)- you appear dumber than you really are. But, are we... dumber now or smarter then or just plain lucky?
To reader nmb, I would like to say thank you for the comment. I appreciate the fact that you take the trouble to give your constructive feedback.
Although i had read your blogs for few times, due to the recommendation of a friend, i found your comments is too technically, mean u describe most of the counters based on technical point of view.He further added:
When u raise a particular counter attention, i am afraid most of the times, it is too late. You only state the counter that had fly high after some announcements.
Honestly, i dont think your blogs or comments makes much differences to many other investors like me which hope to get first class news and tips.
I just wish that from the convenience of Internet, we can share some good news, analysis, or even insider tips (if we lucky), prior to the surge of a particular counters.
Finally, the conclusion is very simple, we want every traders to make profit from KLSE.
By the way, good job to Mr. Alex, and i hope improvements will be achieved.
This is a serious comment & it deserves to be addressed properly in a post. To start off, I would say that we are only human and we would much prefer flattery to unpleasant comments on our blog. However, I believe that continuous learning & self-improvement can only take place if one faces up to his or her shortcomings. In that spirit, I would like to address the comment posted by the reader nmb.
Let's begin with the purpose of this blog, which is a platform for me to communicate with my clients. Before I've started this blog, I used to write to them by emails. I find this to be a one-way communication, with very little feedback. In fact, this hasn't changed much as most of my readers are not my clients & none of my clients has ever posted any comments on my blog. However, I find the blog to be a better mean of communicating with my clients for the following reasons:
1. I can communicate with a wider audience which led to an improvement in my calls.
2. I can receive more feedback, comments & questions which allows me to look into different stocks or areas that I've overlooked.
The setting up of this blog has been a great learning experience. It is like taking a crash course in investment because one has to be familiar with something before one can comment on it. This led to a lot reading & studying. I have maintained a rigorous ritual of reading up on company news and announcements, especially results announcements. For example, I read about 800 results announcements in the last 2 weeks of August. This process is repeated in the months of November, February and May- as most of the listed companies have their financial year end at either December or June (with a small number in March) and as such, they must announce their quarterly results towards the end of the second month after the end of each quarter.
The information in this blog is generally published information. My input is mostly in the area of analysis & the drawing of conclusion. To do that, I rely on my working experience as a banker and remisier as well as my training as an accountant. I have also read up a fair bit on technical analysis which I strongly believe is critical to successful investing.
To make general market call, one must have some working knowledge of the economy & the impact of various policies or decisions taken by policy makers. That's one area that I am quite comfortable with. Before the age of the internet, I used to read the columns of Lester Thurow, Milton Friedman and Paul Samuelson in my school days (as my father was a subscriber to Newsweek) and today I continue to read up regularly on economics matters. This knowledge has come in very handy (here). I supplement this with my technical analysis of the main market barometers, such as DJIA and our FBM-KLCI (here).
When it comes to stock selection, I rely on fundamental analysis as well as technical analysis. A good stock satisfies a fundamental analyst but a great stock satisfied both the fundamental analyst and the technical analyst. Sometime, a stock satisfied the technical analyst but failed to impress the fundamental analyst or vice versa. We should not ignore such stocks because the fundamentals or the technicals of that stock may change one day. However, I would normally treat a stock that satisfies the technical requirement as a trading BUY.
If you do not do any fundamental or technical analysis before buying a stock, then you are either buying blindly or based on tips. Tips can come from many sources, with the usual one being your remisiers' tips and the more desirable (but illegal) one being the insiders' tips. The later is hard to come by and the former is hard to avoid. When you are in the market long enough, you would learn one very important lesson- there is no such thing as a sure thing. Similarly there is no such thing as first class information. A person with first class information would not want to share it with you unless you are his brother-in-law or until he is bloated with the same stock.
Having said what I must say in my defense, I must also admit that some of the points made by reader nmb are fair comment. Why call a buy on a stock that has gone up? Why not make the call them before they go up? I've tried to do the later but it is next to impossible. Many a time when you made a call on a stock that you think is about to move, the stock just do nothing but sit pretty (here). To be sure, I would rather make the BUY call when the stock has achieved a technical breakout. That would necessary mean that the share price has gone up- sometime a bit, but more often than not, quite substantially. When the readers get into the stocks, they may suffer a whipsaw. This happened very often when the stocks in question are fairly illiquid. Unfortunately, this is part & parcel of the game. The way to avoid this is to get in slowly or later but who can say whether the rally would wait for you. A train that has left the station would not reverse to pick up a few strays (here).
Finally, nobody can read the market correctly all the time. In a bull or a bear market, you appear smarter than you really are. In an uncertain market- either in its bottoming phase or its topping phase (like now)- you appear dumber than you really are. But, are we... dumber now or smarter then or just plain lucky?
To reader nmb, I would like to say thank you for the comment. I appreciate the fact that you take the trouble to give your constructive feedback.
Monday, August 30, 2010
Petgas's net profit jumped
Background
Petronas Gas Bhd ('Petgas') Petgas is involved in the gas business value chain, providing gas processing and transmission services to PETRONAS through two of its divisions. The Plant Operations Division (POD) handles all activities pertaining to the processing of feed gas whilst the Transmission Operations Division (TOD) is responsible for the transmission and delivery of sales gas to end customers throughout the peninsula. It also delivers sales gas to customers in East Malaysia through a 45km pipeline in Sarawak. In addition to the throughput services business, it has also diversified into manufacturing, supplying and marketing of industrial utility products to the Kertih Integrated Petrochemical Complex and Gebeng Industrial Area through our Centralized Utility Facilities (CUF) Division.
Recent Development
Petgas appears to be benefiting from a new Gas Processing & Transmission Agreement ('GATP') starting from 1 April 2010 to 31 March 2014. To be frank, I can't see the difference between the previous agreement (here) and the new one (here). However, I believe it has a very positive effect on Petgas's last quarter results where the turnover was marginally higher but the profit margin spiked up substantially. See Chart 1 below.

Chart 1: Patgas's profit margin for the last 16 quarterly results
Recent Financial Results
For QE30/6/2010, Petgas's net profit increased by 90% q-o-q or 42% y-o-y to RM383 million while turnover increased by 9% q-o-q or 11% y-o-y to RM873 million.

Table: Petgas's 8 quarterly results

Chart 2: Petgas's last 16 quarterly results
Valuation
Petgas (closed at RM10.40 last Friday) is now trading at a current PER of 13.4 times (based on annualized EPS of 77.4 sen). Assuming a PER of 15 times, Petgas should have a fair value of RM11.61. It dividend yield is reasonable at 4.8%.
Technical Outlook
Petgas is in an uptrend line with support at RM9.70-9.80. Its next horizontal resistance is RM10.50 & then RM12.00.

Chart 3: Petgas's monthly chart as at Aug 22, 2010_log scale (Source: Tradesignum)
Conclusion
Based on improved financial performance, attractive valuation & positive technical outlook, Petgas could be a good stock for long-term investment.
Petronas Gas Bhd ('Petgas') Petgas is involved in the gas business value chain, providing gas processing and transmission services to PETRONAS through two of its divisions. The Plant Operations Division (POD) handles all activities pertaining to the processing of feed gas whilst the Transmission Operations Division (TOD) is responsible for the transmission and delivery of sales gas to end customers throughout the peninsula. It also delivers sales gas to customers in East Malaysia through a 45km pipeline in Sarawak. In addition to the throughput services business, it has also diversified into manufacturing, supplying and marketing of industrial utility products to the Kertih Integrated Petrochemical Complex and Gebeng Industrial Area through our Centralized Utility Facilities (CUF) Division.
Recent Development
Petgas appears to be benefiting from a new Gas Processing & Transmission Agreement ('GATP') starting from 1 April 2010 to 31 March 2014. To be frank, I can't see the difference between the previous agreement (here) and the new one (here). However, I believe it has a very positive effect on Petgas's last quarter results where the turnover was marginally higher but the profit margin spiked up substantially. See Chart 1 below.
Chart 1: Patgas's profit margin for the last 16 quarterly results
Recent Financial Results
For QE30/6/2010, Petgas's net profit increased by 90% q-o-q or 42% y-o-y to RM383 million while turnover increased by 9% q-o-q or 11% y-o-y to RM873 million.
Table: Petgas's 8 quarterly results
Chart 2: Petgas's last 16 quarterly results
Valuation
Petgas (closed at RM10.40 last Friday) is now trading at a current PER of 13.4 times (based on annualized EPS of 77.4 sen). Assuming a PER of 15 times, Petgas should have a fair value of RM11.61. It dividend yield is reasonable at 4.8%.
Technical Outlook
Petgas is in an uptrend line with support at RM9.70-9.80. Its next horizontal resistance is RM10.50 & then RM12.00.
Chart 3: Petgas's monthly chart as at Aug 22, 2010_log scale (Source: Tradesignum)
Conclusion
Based on improved financial performance, attractive valuation & positive technical outlook, Petgas could be a good stock for long-term investment.
Friday, August 27, 2010
Rubber glove sector- when the going gets tough...
I have appended below the tables of the last 8 quarterly results for Supermx, Kossan & Harta (plus the charts of their past quarterly results). We can see that all three companies suffered a drop in their net profit in QE30/6/2010 when compared to the immediate preceding quarter (QE31/3/2010). Is this a sign that the balance has swung from a seller's market to a buyer's market? This may explain the drop in their profit margin as cost increases cannot be fully passed onto the customers. In my opinion, the rubber glove sector has crossed the tipping point & their profit would likely to continue to decline, albeit at a gradual rate. If this scenario panned out, I believe we have seen a peak in the share prices for all the stocks in this sector.

Table 1: Supermx's 8 quarterly results (plus chart)

Table 2: Kossan's 8 quarterly results (plus chart)

Table 3: Harta's 8 quarterly results (plus chart)
As such, it may be advisable to avoid these stocks for a while.
Table 1: Supermx's 8 quarterly results (plus chart)
Table 2: Kossan's 8 quarterly results (plus chart)
Table 3: Harta's 8 quarterly results (plus chart)
As such, it may be advisable to avoid these stocks for a while.
Integra's bottom-line improved
Results Update
Integra has just announced its results for QE30/6/2010. Its net profit increased by 54% q-o-q or 51% y-o-y to RM13.7 million while its turnover was up 2% q-o-q or 10% y-o-y to RM23.5 million. The improved performance was attributable to increased cargo throughput in its 2 ports off Lumut as well as its 20%-owned associate, PGMC due to higher shipment of nickel.

Table: Integra's 8 quarterly results

Chart 1: Integra's last 13 quarterly results
It's worth noting that PGMC's shipment of nickel ore jumped from 4 shipments of 128,363 DMT in QE31/3/2010 to 27 shipments of 873,739 DMT in QE30/6/2010. At this current rate, PGMC may ship out more nickel ore in 2010 as compared to total shipment of 1,227,221 DMT recorded in 2009. Prices of nickel is still way off its high of USD54,000 in 2007 but it has recovered substantially from the low of USD10,000 in early 2009.

Chart 2: Nickel's monthly prices
Valuation
Integra (closed at RM1.24 yesterday) is now trading at a PER of 8.8 times (based on the last 4 quarters' EPS of 14.12 sen). At this multiple, Integra is deemed attractive. It may trade up to a PER of 10 times, giving te stock a fair value of RM1.41.
Technical Outlook
Integra is in an uptrend line, with support at RM1.10. A parallel line can be drawn and it may mark the resistance level for the stock at RM1.40. See Chart 2 below.

Chart 3: Integra's daily chart as at Aug 26, 2010 (Source: Quickcharts)
From the monthly chart (plotted on logarithmic scale), we can see that Integra seems to move in cycles (or waves) . It may be on the crest of its present cycle, with limited upside.

Chart 3: Integra's monthly chart as at Aug 25, 2010 (Source: Tradesignum)
Conclusion
Based on improved financial performance & attractive valuation, Integra could be a good stock for long-term investment. However, the stock could be at the crest of its present cycle, with limited upside potential. To beat the cycle, Integra would depend on continued favorable return from its investment in PGMC. Would nickel ore continue to rise?
Integra has just announced its results for QE30/6/2010. Its net profit increased by 54% q-o-q or 51% y-o-y to RM13.7 million while its turnover was up 2% q-o-q or 10% y-o-y to RM23.5 million. The improved performance was attributable to increased cargo throughput in its 2 ports off Lumut as well as its 20%-owned associate, PGMC due to higher shipment of nickel.
Table: Integra's 8 quarterly results
Chart 1: Integra's last 13 quarterly results
It's worth noting that PGMC's shipment of nickel ore jumped from 4 shipments of 128,363 DMT in QE31/3/2010 to 27 shipments of 873,739 DMT in QE30/6/2010. At this current rate, PGMC may ship out more nickel ore in 2010 as compared to total shipment of 1,227,221 DMT recorded in 2009. Prices of nickel is still way off its high of USD54,000 in 2007 but it has recovered substantially from the low of USD10,000 in early 2009.
Chart 2: Nickel's monthly prices
Valuation
Integra (closed at RM1.24 yesterday) is now trading at a PER of 8.8 times (based on the last 4 quarters' EPS of 14.12 sen). At this multiple, Integra is deemed attractive. It may trade up to a PER of 10 times, giving te stock a fair value of RM1.41.
Technical Outlook
Integra is in an uptrend line, with support at RM1.10. A parallel line can be drawn and it may mark the resistance level for the stock at RM1.40. See Chart 2 below.
Chart 3: Integra's daily chart as at Aug 26, 2010 (Source: Quickcharts)
From the monthly chart (plotted on logarithmic scale), we can see that Integra seems to move in cycles (or waves) . It may be on the crest of its present cycle, with limited upside.
Chart 3: Integra's monthly chart as at Aug 25, 2010 (Source: Tradesignum)
Conclusion
Based on improved financial performance & attractive valuation, Integra could be a good stock for long-term investment. However, the stock could be at the crest of its present cycle, with limited upside potential. To beat the cycle, Integra would depend on continued favorable return from its investment in PGMC. Would nickel ore continue to rise?
Thursday, August 26, 2010
TWS- a good long-term investment
Background
Tradewinds (M) Bhd ('TWS') is involved oil palm cultivation, sugar refining and rice processing & distribution. For more on the group, check out its website (here).
Recent Financial Results
TWS's top-line & bottom-line rose sharply in the past 2 quarters after the completion of its acquisition of a majority 50.1%-stake in Padiberas Nasional Bhd ('Bernas') in January 2010. For QE30/6/2010, its net profit increased by 13% q-o-q or 562% y-o-y to RM87 million while turnover declined marginally by 1% compared to the immediate preceding quarter (QE31/3/2010) but increased by 210% y-o-y to RM1.286 billion.

Table 1: TWS's last 8 quarterly results

Chart 1: TWS's last 8 quarterly results
(Note:I have replaced Chart 1 as the earlier chart was not for TWS.)
Financial Position
The main concern for this stock is the high gearing position after the acquisition of Bernas. From Table 2 below, we can see that the gearing ratio is very high at 1.28 times while liquidity position as reflected in its current ratio is adequate at 1.26 times. As 54% of the bank borrowings are classified under current liabilities, they are most likely used to finance its working capital requirement. As such, I believe the gearing is not excessive though it would be good if the company can raise its capital & bring down the gearing ratio to below 1 time.

Table 2: TWS's Balance Sheet as at 30/6/2010
Valuation
TWS (closed at RM3.53 yesterday) is now trading at a PER of 3 times only (based on the annualized EPS of 119.52 sen). At this multiple, TWS is deemed very attractive.
Technical Outlook
TWS is trapped between the horizontal lines of RM3.30 & RM3.60. From October 2008 to July 2010, TWS was tracing out a pattern known as a wedge. The stock broke above the wedge in late July at RM3.30. As such, the RM3.30 is a strong support level.

Chart 2: TWS's weekly chart as at Aug 25, 2010 (Source: Quickcharts)
Conclusion
Based on major shift in financial performance & attractive valuation, TWS could be a good stock for long-term investment. However, the main concern for the stock is its higher gearing as well as nagging corporate governance issue that always follows its major shareholder, Syed Mokhtar.
Tradewinds (M) Bhd ('TWS') is involved oil palm cultivation, sugar refining and rice processing & distribution. For more on the group, check out its website (here).
Recent Financial Results
TWS's top-line & bottom-line rose sharply in the past 2 quarters after the completion of its acquisition of a majority 50.1%-stake in Padiberas Nasional Bhd ('Bernas') in January 2010. For QE30/6/2010, its net profit increased by 13% q-o-q or 562% y-o-y to RM87 million while turnover declined marginally by 1% compared to the immediate preceding quarter (QE31/3/2010) but increased by 210% y-o-y to RM1.286 billion.
Table 1: TWS's last 8 quarterly results

Chart 1: TWS's last 8 quarterly results
(Note:I have replaced Chart 1 as the earlier chart was not for TWS.)
Financial Position
The main concern for this stock is the high gearing position after the acquisition of Bernas. From Table 2 below, we can see that the gearing ratio is very high at 1.28 times while liquidity position as reflected in its current ratio is adequate at 1.26 times. As 54% of the bank borrowings are classified under current liabilities, they are most likely used to finance its working capital requirement. As such, I believe the gearing is not excessive though it would be good if the company can raise its capital & bring down the gearing ratio to below 1 time.
Table 2: TWS's Balance Sheet as at 30/6/2010
Valuation
TWS (closed at RM3.53 yesterday) is now trading at a PER of 3 times only (based on the annualized EPS of 119.52 sen). At this multiple, TWS is deemed very attractive.
Technical Outlook
TWS is trapped between the horizontal lines of RM3.30 & RM3.60. From October 2008 to July 2010, TWS was tracing out a pattern known as a wedge. The stock broke above the wedge in late July at RM3.30. As such, the RM3.30 is a strong support level.
Chart 2: TWS's weekly chart as at Aug 25, 2010 (Source: Quickcharts)
Conclusion
Based on major shift in financial performance & attractive valuation, TWS could be a good stock for long-term investment. However, the main concern for the stock is its higher gearing as well as nagging corporate governance issue that always follows its major shareholder, Syed Mokhtar.
Wednesday, August 25, 2010
Market Outlook as at August 25, 2010
Our FBM-KLCI is displaying the same pattern that we saw in the last quarter of 2007 & first month of 2008 (which I have denoted as 'X'). Back then, the index had a parabolic rise that culminated in a V-shape reversal. We may be witnessing a steady build-up of a parabolic rise over the past few weeks- with the promise of the blow-off stage to come. No one know how long & far this rally can go. However, we know from historical records that parabolic rises culminate in sharp falls. Notice how the MACD & RSI have both broken above their downtrend line (denoted as 'Y'), just like in the last quarter of 2007 (denoted as 'X'). This market may correct & rise again. Like a shooting star, the market may rise until it can rise no more. Be very careful...

Chart: FBM-KLCI's daily chart as at Aug 24, 2010 (Source: Tradesignum)
Sunway- a good long-term investment
Background
Sunway Holdings Bhd ('Sunway') is involved in the followings businesses:
Note: Sunway has recently changed its financial year end from June 30 to December 31. This means that comparison with previous year's quarterly results may be misleading. My comment below must be read with this proviso in mind.
Sunway has just announced its results for QE30/6/2010. Its net profit increased by 22% q-o-q or 164% y-o-y to RM48.6 million while turnover increased by 1.5% q-o-q or 35% y-o-y to RM509 million. From Chart 1 below, we can see that Sunway's bottom-line has been steadily for the last 4 quarters.

Table: Sunway's last 8 quarterly results

Chart 1: Sunway's last 12 quarterly results
Valuation
Sunway (closed at RM1.57 today) is now trading at a PER of 6.9 times (based on last 4 quarters' EPS of 22.82 sen). Assuming a PER of 10 times, Sunway's fair value could be about RM2.28.
Technical Outlook
From Chart 2 below, we can see that Sunway is in an uptrend. The uptrend line support is at RM1.40. However, if we looked at Chart 3, which is the monthly chart plotted on a logarithmic scale, we can see that Sunway is trapped within a rising or bearish wedge, with upside breakout at RM1.80 & downside breakout at RM1.40. If it can break above the RM1.80 level, Sunway may rise to the resistance posed by the line connecting the two most recent 'high' (denoted as 'RR') at RM2.40.

Chart 2: Sunway's daily chart as at Aug 25, 2010_9.20am (Source: Quickcharts)

Chart 3: Sunway's monthly chart as at Aug 2, 2010, plotted on log scale (Source: Tradesignum)
Conclusion
Based on steadily improving financial performance & attractive valuation, Sunway could be a good long-term investment.
Sunway Holdings Bhd ('Sunway') is involved in the followings businesses:
- constructing building and civil works and providing mechanical, electrical and piling works.
- trading and manufacturing construction and industrial products, building materials, etc.
- quarrying, manufacturing and supplying premix, manufacturing ready-mixed concrete and producing building stones.
- developing housing and commercial properties, leasing, managing, tenanting, licensing and disposing properties.
Note: Sunway has recently changed its financial year end from June 30 to December 31. This means that comparison with previous year's quarterly results may be misleading. My comment below must be read with this proviso in mind.
Sunway has just announced its results for QE30/6/2010. Its net profit increased by 22% q-o-q or 164% y-o-y to RM48.6 million while turnover increased by 1.5% q-o-q or 35% y-o-y to RM509 million. From Chart 1 below, we can see that Sunway's bottom-line has been steadily for the last 4 quarters.
Table: Sunway's last 8 quarterly results
Chart 1: Sunway's last 12 quarterly results
Valuation
Sunway (closed at RM1.57 today) is now trading at a PER of 6.9 times (based on last 4 quarters' EPS of 22.82 sen). Assuming a PER of 10 times, Sunway's fair value could be about RM2.28.
Technical Outlook
From Chart 2 below, we can see that Sunway is in an uptrend. The uptrend line support is at RM1.40. However, if we looked at Chart 3, which is the monthly chart plotted on a logarithmic scale, we can see that Sunway is trapped within a rising or bearish wedge, with upside breakout at RM1.80 & downside breakout at RM1.40. If it can break above the RM1.80 level, Sunway may rise to the resistance posed by the line connecting the two most recent 'high' (denoted as 'RR') at RM2.40.
Chart 2: Sunway's daily chart as at Aug 25, 2010_9.20am (Source: Quickcharts)
Chart 3: Sunway's monthly chart as at Aug 2, 2010, plotted on log scale (Source: Tradesignum)
Conclusion
Based on steadily improving financial performance & attractive valuation, Sunway could be a good long-term investment.
Tuesday, August 24, 2010
US markets in dangerous water again
Yesterday, I wrote about the arrival of the Hindenburg Omen for the US stock markets. This rare & rather abstract technical concept would not be easy to accept, not only by lay men but also by many technical analysts. While the Hindenburg Omen warns about the danger of a sharp drop or even a crash, what concerned me more is the possibility that the US stock markets may have made a top. I would use the 50, 100 & 200-day SMA lines to examine the US stock markets as represented by DJIA & S&P500.
From Chart 1 below, we can see that the 50-day SMA line has crossed below the 200-day SMA line for both DJIA & S&P500 in June. This negative signal, which is called the death cross, did not lead to a bear market for US stocks but instead was followed by a sharp rally in June & July. Now, the 100-day SMA line looks set to take a stab at the 200-day SMA line. How would another negative crossover impact the market?

Chart 1: DJIA & S&P500 daily chart up to August 23, 2010 (source: Stockcharts.com)
To answer the above question, let's look at Chart 2 below. We can see that DJIA & S&P500 made a top in 2007 & the confirmation of that top is attained when both the 50 & 100-day SMA lines had crossed below the 200-day SMA line in December 2007 & January 2008.

Chart 2: DJIA & S&P500 daily chart up to June 30, 2008 (source: Stockcharts.com)
Whether you buy the bearish implication of a confirmed Hindenburg Omen or not, you must take cognizance of the danger presented by the twin crossing of the 200-day SAM line by the 50 & 100-day SMA lines. If the 100-day SMA line were to cross below the 200-day line, then the US stock markets may have a confirmed top. What follows after a top is usually a bear market.
From Chart 1 below, we can see that the 50-day SMA line has crossed below the 200-day SMA line for both DJIA & S&P500 in June. This negative signal, which is called the death cross, did not lead to a bear market for US stocks but instead was followed by a sharp rally in June & July. Now, the 100-day SMA line looks set to take a stab at the 200-day SMA line. How would another negative crossover impact the market?
Chart 1: DJIA & S&P500 daily chart up to August 23, 2010 (source: Stockcharts.com)
To answer the above question, let's look at Chart 2 below. We can see that DJIA & S&P500 made a top in 2007 & the confirmation of that top is attained when both the 50 & 100-day SMA lines had crossed below the 200-day SMA line in December 2007 & January 2008.
Chart 2: DJIA & S&P500 daily chart up to June 30, 2008 (source: Stockcharts.com)
Whether you buy the bearish implication of a confirmed Hindenburg Omen or not, you must take cognizance of the danger presented by the twin crossing of the 200-day SAM line by the 50 & 100-day SMA lines. If the 100-day SMA line were to cross below the 200-day line, then the US stock markets may have a confirmed top. What follows after a top is usually a bear market.
Monday, August 23, 2010
The Hindenburg Omen Has Arrived
One of the most feared patterns in technical analysis is the dreaded Hindenburg Omen. According to Wikipedia, the Hindenburg Omen is a technical analysis that attempts to predict a forthcoming stock market crash. It is named after the Hindenburg disaster of May 6th 1937, where the German zeppelin was destroyed in a sudden conflagration.
The Hindenburg Omen is not a guarantee of a crash, and the five criteria that must be met for a Hindenburg trigger typically need to recur within 36 days for reconfirmation. The statistics are however very startling. Based on historical data, the probability of a move greater than 5% to the downside after a confirmed Hindenburg Omen was 77%, and usually takes place within the next forty-days. There is a 30% probability that a stock market crash - a drop of 15%- occurring a confirmed Hindenburg Omen. For the record, the first sighting was on August 12, while the second sighting (or, confirmation) was on August 20. The last time this signal was sighted was on June 6, 2008 & again on June 17, 2008 and we all know what happened shortly thereafter (go here).
The 5 criteria of the Omen are as follows:
The Hindenburg Omen is not a guarantee of a crash, and the five criteria that must be met for a Hindenburg trigger typically need to recur within 36 days for reconfirmation. The statistics are however very startling. Based on historical data, the probability of a move greater than 5% to the downside after a confirmed Hindenburg Omen was 77%, and usually takes place within the next forty-days. There is a 30% probability that a stock market crash - a drop of 15%- occurring a confirmed Hindenburg Omen. For the record, the first sighting was on August 12, while the second sighting (or, confirmation) was on August 20. The last time this signal was sighted was on June 6, 2008 & again on June 17, 2008 and we all know what happened shortly thereafter (go here).
The 5 criteria of the Omen are as follows:
- That the daily number of NYSE new 52-Week Highs and the daily number of new 52-Week Lows must both be greater than 2.2 percent of total NYSE issues traded that day.
- That the smaller of these numbers is greater than or equal to 69 (68.772 is 2.2% of 3126). This condition is a function of the 2.2% of the total issues.
- That the NYSE 10-Week moving average is rising.
- That the McClellan Oscillator is negative on that same day.
- That new 52-Week Highs cannot be more than twice the new 52-Week Lows (however it is fine for new 52-Week Lows to be more than double new 52-Week Highs).
Ogawa's performance continued to improve
Background
Ogawa World Bhd ('Ogawa') is involved in designing, marketing, retailing, distributing, and servicing of health care equipment and supplementary appliances. It provides a range of health and wellness equipment comprising various relaxation, therapeutic, fitness, diagnostic, and hygiene products.
Recent Financial Results
Ogawa's net profit increased by 256% q-o-q or 88% y-o-y to RM6.1 million, while turnover increased by 29% q-o-q or 14% y-o-y to RM47.7 million. The improved performance was attributable to higher sales & higher gross profit margin.

Table: Ogawa's last 8 quarterly results

Chart 1: Ogawa's last 8 quarterly results
Valuation
Ogawa (closed at RM0.44 last Friday) is now trading at a trailing PER of 6.4 times (based on last 4 qaurters' EPS of 6.9 sen). At this multiple, Ogawa is deemed fairly valued.
Technical Outlook
Ogawa is trying to break above the horizontal resistance of RM0.44. A break above that level could be the start of an upleg for this stock. Its immediate resistance is at RM0.51-52 & then at RM0.82.

Chart 2: Ogawa's weekly chart as at Aug 20, 2010 (Source: Quickcharts)
Conclusion
Based on improving financial performance & a possible upside break out above its horizontal resistance at RM0.44, Ogawa is worth tracking closely. If it succeed in breaking above the RM0.44 level with good volume, the stock could be a good trading BUY.
Ogawa World Bhd ('Ogawa') is involved in designing, marketing, retailing, distributing, and servicing of health care equipment and supplementary appliances. It provides a range of health and wellness equipment comprising various relaxation, therapeutic, fitness, diagnostic, and hygiene products.
Recent Financial Results
Ogawa's net profit increased by 256% q-o-q or 88% y-o-y to RM6.1 million, while turnover increased by 29% q-o-q or 14% y-o-y to RM47.7 million. The improved performance was attributable to higher sales & higher gross profit margin.
Table: Ogawa's last 8 quarterly results
Chart 1: Ogawa's last 8 quarterly results
Valuation
Ogawa (closed at RM0.44 last Friday) is now trading at a trailing PER of 6.4 times (based on last 4 qaurters' EPS of 6.9 sen). At this multiple, Ogawa is deemed fairly valued.
Technical Outlook
Ogawa is trying to break above the horizontal resistance of RM0.44. A break above that level could be the start of an upleg for this stock. Its immediate resistance is at RM0.51-52 & then at RM0.82.
Chart 2: Ogawa's weekly chart as at Aug 20, 2010 (Source: Quickcharts)
Conclusion
Based on improving financial performance & a possible upside break out above its horizontal resistance at RM0.44, Ogawa is worth tracking closely. If it succeed in breaking above the RM0.44 level with good volume, the stock could be a good trading BUY.
UMW's top-line & bottom-line rose sharply
Results Update
For QE30/6/2010, UMW's net profit increased by 59% q-o-q or 167% y-o-y to RM212 million, while turnover increased by 8% q-o-q or 27% y-o-y to RM3.282 billion. The improvement in turnover was attributable to higher sales of Toyota vehicles as well as industrial & heavy equipment. Bottom-line has improved in line with better sales as well as improved profit amrgin due to favorable forex movement & lower losses incurred by overseas associate.

Table: UMW's last 8 quarterly results

Chart 1: UMW's last 13 quarterly results
Valuation
UMW (closed at RM6.43 last Friday) is now trading at a trailing PER of 12.6 times (based on last 4 quarters' EPS of 51 sen). At its current rate of improvement in earning, UMW is trading at a fair multiple to its earning. Assuming a PER of 15 times, UMW's fair value could be RM7.65.
Technical Outlook
UMW has broken above its strong horizontal resistance at RM6.35. Its next resistance is at the horizontal lines of RM6.70 & RM6.80. The MACD & DMI have yet to turn up to signal the continuation of UMW's prior uptrend.

Chart 2: UMW's weekly chart as at Aug 20, 2010 (Source: Quickcharts)
Conclusion
Based on good financial performance, UMW could be a medium-term investment.
For QE30/6/2010, UMW's net profit increased by 59% q-o-q or 167% y-o-y to RM212 million, while turnover increased by 8% q-o-q or 27% y-o-y to RM3.282 billion. The improvement in turnover was attributable to higher sales of Toyota vehicles as well as industrial & heavy equipment. Bottom-line has improved in line with better sales as well as improved profit amrgin due to favorable forex movement & lower losses incurred by overseas associate.
Table: UMW's last 8 quarterly results
Chart 1: UMW's last 13 quarterly results
Valuation
UMW (closed at RM6.43 last Friday) is now trading at a trailing PER of 12.6 times (based on last 4 quarters' EPS of 51 sen). At its current rate of improvement in earning, UMW is trading at a fair multiple to its earning. Assuming a PER of 15 times, UMW's fair value could be RM7.65.
Technical Outlook
UMW has broken above its strong horizontal resistance at RM6.35. Its next resistance is at the horizontal lines of RM6.70 & RM6.80. The MACD & DMI have yet to turn up to signal the continuation of UMW's prior uptrend.
Chart 2: UMW's weekly chart as at Aug 20, 2010 (Source: Quickcharts)
Conclusion
Based on good financial performance, UMW could be a medium-term investment.
Friday, August 20, 2010
MISC- better results but still unattractive
Results Update
MISC has just announced its results for QE30/6/2010. Its net profit increased by 118% q-o-q or 83% y-o-y to RM428 million while turnover dropped 1% q-o-q or 16% y-o-y to RM3.27 billion. The improved performance is attributed to better results from the restructured Liner business as well as increased profitability from the Heavy Engineering business.

Table: MISC's last 8 quarterly results
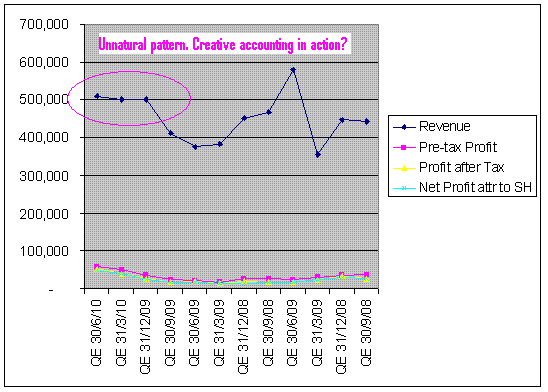
From Chart 1 below, we can see that MISC's turnover has stabilized after a sharp drop in 2008. Bottom-line has shown signs of recovery in the past 3 quarters.

Chart 1: MISC's last 17 quarterly results
Valuation
MISC (closed at RM8.86 yesterday) is now trading at a trailing PER of 42 times. At this multiple, MISC is deemed overvalued.
Technical Outlook
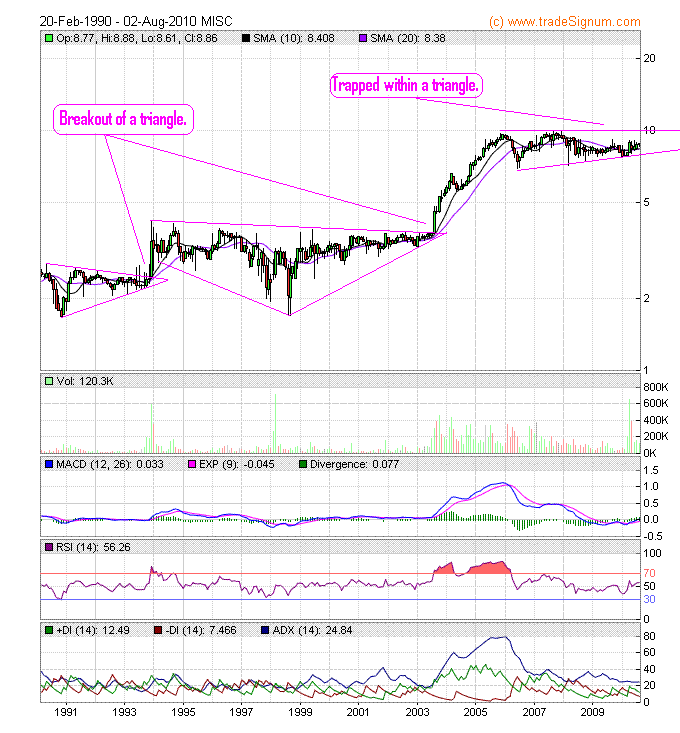
Like a giant oil tanker, MISC moved very slowly. Over the past 18 years, MISC had only rallied twice. Its first rally came at the end of the 1993 bull run and the next bull rally came in 2003-2006. The periods in between are marked by long sideway movement or consolidation (in the form of triangle or double-triangle). I believe MISC is now in such a formation, with prices trapped between RM8.00 & RM10.00.

Chart 2: MISC's monthly chart as at Aug 19, 2010 (Source: Tradesignum)
Conclusion
Based on high valuation & unattractive technical outlook, MISC is a stock to be avoided.
MISC has just announced its results for QE30/6/2010. Its net profit increased by 118% q-o-q or 83% y-o-y to RM428 million while turnover dropped 1% q-o-q or 16% y-o-y to RM3.27 billion. The improved performance is attributed to better results from the restructured Liner business as well as increased profitability from the Heavy Engineering business.
Table: MISC's last 8 quarterly results
From Chart 1 below, we can see that MISC's turnover has stabilized after a sharp drop in 2008. Bottom-line has shown signs of recovery in the past 3 quarters.
Chart 1: MISC's last 17 quarterly results
Valuation
MISC (closed at RM8.86 yesterday) is now trading at a trailing PER of 42 times. At this multiple, MISC is deemed overvalued.
Technical Outlook
Like a giant oil tanker, MISC moved very slowly. Over the past 18 years, MISC had only rallied twice. Its first rally came at the end of the 1993 bull run and the next bull rally came in 2003-2006. The periods in between are marked by long sideway movement or consolidation (in the form of triangle or double-triangle). I believe MISC is now in such a formation, with prices trapped between RM8.00 & RM10.00.
Chart 2: MISC's monthly chart as at Aug 19, 2010 (Source: Tradesignum)
Conclusion
Based on high valuation & unattractive technical outlook, MISC is a stock to be avoided.
Uchitec- good results & possible technical breakout
Results Update
Uchitec has just announced its results for QE30/6/2010. Its net profit increased by 40% q-o-q or 198% y-o-y to RM13.9 million while turnover increased by 4% q-o-q or 12% y-o-y to RM25 million. The company attributed the improved performance to increased demand for its products as well as increase in R&D projects.

Table: Uchitec's last 8 quarterly results
From Chart 1 below, we can see that Uchitec is slowly recovering after the steep drop in sales in 2007 & 2008.

Chart 1: Uchitec's last 18 quarterly results
Valuation
Uchitec (closed at RM1.41) is now trading at a trailing PER of 12 times (based on last 4 quarters' ESP of 11.69 sen). Uchitec, known for its high dividend payout, has seen its dividend yield sliding in the past 2 years. Today, its dividend yield stood at 4.3% only.
Technical Outlook
Uchitec may have broken to the upside of its symmetrical triangle at RM1.38-1.40. If it can recruit sufficient buying interest, it may test its horizontal resistance at RM1.60 & then at RM1.90.

Chart 2: Uchitec's weekly chart as at Aug 19, 2010 (Source: Quickcharts)
Conclusion
Based on steady improvement in financial performance & possible technical breakout, Uchitec could be a trading BUY or even a medium-term investment.
Uchitec has just announced its results for QE30/6/2010. Its net profit increased by 40% q-o-q or 198% y-o-y to RM13.9 million while turnover increased by 4% q-o-q or 12% y-o-y to RM25 million. The company attributed the improved performance to increased demand for its products as well as increase in R&D projects.
Table: Uchitec's last 8 quarterly results
From Chart 1 below, we can see that Uchitec is slowly recovering after the steep drop in sales in 2007 & 2008.
Chart 1: Uchitec's last 18 quarterly results
Valuation
Uchitec (closed at RM1.41) is now trading at a trailing PER of 12 times (based on last 4 quarters' ESP of 11.69 sen). Uchitec, known for its high dividend payout, has seen its dividend yield sliding in the past 2 years. Today, its dividend yield stood at 4.3% only.
Technical Outlook
Uchitec may have broken to the upside of its symmetrical triangle at RM1.38-1.40. If it can recruit sufficient buying interest, it may test its horizontal resistance at RM1.60 & then at RM1.90.
Chart 2: Uchitec's weekly chart as at Aug 19, 2010 (Source: Quickcharts)
Conclusion
Based on steady improvement in financial performance & possible technical breakout, Uchitec could be a trading BUY or even a medium-term investment.
Subscribe to:
Posts (Atom)