Wednesday, July 11, 2012

Axiata- uptrend to continue


Axiata has just broken above the line that connects the high over the past 18 months. It has also broken above its all-time high of RM5.60. With these double breakouts, Axiata is likely to continue its prior uptrend. My projection shows that the next target for Axiata is RM6.50.

Based on this, Axiata could be a good trading BUY.


Chart: Axiata's weekly chart as at July 11, 2012 (Source: Tradesignum)

BJFood to continue its uptrend

BJFood has broken above its recent high of RM1.44. In fact, the stock consolidated in an ascending triangle and the breakout at RM1.44 would represent the continuation of its prior uptrend. I had posted on this stock earlier (here).

Based on this, BJFood could be a good trading BUY.


Chart: BJFood's daily cahrt as at July 11, 2012_11.00am (Source: Quickcharts)

Tuesday, July 10, 2012

CPO testing its near-term downtrend line at RM3200

On June 15, I posted that CPO's downtrend may continue after it broke its long-term uptrend line at RM3200 (here). The sign for a possible extension of the downside move was flashed out when the Bollinger Band began to expand. Well, we can see from the chart below that the anticiapted downside move did not materialize. Instead CPO rebounded back above the RM3000 psychological level and went as far as testing the resistance from the violated long-term uptrend line at RM3200. In addition, the RM3200 level is also the near-term downtrend line resistance (see the chart below). Can CPO break above the near-term downtrend line as well as 'climb' back above that long-tern uptrend line? I think it is not likely within the next few weeks. The more likely scenario is a pullback to the psychological RM3000 before CPO can mount another attempt at the RM3200 level.


Chart: CPO's daily chart as at July 9, 2012 (Source: iFS.marketcenter.com)

Monday, July 09, 2012

SEG poised for a breakout?

Background

The proposed takeover of SEG by Pinnacle heritage Solutions Sdn Bhd at RM1.714 per share & RM1.214 per warrant was not successful (here). Nevertheless, it received good acceptance of 66% & 69% respectively (here). The company will continue to be listed on te exchange.


Recent Financial results

SEG's net profit increased by 23% q-o-q or 21% y-o-y to RM21.9 million while its revenue increased by 10% q-o-q or 14% y-o-y to RM78 million.


Table: SEG's last 8 quarterly results


Chart 1: SEG's last 16 quarterly results

Valuation

SEG (closed at RM1.94 today) is now trading at a PE of 13.3 times (based on last 4 quarters' EPS of 14.56 sen). For a company with a CAGR of 25% over the past 3 years (based on turnover), its PEG ratio is about 0.53 time. At that PEG ratio, SEG is deemed fairly attractive.


Technical Outlook

SEG has been consolidating in an oval shape pattern for the past 18-20 months. A breakout to the upside (or downside) would point the way forward for the stock. Its MACD & RSI have attempted to break to the upside recently. Are they signaling the possible breakout to come?


Chart 2: SEG's daily chart as at July 6, 2012 (Source: Tradesignum) 

Conclusion

Based on good financial performance, stable industrial outlook and attractive valuation, SEG is a good stock for long-term investment. It could be a trading BUY if it could break to the upside of the oval shape consolidation pattern (at RM2.00).

MPHB's uptrend to continue...

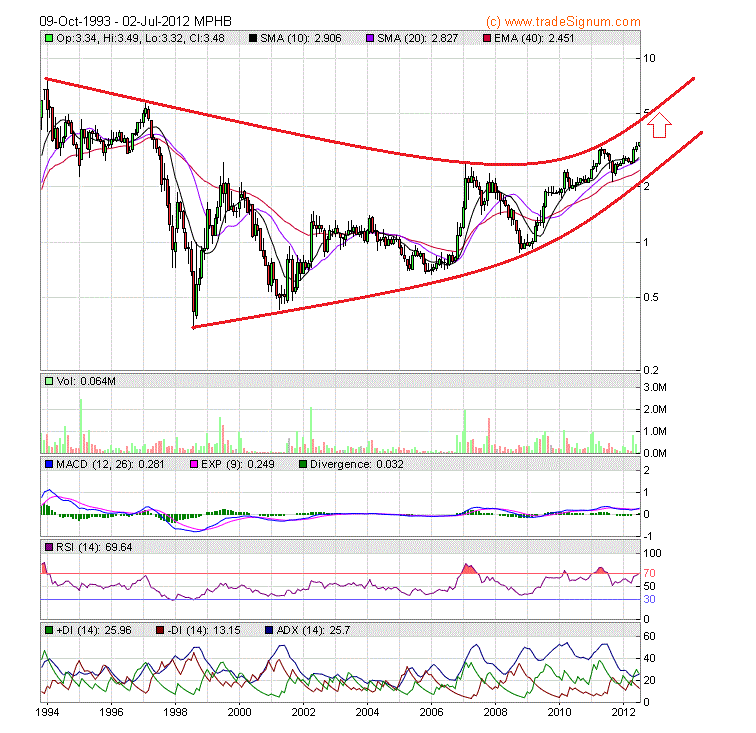
MPHB broke above its recent high of RM3.50 (see Chart 1). With this breakout, MPHB is likely to continue with its prior uptrend. From Chart 2 below, I believe MPHB's rise could pick up momentum & swing upward to RM4.50-5.00.
Based on the above, MPGB could be a trading BUY.


Chart 1: MPHB's 60-min chart as at July 9, 2012_4.30pm (Source: quickcharts)


Chart 2: MPHB's monthly chart as at July 6, 2012 (Source: Tradesignum)

Friday, July 06, 2012

Airasia poised for its next upleg?

Airasia had broken above its intermediate downtrend line at RM3.60 on May 4. It then went into a consolidation that took the shape of a triangle. Today, it is breaking above that triangle at RM3.80-3.82. If successful, this could be the start of the next upleg for Aiarasia. Its immediate resistance would be the psychological RM4.00 mark and then the recent high of RM4.14.

Based on technical consideration, Airasia could be a trading BUY.


Chart: Airasia's daily chart as at July 6, 2012_9.45am (Source: Quickcharts)


BJAsset- a cheap property stock with a twist

In line with the on-going REIT theme play, you may want to check out the company that owns Berjaya Time Square in Kuala Lumpur. According to Wikipedia, Berjaya Time Square is a twin tower complex containing a shopping centre and a five-star hotel. Both towers are 203 metres (666 ft) tall, with 48 floors. It is currently the seventh largest building in the world and has also been tagged as the "world's largest building ever built in a single phase", with 7.5 million square feet of built-up floor area. This building consists of shopping mall, business office and leisure centre with 1000 retail shops, 1200 luxury service suites, 65 food outlets and entertainment attractions such as Berjaya Times Square Theme Park and GSC MAXX (formerly IMAX) 2D & 3D theatre. For more on Berjaya Times Square, go here.

The company that owns Berjaya Times square is Berjaya Assets Bhd. It does not own the entire building, but a controlling majority of the floor space in Berjaya Times Square. The chart below shows that the stock is still in an uptrend line with support at RM0.80.


Chart: BJAsset's daily chart as at July 5, 2012 (Source: Tradesignum)

In addition to owning Berjaya Times Square, BJAsset is involved in a number forecasting business in Sarawak as well as provides lottery consultancy. For the 9-month ended 31/3/2012, BJAsset reported an operating profit of RM54.7 million, of which RM37.9 million came from property development & investment & RM20.9 million came from gaming operation.

BJAsset (at RM0.84) is now trading at a PE of 10 times (based on annualized EPS of 8 sen for FYE30/6/2012) or at a Price to Book of 0.5 times (based on NTA ps of RM1.65 as at 31/3/2012). For its results for QE31/3/2012, go here.

Based on cheap valuation, positive technical outlook (albeit not necessarily bullish) and potential for positive newsflow (if Berjaya Times Square is spinning off into a REIT), BJAsset could be a good stock for long-term investment.

Adventa has broken above its downtrend line

Results Update

Adventa had recently announced its results for QE30/4/2012. Its net profit increased by 127% q-o-q or 34% y-o-y to RM6.1 million while revenue inched up 2.7% q-o-q or 2.2% y-o-y to RM107 million. The company attributed the improvement to better margins and revenue from the synthetic glove segment & better cost control.


Table: Adventa;s last 8 quarterly results

From the chart below, we can see the slide in Adventa's bottom-line has finally reversed upward. From favorable movement in the prices of raw material & the strengthening of the USD, this trend is expected to continue.

\
Chart 1: Adventa's last 29 quarterly results

Valuation

Adventa (closed at RM1.61 yesterday) is now trading at a forward PE of 10 times (based on annualized EPS of 16.1 sen). At this PE, Adventa is deemed fairly valued and potential for limited upside.

Technical Outlook

Adventa has broken above its 2-year old downtrend line at RM1.50. With this breakout, Adventa may move sideway with the RM1.50 acting as a support or even commence on its next upleg.

Chart 2: Adventa's weekly charta s at July 5, 2012 (Source: Tradesignum)


Conclusion

Based on improved financial performance & technical outlook, Adventa could be a good stock for long-term investment. However, we will have to wait for a strong pick-up in its bottom-line to fire up a rally in this stock as the valuation is deemed nearly fully-valued.

Thursday, July 05, 2012

RSawit may have a bullish breakout

RSawit has just broken above its downtrend line at RM1.08. The last 2 time it did a breakout, it rallied quite significant. We may expect the same from this stock, possibly testing its recent high at RM1.19-1.20. If it can break above that level, it may go to a high of RM1.35-1.40.


Chart: RSawit's daily chart as at July 5, 2012 (Source: July 5, 2012)

I first posted on this stock in 2010 (here) when its outstanding shares was only 130 million. Since its massive Right Issue & Bonus Issue last year, its outstanding shares have ballooned to 1.3 billion. An investor who bought in 2010 would have seen his capital increased by 200%!

RSawit's net profit was RM66 million in FYE31/12/2012 as compared to RM41 million in the previous year. This means that RSawit achieved an EPS of 5 sen. At RM1.10, RSawit is now trading at a trailing PE of 22 times! For QE31/3/2012, it achieved a net profit of RM4.8 million- a drop from RM15.7 million previously. Based on this, RSawit is deemed fully valued.

Based on the above, I would rate RSawit a possible trading BUY. However, the stock is deemed fully valued and this may cap its upside potential.

Fimacor may do catch-up

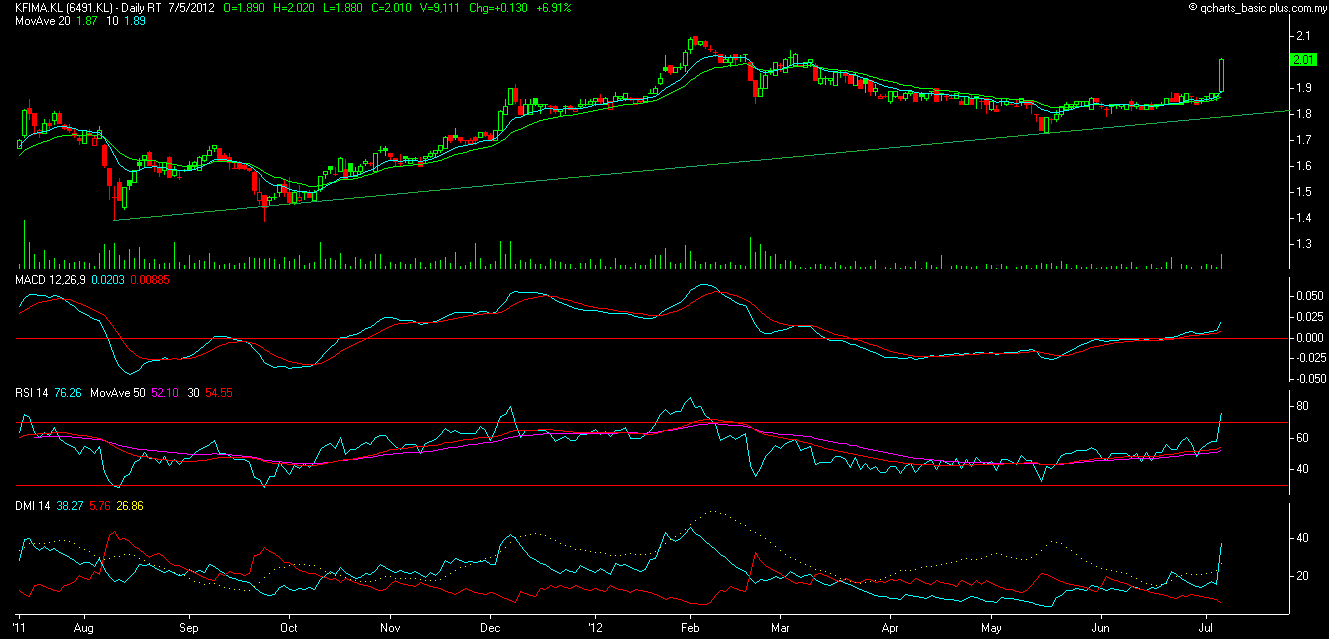
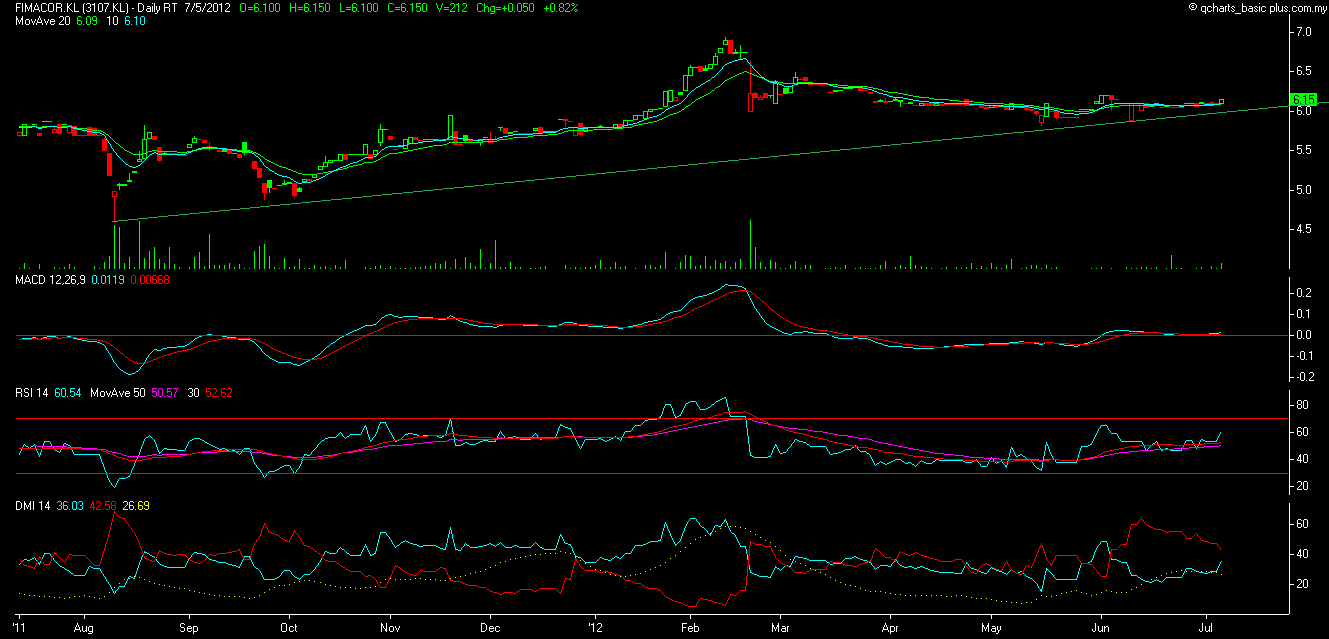
Today, KFima had a big move to the upside. It gained 13 sen to close at RM2.01. Its subsidiary, Fimacor gained only 5 sen to RM6.15. We can see from the charts below that both stocks move pretty much in tandem. I think Fimacor will do catch-up with KFima, which seems to have commenced on its next upleg.

Based on this observation, Fimacor could be a good trading BUY (or even medium-term investment). For more on these stocks, see my previous posts (here & here).


Chart 1: KFima's daily chart as at July 5, 2012 (Source: Quickcharts)


Chart 2: Fimacor's daily chart as at July 5, 2012 (Source: Quickcharts)

Gamuda & WCT- poised to test its downtrend line

We saw LMCemnt achieved a bullish breakout yesterday. This could be the beginning of a re-rating for the whole construction & the related building material sector. When we think of construction sector, we think of IJM, Gamuda & WCT. I have appended below the chart of Ga,muda & WCT. Both stocks are now pressing against their downtrend line- for Gamuda at RM3.60 & WCT at RM2.50. A break above these levels could be the start of the next upleg of these stocks.


    Chart 1: Gamuda's daily chart as at July 5, 2012 (Source: quickcharts)

 
 Chart 2: WCT's daily chart as at July 5, 2012 (Source: quickcharts)

Wednesday, July 04, 2012

Harta, LMCemnt & Zhulian may have bullish breakout

The following stocks have just broken above their recent (or, maybe not-so-recent) high. This could signal the continuation of their prior uptrend. The stocks are Harta, LMCemnt & Zhulian.

The rally in Harta - like that of MBMR - seems to point to a new theme-play involving stocks that had recently issued warrants. Without an overhang of investors holding onto more expensive securities, new warrants can rally to their hearts' content. We cannot be sure whether the stock is rising and accommodating the rally in the warrant or the rise in the warrant is dragging the share price higher. My thought is that we should not waste too much time pondering about this question and get into the next new-warrant rally quickly.


Chart 1: Harta's weekly chart as at July 4, 2012 (Source: quickcharts)


Chart 2: LMCemnt's weekly chart as at July 4, 2012 (Source: quickcharts)


Chart 3: Zhulian's weekly chart as at July 4, 2012 (Source: quickcharts)

Luxchem's uptrend may continue

Luxchem Corporation Bhd is involved in the production of unsaturated polyester resins. It reported a net profit of RM22 million on a turnover of RM499 million for FYE31/12/2011. For QE31/3/2012, it reported a net profit of RM6.4 million on a revenue of RM129 million. Annualized EPS is about 19.56 sen. At the present price of RM1.29, Luxcham is trading at a PE of 6.6 times. 


Luxchem has broken above its "horizontal" line at RM1.20 two weeks ago. This upside breakout could send the stock to RM1.40-1.50. As such, the stock could be a trading BUY.

 
 Chart: Luxchem's weekly chart as at July 4, 2012_3.00pm (Source: Quickcharts)

Tuesday, July 03, 2012

Censof- poised to test its downtrend line

Some readers complained that I liked to recommend stocks that had achieved a breakout and are no longer cheaper. You can never win in any argument why you should buy a stock after it had a breakout, even though it is more expensive instead of buying into a stock, even though it is cheap, and wait for a breakout which may never come. There is a saying that nothing succeed as as well as success and I like to stay with that.

However, I would track a stock for a long while and I would call a buy when it has achieved a breakout. Today, I would share with you one such stocks. It is Censof, a software company that sells extensively to government departments & agencies. It has plans to expand to Indonesia. It is not a hugely profitable company but it made decent profit (here). It has proposed a bonus issue of 1 free warrant for every 8 shares held, which may be the reason for a slight upticks in the share price over the past few days.

If it can break above the RM0.45, the stock would have an upside breakout above its intermediate downtrend line. Then it could be a good trading BUY. For those who have always wanted to buy early, here is your opportunity to do so- before a breakout.


Chart: Censof's daily chart as at July 3, 2012 (Source: Quickcharts)

Kianjoo- to play catch-up with Canone

Canone broke above its 'range' at RM2.40 in late June. It shot up today to a high of RM3.13. If we assumed a gain of 1-time the prior range of RM0.60, then the target for the present move could be about RM3.00. As such, Canone has overshot that target and this may imply that it is going for a possible move of 1.68-time its prior range (or a RM1.00 move) - with the next target being RM3.40.


Chart 1; Canone's daily chart as at July 3, 2012-4.00pm (Source: Quickcharts)

Canone is obviously attracting a lot of interest as it managed to buy over Kianjoo at a cheap price. Kianjoo has also broken above its horizontal line at RM2.30. If we also assume a gain of 1-time the prior 'range' of RM0.50, then the target for Kianjoo could be RM2.80 (or, RM3.15 if it can achieve a move of 1.68-time its prior range).


Chart 2; Kianjoo's weekly chart as at July 3, 2012-4.00pm (Source: Quickcharts)

Based on the above, I believe that Kianjoo is a trading BUY. It is a safer bet as compared to Canone which has risen quite substantially.

Monday, July 02, 2012

Allianz may have a bullish breakout

Allianz has just broken above its intermediate downtrend line, RR at RM5.05. The volume traded is thin and unconvincing. If the stock can recruit more buying support, then it may rally to retest its high in January 2011 at RM5.50 & then possibly to test the resistance of the previous uptrend line, S1-S1 at RM5.80.

Based on technical consideration, Allianz could be a trading BUy if it can recruit convincing volume.


Chart: Allianz's weekly chart as at June 29, 2012 (Source: Tradesignum)

Wednesday, June 27, 2012

GASMSIA revisited

On June 11, I posted on GASMSIA's fair value (here). A few days later, I was invited for a phone interview on the Market Watch program of BFM 89.9 - The Business Station. For those who like to listen to the podcast, you can go here.

Before the interview, I have re-computed my financial projection after reading the comment from the management of GASMSIA that the investment community was fussing too much about the decline in its profit margin. I have tweaked the projection slightly and extended the period to 2015. Basically, the earning is about the same for FY2012.


Assumptions
A) Volume of sale increased by 10% in FY2012 and increased subsequently at 5% per annum from FY2013 to FY2015.

B) Margin is as follows:


C) Other Cost of Sales expenses assumed to be 3% of Revenue for FY2012 and increased subsequently at 10% per annum from FY2013 to FY2015.

D) Admin expenses, which was about RM30 million for FY2009-2011, assumed to rise at 10% per annum from FY2012.

E) Effective tax rate at 24%.

F) Profit after Tax for FY2009-2011 from the projection is about RM768 million. This is very close to the actual total of RM770 million (see page 15 of Prospectus).

GASMSIA's modus operandi is a tolling operation. A tolling operation has its pros & cons. It is very stable albeit unexciting. You see that in stocks as as Litrak where growth can only come from increase in volume of cars passing thru its toll booths.However, if there are strong sales volume (& revenue) growth, then the earning could jump. You can see that in Airport and Biport. We may see a sudden rise in sale volume (& revenue) for GASMSIA but the unfortunate thing is that the margin has dropped substantially. We do not know how much will the sales volume growth going forward. Natural gas is a cheap source of energy but are Malaysian users prepared to pay the higher prices? I have assumed a growth of 10% for FY2012 & 5% thereafter. This gives an EPS of 10.9 sen to 13.5 sen for period from FY2012 to FY2015. On the other hand, if I were to assume a growth of 10% from FY2012 to FY2015, GASMSIA's EPS would rise steadily from 10.9 sen to 16.7 sen for that period. As such, GASMSIA (closed at RM2.51) is trading at a PE of 23 times its FY2012 earning.That means GASMSIA is fully valued.

However, GASMSIA is breaking above the slightly expanding "trading range" of RM2.38 & RM2.52. An upside breakout of a trading range (albeit imperfect one) could signal the beginning of a bullish move.


Chart: GASMSIA's 15-min chart as at June 27, 2012_9.30am 9Source: Quickcharts)

When financial projection gives a different picture from the technical analysis (or the price chart), you have to make a judgement call. I tend to give credence to technical analysis than financial studies. As such, I would say GASMSIA has a bullish breakout and it is now a possible trading BUY. 

Tuesday, June 26, 2012

Market Outlook as at june 26, 2012


Our FBMKLCI made a new all-time of 1611, which surpassed the previous all-time high of 1609, recorded in April 3 & 4 this year. The breaking of the previous high could set the stage for the continuation of the prior uptrend. However, we have to be cautious. The present market rally is driven by local fund managers, especially those with close tie with GLCs. Foreign funds had been selling for the past few weeks, even months. Retail players would not be a big factor in the present run-up as many have been badly mauled by the sharp consolidation among 2nd & 3rd liners in the past 3 months. The current market is very similar to what we saw in July 2011 or even January 2008. When you compared the strength of the blue chips (as represented by FBMKLCI) and the weakness among the 3rd liners (as represented by FBMFLG), we can see that the divergence between the two indices. FBMFLG has acted as a canary in a coal mine- warning us that the light at the end of the tunnel is an oncoming train. Is it the same this time around?

 
 Chart 1: FBMKLCI's weekly chart as at June 26, 2012_2.45pm (Source: Quickcharts)

 
  Chart 2: FBMFLG's weekly chart as at June 26, 2012_2.45pm (Source: Quickcharts)

FGVH- born with a silver spoon


Introduction

FGVH is the third largest listed palm oil operator globally, in term of landbank. In addition, they have access to the largest crude palm oil (CPO) producer globally through its 49%-owned associate, Felda Holdings Bhd (FHB).

Business Segments

FGVH primarily operates in 3 business segments:

• Plantations
• Downstream
• Sugar

Investment Appeals

FGVH’s appeal lies in 3 areas:

1) FGVH, through its 49%-owned associate, FHB produces 3.3 Million MT of CPO in 2011. This accounts for 6.7% of the global CPO output of 49.2 Million MT in 2011. The enormous size will yield greater cost saving as well as gaining certain advantages to the group.

2) Following from this tie-up with FHB, FGV Plantation Malaysia (a wholly-owned subsidiary of FGVH) entered into an agreement with F Palm Industries (FPI) [a subsidiary of FHB] where the latter will buy FFB from FGVH, Felda settlers, F Agricultural & third parties for processing into CPO & PK. The CPO produced would in turn be sold to FGVH. This agreement took effect on March 1, 2012 and it will effectively boost FGVH’s topline & bottomline substantially. For example, FGVH’s turnover for FYE31/12/2011 was only RM4.2 billion but its projected turnover for FY31/12/2013 may be RM11.3 billion (as per ECMLibra report).

3) In addition to the FFB/CPO arrangement, it has also entered into a very attractive land lease agreement with Felda to lease 355,864 hectares of land for a period of 99 years at an annual rate of RM700 per hectare plus 15% of the plantation operating profit. This rate is applicable for the next 20 years starting from March 1, 2012. Assuming a relatively well-managed estate producing 20 MT of FFB per hectare, the operating profit is about RM10,000 per annum at current FFB/CPO prices. This means that the amount payable per hectare is about RM2,200 (RM700 plus 15% of RM10,000 profit). This compared favorably to the annual lease payment is RM3,500 per hectare that Boustead has to pay to its REIT. FGVH enjoys a saving of RM462.54 million per annum.

4) FGVH is the leading sugar refiner in Malaysia. Sugar is a stable consumer product which should give another layer of stability to its earning.

FGVH’s negative points:

1) FGVH is essentially involved in two main businesses- upstream & mid-stream oil palm business and sugar refining & distribution business.  It has minor exposure in rubber cultivation; soyabean & canola seed crushing & processing; and production of oleochemical products. Its ambition is global but todate, they have nothing much to show for it. Then again, it is a relatively young company and its two main businesses are stable & do not face any serious threat.

2) Its oil palm estates are fairly old & need to be replanted. This will lead to a reduction in FFB output. However, FGVH produces 31.9% of the FFB that FPI has to process. As such, any decline will not be significant.

3) FVGH was born in rather acrimonious circumstances, with political parties in the ruling coalition & opposition vying to get the support of Felda settlers. These settlers, who were traditionally staunch supporters of the ruling coalition, are being courted by the opposition. It is possible that the sweetheart deals (for the land lease & the CPO/FFB arrangement) come with strings attached. FVGH could be called upon to do ‘national duties’ to appease the settlers and this could affect its earning. The chairman of FGVH is a former UMNO leader, Tan Sri Mohd Isa and his loyalty may not lie with the company.

Valuation

ECMLibra valued FVGH at RM5.65 based on a PE multiple of 16 times its FY2012 EPS of 35.3 sen. MIDF valued FGVH at RM5.30 based on the Sum-of-Parts method. This Sum-of-Parts method derived the bulk of its value from the Plantation division, which was valued at a PE of 18 times its earning for FY2013. Sime & IOI are currently trading at a PE of 14-15 times their respective earning for FY2012.

I would value FGVH at a PE of 14 times its FY2012 EPS of 35.3 sen (based on ECMLibra). As such, my fair value for FGVH is RM4.94.

Monday, June 25, 2012

Tenaga may have a bullish breakout


With the FBMKLCI making new high, we should look at blue chips that may continue to rise; thus giving support to the rising FBMKLCI. We have seen TM making new high in this cycle. This morning, it is the turn for Tenaga to charge.

Tenaga broke above its horizontal line, R2-R2 at RM6.70. It may rise to test the resistance of its uptrend channel line at RM7.20-7.30. Note that there is some resistance at the horizontal line at RM7.10.


Chart 1: Tenaga's daily chart as at June 25, 2012_11.00am (Source: Tradesignum)

Tenaga is coming into a positive news cycle, which will likely to coem from two sources:
1. The renegotiation of the old Power Purchase Agreements (PPAs) with Independent Power Producers (IPPs) which could lead to a significant reduction in its operating costs; and
2. Increased in power consumption.

Another catalyst for a re-rating of Tenaga is the correction in the prices of its fuel. We can see from Chart 2 & 3 that the price of Natural Gas & Coal (Australia) have eased off. Cheaper prices of Natural Gasmay not benefit Tenaga signififcantly for now as its purchases from Petronas Gas is subsidized currently. In 2016 onwards, the price of Natural Gas would be at market rate & any downward pressure on Natural Gas is a positive development for Tenaga.


Chart 2: Natural Gas price chart as at May 2012 (Source: mongabay.com)


Chart 3: Coal (Australia) price chart as at May 2012 (Source: mongabay.com)

If you look at the monthly chart for Tenaga, you will see that Tenaga is once again testing the 3rd fan downtrend line (R-R3) at RM6.70. The last time, it broke above a 3rd fan downtrend line (r-r3) was in 2006 when it rose to a high of about RM10.00. If Tenaga can break above the RM6.70 resistance (preferably RM7.00 as well), it may swing up & revisit the RM10.00 mark. My most optimistic forecast is that it may hit RM12.00 within a 1-year period, based strictly on technical projection.


Chart 4: Tenaga's monthly chart as at June 22, 2012 (Source: Tradesignum)

Based on the above, Tenaga could be a trading BUY or even a medium-term trade if it can break above the RM6.70 mark convincingly.