Thursday, August 16, 2012

Petgas- bottom-line improved due to gain from part disposal of GASMSIA

Results Update

For QE30/6/2012, Petgas's net profit increased by 38% q-o-q or 19% y-o-y to RM459 million while its revenue declined by 3% both q-o-q & y-o-y to RM887 million. The increase in bottom-line was due mainly to the gain oi RM144 million on part disposal of a stake in Gas Malaysia through its recent IPO. Prior to the listing of Gas Malaysia, Petgas had a 20%-stake in the company. After its listing, the stake was sold down to only 14.8%. This gain was booked into the account under Other Income. If this extraordinary gain has been excluded, Petgas's net profit was declined by 5.6% to RM315 million.


Table: Petgas's last 8 quarterly results


Chart 1: Petgas's last 24 quarterly results

Valuation

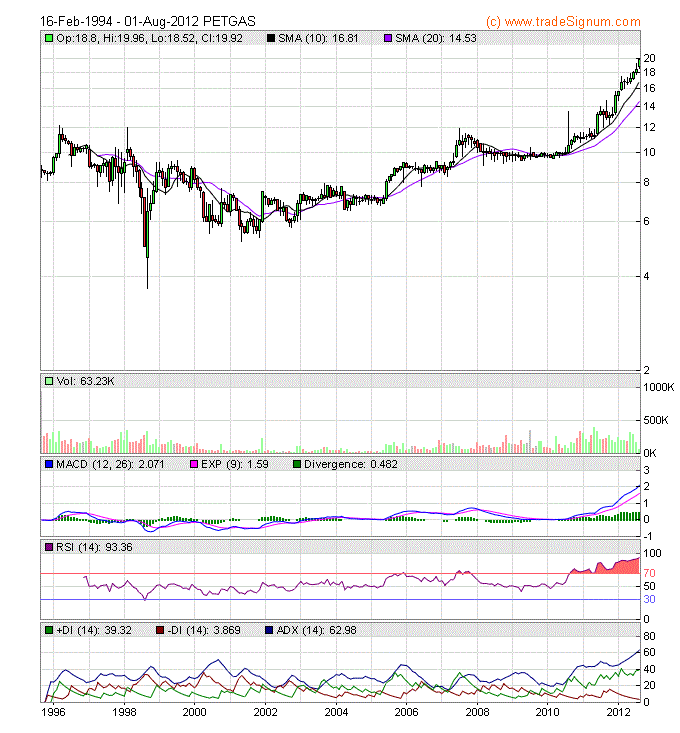
Petgas (closed at RM19.92 yesterday) is now trading at a PE of 27 sen (based on last 4 qusrters' EPS of 75.13 sen). At this PE multiple, Petgas is deemed fully valued.

Technical Outlook

Petgas is still in a steady uptrend.


Chart 2: Petgas's daily chart as at August 15, 2012 (Source: Tradesignum) 

Conclusion

Based on rich valuation, I think it is advisable to take some profit on Petgas.

Wednesday, August 15, 2012

Consumer stocks ripe for profit-taking


It was reported that Warren Buffet had recently sold down on consumer stocks after being disappointed by their performance. In a regulatory filing dated August 3, Berkshire is reporting about a 21% reduction in the amount of consumer products stocks it holds, even as it ups its exposure to banking, insurance, and industrial stocks. For more, go here.

Unlike the US consumer stocks, the performance of the top flight consumer stocks listed on Bursa Malaysia has been anything but disappointing. Just look at the 5 charts below. In term of financial performance, they also did not disappoint. So, should we just ignore the action taken by the Oracle of Omaha?

I have tabulated the value of the 5 top performing consumer stocks below. The valuation of these stocks are quite rich, with PE multiple ranging from 22 times to 30 times. One possible justification for buying or holding these stocks is that the growth rate is high. Looking at the table, you will see that the growth rate is respectable for Carlsberg & Nestle at 16-17% and the outlier is Dutch Lady. (Note: We can ignore F&N because of its current problems which I had dealt with in a separate post). Dutch Lady's substantially higher profit dates back to 1Q2011 when it had a successful relaunch of its growing up milk. Can Dutch Lady continue its high growth?


Table: Consumer stocks valuation

Investors should not only concern themselves with PE ratio but also look at PEG ratio. The difference between these two ratios are:
P/E = Price per share / Earnings per share

PEG = (P/E) / Annual earnings-per-share growth
(Note: The growth rate in the table above is arrived at by comparing the EPS for the last 4 quarters with the preceding 4 quarters' EPS).

As a rule, investors should seek out stocks with PEG ratios closer to 1 and avoid stocks with PEG ratios closer to 2. Based on this rule, the only stock that is relatively attractive is Dutch Lady while Carlsberg & Nestle (with PEG ratio at 1.8-2.0 times) & Guinness (with PEG ratio at 3 times) are deemed pricey. If Dutch Lady's current year growth were to slip to a more sustainable level (say 15%), its PEG ratio would be bumped up (to 1.6 times). While Dutch Lady would not be deemed expensive, it would no longer be deemed cheap.

Based on the above, I think it is advisable that we too should consider taking some profit on our high-flying consumer stocks- not because of their poor performance but because they are fully valued.


Chart 1: Carlsbg's monthly chart as at Aug 7, 2012 (Source: Tradesignum)


Chart 2: Dlady's monthly chart as at Aug 7, 2012 (Source: Tradesignum)


Chart 3: F&N's monthly chart as at Aug 7, 2012 (Source: Tradesignum)


Chart 4: GAB's monthly chart as at Aug 7, 2012 (Source: Tradesignum)

 
Chart 5: Nestle's monthly chart as at Aug 7, 2012 (Source: Tradesignum)

Asas- a hidden gem waiting to be discovered

Background

Asas Dunia Bhd ('Asas') is involved in construction & property development. It is a small developer, with sizable land bank in Seberang Prai- near the Second Bridge connecting Penang to the mainland. See the map below.


Map: The Map of Penang & Seberang Perai (Source: 3.bp.blogspot)

According to the latest Annual Report for FY2011 (page 93-94), Asas has a few pieces of development land in Seberang Perai that are located in the following mukim:

 
Table 1: Asas's development landbank  

All the development land are stated at cost in its book. The Group MD was quoted as saying that these lands are now worth between RM20 & RM50 p.s.f. depending on location (go here). I believe that is a fairly reasonable number. Assuming that we valued the above development land at only RM20 p.s.f., the landbank is worth about RM965 million (or giving a revaluation surplus of RM726 million). Ignoring other assets owned, the NTA of the stock is about RM5.00 (outstanding shares is 191 million).

Recent Financial Results

Asas has just released its results for QE30/6/2012. Its net profit increased by 33% q-o-q or 69% y-o-y to RM12 million while its revenue increased by 26% q-o-q or 67% y-o-y to RM46 million.

 
 Table 2: Asas's last 8 quarterly results

 
Chart 1: Asas's last 22 quarterly results

Valuation

Asas (at RM1.66 as at 12.15pm) is now trading at a PE of 10.2 times (based on last 4 quarters' EPS of 16.26 sen). For a small developer, that PE multiple is fair. The question is how the company will unlock the value of its landbank.

Technical Outlook

Asas may have broken above its strong horizontal resistance at RM1.55-1.60. Its next resistance could be at RM2.60.


Chart 2: Assas's monthly chart as at August 14, 2012 (Source: Tradesignum)

Conclusion

Based on underlining asset backing & bullish technical outlook, Asas could be a good stock for long-term investment..

Tomypak- bottom-line improved

Tomypak broke above its horizontal resistance at RM1.05. Its next resistance will be at RM1.37-1.40.

Tomypak has just announced its quarterly results for QE30/6/2012 where its net profit increased from RM2.8 million to RM5.5 million while revenue rose marginally from RM55 million to RM56 million. For 1H2012 ended 30/6/2012, its net profit increased from RM5.76 million to RM8.99 million while revenue rose marginally from RM106 million to RM108 million. The company attributed the higher bottom-line to better sales mix. Tomypak (at RM1.14) is now trading at a PE of 7 times (based on annualized EPS of 16.5 sen).

Based on technical breakout & fairly attractive valuation, Tomypak could be a good trading BUY.


Chart 1: Tomypak's weekly chart as at August 14, 2012 (Source: Quickcharts)


Chart 2: Tomypak's monthly chart as at August 14, 2012 (Source: Tradesignum)

Tuesday, August 14, 2012

Tienwah's bottom-line jumped

Results Update

For QE30/6/2012, Tienwah's net profit increased by 126% q-o-q or 14% y-o-y to RM9.1 million on the back of increased revenue, which rose 8.6% q-o-q or 7.7% y-o-y to RM106 million. The company attributed the improved bpottom-line to increase in the top-line as well as higher profit margin (due to greater operating efficiency).


Table: Tienwah's last 8 quarterly results


Chart 1: Tienwah's last 22 quarterly results

Valuation

Tienwah (at RM2.06 as at 9.30am) is trading at a PE of 7.3 times (based on last 4 quarters' EPS of 28.23 sen). At this PE, Tienwah is deemed attractive.

Technical Outlook

Tienwah is in a long-term uptrend, with 'uptrend line' support at RM1.75. Its upside is capped by the line connecting its previous peaks for the past 12 years at RM2.15. An upside breakout above this level would be very bullish for the stock.


Chart 2: Tienwah's monthly chart as at August 10, 2012 (Source: Tradesignum)

Conclusion

Based on good financial performance and attractive valuation, Tienwah is a good stock for long-term investment. Its next upleg would only begin once it has broken above the resistance of RM2.15.

Monday, August 13, 2012

Takaful- the hare awakened from its snooze?

Background

Syarikat Takaful Bhd ('Takaful')'s principal activities consist of managing family and general takaful businesses, whilst the principal activities of the subsidiaries are family and general retakaful business and investment holding. To carry on its insurance business in accordance to the Islamic principles, Takaful has adopted the Wakalah contract as its business model.

The Wakalah Business Model

Briefly, Takaful insurance illustrates the act of a group of people reciprocally guaranteeing each other for mutual financial aids and assistance to the participants, whilst Wakalah is an authorisation contract whereby a person appoints and authorizes someone to execute certain tasks on his or her behalf. The Wakalah model allows Takaful to act as the agent (or Wakil) to manage Takaful funds on the behalf of the participants. For more, go here.

Results Update

For QE30/6/2012, Takaful's net profit dropped by 27% q-o-q but rose 37% y-o-y to RM22.6 million. Its revenue rose by 4% q-o-q or 36% y-o-y to RM446 million. The higher revenue on q-o-q basis was due to higher sales from Family Takaful business. This did not however translate to higher profit due to lower surplus transfer & higher realized gain on disposal of investment in preceding quarter (QE31/3/2012).


Table: Takaful's last 8 quarters' results

The chart below shows clearly the growth potential of Takaful as more Muslims begin to take up insurance products that comply with the Islamic principles.


Chart 1: Takaful's last 25 quarters' results

Valuation

Takaful (closed at RM6.42 last Friday) is now trading at a PE of 11 times (based on the last 4 quarters' EPS of 57.47 sen). At this PE multiple, Takaful is deemed attractive. This is especially so given its high CAGR of at least 20%.

Technical Outlook

Takaful has risen substantially over the past six months.Takaful broke above its long-term downtrend line at RM1.70 in July 2011. After a pullback to the breakout level in October 2011, Takaful rallied in early 2012.


Chart 2: Takaful's monthly chart as at August 10, 2012 (Source: Tradesignum)

After the strong rally of the past 6 months, Takaful could be due for consolidation. It may pull back to its intermediate uptrend line support at RM6.00. If this support can hold, the rally may continue. If the uptrend line is violated, the stock would require a longer consolidation phase.


Chart 3: Takaful's daily chart as at August 10, 2012 (Source: Quickcharts)

Conclusion

Based on the good financial performance, strong growth and farily attractive valuation, Takaful could be a stock for long-term investment. However, it has risen quite substantially over the past 6 months and could be due for consolidation. It would be advisable to wait for the consolidation to buy into this stock.

Success broke above its downtrend line


Technical Breakout

Success broke above its long-term downtrend line at RM0.97 as well as its ascending triangle at the same level. With this breakout, Success has a high probability of starting its upleg. While the breakout is on thin volume, I feel that this a genuine breakout. Its immediate resistance is at the horizontal line at RM1.10.


Chart 1: Success's weekly chart as at August 10, 2012 (Source: Quickcharts)

Recent Financial Results

Success should be issuing its results for QE30/6/2012 soon. At this moment, the latest results is for QE31/3/2012. Its net profit declined by 4.7% q-o-q but rose 7% y-o-y to RM5.6 million. Revenue was similarly lower by 16% q-o-q but rose 22% y-o-y to RM64 million. From Chart 2, we can see that despite a steady rise in turnover, the company's bottom-line was flattish due to declining profit margin.


Table: Success's last 8 quarters' results


Chart 2: Success's last 20 quarters' results

Valuation

Success (at RM1.05) is now trading at a PE of 4.8 times (based on last 4 quarters' EPS of 21.96 sen). Success, being a smallcap, could command a PE of 6 times.

Conclusion

Based on bullish technical outlook, reasonable valuation & satisfactory financial performance, Success could be a good stock for long-term investment.

Friday, August 10, 2012

Century continued to slide

Results Update

For QE30/6/2012, Century's net profit dropped 20% q-o-q or 60% y-o-y to RM3.4 million while its turnover inched up 1.5% q-o-q but dropped 11% y-o-y to RM66 million. Century's results continued to be affected by reduced activities in the total logistics services segment & losses in the double hull product tanker.


Table: Century's last 8 quarters' results

From the chart below, Century's top-line may have peaked and its bottom-line may continue its downward slide.


Chart 1: Century's last 25 quarters' results

Valuation

Century (closed at RM1.76 today) is now trading at a PE of 9.5 times (based on annualized EPS of 18.46 sen). At this PE, Century is deemed fairly valued.

Technical Outlook

Despite the poor financial performance, Century's share price is still holding up very well. Last week, it even traded very near to RM1.90- the high of 2010 & 2007. Century may test its more gradual uptrend line (S-S2) at RM1.70 soon. There are a few more support levels just below the uptrend line support, such as the horizontal lines at RM1.60 & RM1.50.


Chart 2: Century's weekly chart as at August 10, 2012 (Source: Quickcharts)

Conclusion

Based on poor financial performance, elevated valuation & lthe presence of strong resistance at RM1.90 mark, I would rate Century as a REDUCE or AVOID.

E&O- Sime Darby to make GO for E&O at RM2.30?


The Securities Commission (SC) will now order Sime Darby Bhd to make a general offer for Eastern & Oriental Bhd (E&O) shares after buying a 30-per cent stake last year, say government sources. For more, go here.

If it is true, shouldn't SC order E&O to suspend trading on the stock immediately?

 
 Chart 1: E&O's 30-min chart as at August 10, 2012_4.45pm (Source: Quickcharts)

 
 Chart 2: E&O's weekly chart as at August 10, 2012_4.45pm (Source: Quickcharts)


JOBST- improved bottom-line due to investment return!

Results Update

For QE30/6/2012, JOBST's net profit increased by 66% q-o-q or 29% y-o-y to RM17 million while revenue increased by 19% q-o-q or 24% y-o-y to RM45 million. The company attributed its improved performance to higher revenue came from higher sales from Jobstreet Essential & dividends from HK investments. This- and higher profit from associates & a JV entity- contributed to higher profit.

Fr the current quarter, we saw:
1. The Philippines operation showed the more improvement y-o-y with a 50%-increase in revenue to RM14.4 million & operating results  also increased by 50% to RM6.50 million.
2. Revenue in the Malaysia & Singapore operation improved slightly. The Malaysia operation received a dividend income  of RM4.14 million while the Singapore operation, enjoyed a gain on sale of financial assets of RM1.46 million and a dividend income of RM1.72 million from a related company.
The high amount of financial gain or external dividend totaling RM5.6 million is a mixed blessing. This came from its holding of short-term investment of RM37 million as well as available-for-sale investment of RM33 million. In addition, it must be noted that it has cash in hand of RM77 million. The group bank borrowings is negligible at RM300k. This means that JOBST has a cash backing of 46 sen per share!


Table: JOBST's last 8 quarterly results


Chart 1: JOBST's last 25 quarterly results

Valuation

JOBST (at RM2.26 now) is trading at a PE of 15.5 times (based on the last 4 quarters' EPS of 14.57 sen). If the cash backing is deducted from the share price, then JOBST's PE would be 12.3 times. As such, JOIBST is deemed attractive.

Technical Outlook

JOBST has broken below its long-term uptrend line in late 2011. In April this year, it attempted to climb back above that uptrend line but it ws unsuccessful. The stock's immediate support is at RM2.05 while its immediate resistance is at RM2.40.


Chart 2: JOBST's weekly chart as at August 9, 2012 (Source: Tradesignum)

Conclusion

Based on good financial performance & attractive valuation, JOBST is a good stock for long-term investment. However, the technical outlook is not exciting as the stock is likely to trade sideway for now (between RM2.05 & RM2.40).

MBMR- net profit dropped on q-o-q basis

Results Update

For QE30/6/2012, MBMR's net profit dropped 28% q-o-q but rose 40% y-o-y to 29.5 million while revenue increased by 13% q-o-q or 61% y-o-y to RM614 million. The decline in the net profit on the q-o-q basis was due to a drop in contribution from the Automotive Component segment from RM23 million to RM13 million (with revenue from that segment dropped off slightly from RM101 million to RM96 million). The lower profit contribution could not be sufficiently made up by the  higher contribution from the Motor Vehicles segment of RM9 million (as compared to RM6 million previously) which is in turn due to higher revenue of RM516 million (as compared to RM441 million previously).


Table: MBMR's last 8 quarterly results

Despite the sharp rise in revenue in the past 3 quarters (due to the completion of the acquisition of Hirotako in 4Q2011), the group's bottom-line remained fairly stagnant. The reason is the continued slide in its profit margin since 1Q2010.


Chart 1: MBMR's last 25 quarterly results

Valuation

MBMR (closed at RM3.92 yesterday) is now trading at a PE of 8.3 times (based on last 4 quarters' gross EPS of 47 sen). MBMR could trade up to a PE of 10 times, if the market sentiment permits.

Technical Outlook

MBMR has surpassed its all-time high of RM3.20 recorded in 1997. A break above the all-time high is a bullish sign, which means that the stock could have further upside.


Chart 2: MBMR's monthly chart as at August 9, 2012 (Source: Tradesignum)

Conclusion

Despite the recent drop in the bottom-line, MBMR is still a good stock for long-term investment based on valuation & positive technical outlook.

Thursday, August 09, 2012

Perstim broke a strong horizontal support

Results Update

On July 19, Perstim announced its results for QE30/6/2012. Its net profit dropped 61% q-o-q or 88% y-o-y to RM1.8 million while revenue increased 3% q-o-q but declined 14% y-o-y to RM185 million. The company attributed the lower pre-tax profit to  lower profit margin which in turn was due to the reduction in selling price to remain competitive especially for Malaysian market.


Table: Perstim's last 8 quarterly results


Chart 1: Perstim's last 30 quarterly results

Valuation

Perstim (closed at RM3.06 yesterday) is now trading at a PE of 14 times (based on last 4 quarters' EPS of 22.42 sen). At this PE, Perstim  is deemed overvalued.

Technical Outlook

Perstim broke its strong horizontal support at RM3.10-3.12. Unless a quick rebound kicks in, Perstim could continue to slide until the next horizontal support at RM2.50.


Chart 2: Perstim's daily chart as at Aug 8, 2012 (Source: Quickcharts)


Chart 3: Perstim's monthly chart as at Aug 8, 2012 (Source: Tradesignum)

(Note: The price data for Quickchart & Tradesignum are not the same. Quickchart adjusts its price s for dividend while Tradesignum does not. The impact is noticeable for a stock that pays high dividend like Perstim. I do not believe this difference would invalidate our study but it may cause some problem in pinpointing the exact support or resistance. To be sure, you may want to see a breakout that appears on both charts).

Conclusion

Based on poor financial performance, demanding valuation and slightly bearish technical outlook, I would rate Perstim a SELL or AVOID.

KKB hanging on the strong support of RM1.45

Results Update

For QE30/6/2012, KKB's net profit dropped by 52% q-o-q or 68% y-o-y to RM3.7 million while revenue declined by 36% q-o-q or 25% y-o-y to RM34 million. Top-line & Bottom-line declined due to the drop in revenue for the Engineering & Manufacturing segments.


Table: KKBt's last 8 quarterly results


Chart 1: KKB's last 20 quarterly results

Valuation

KKB (closed at RM1.45) is now trading at a PE of 14.5 times (based on last 4 quarters' EPS of 10.33 sen). At this PE, KKB is deemed overvalued.

Technical Outlook

KKB is now resting on its strong horizontal support of RM1.45. If this support is violated, the stock's next support would be the psychological RM1.00 mark but the strong support is the horizontal line at RM0.80.


Chart 2: KKB's daily chart as at Aug 8, 2012 (Source: Quickcharts)


Chart 3: KKB's monthly chart as at Aug 8, 2012 (Source: Tradesignum)

Conclusion

Based on poor financial performance & unattractive valuation, KKB is rated a SELL or AVOID. If it can hold at the critical support of RM1.45, it may turnaround if the financial performance recovers. However, a break below that critical support would be a bearish signal for the stock.


Tuesday, August 07, 2012

IHH broke to new high of huge volume!

The volume leader for today is IHH. This stock broke above its recent high of RM2.40 today. With the huge volume traded and the new high, the stock could see further upside in the days ahead.

Based on this, IHH could be a trading BUY. While IHH is undoubtedly a solid company, its short history would warrant any trade a risky trade. As such, do exercise careful discretion.


Chart: IHH's 15-min chart as at August 7, 2012_4.45pm (Source: Quickcharts)

Outlook for Major Equity Markets


Despite the gloomy prognosis for the global economy, most main indices have recovered quite substantially over the past two months. I have summarized the improvement in the major indices in the table below.

 
Table: Major Indices of Developed Economies as at August 6, 2012

Comments

1. The strongest recovery is seen in Singapore Straits Time Index, where 50, 100 & 200-day SMA lines have rising or hooked upward.
2. The next strongest indices are the US's DJIA & Nasdaq where the 100-day SMA line did not decline but merely dipped slightly. With the 50-day SMA line hooking up now, the 100-day SMA line should also hook up soon.
3. The weakest indices are CAC & HSI where the 200-day SMA line has just hooked up & the 100-day SMA lines are still declining.

Conclusion

Based on the above, the major equity markets in the developed economies are all showing signs of recovery. However, we should note that the intermediate downtrend line resistance for many indices (or, recent high in the case of DJIA) is not far away and this could cap the upward momentum for the next few weeks. If these indices can charge above their downtrend line, we should see further upside in the equity market. This upside breakout, if it happens, would probably coincide with the next round of quantitative easing by the US Fed.


Chart 1: DJIA's daily chart as at Aug 6, 2012 (Source: Stockcharts)

 
Chart 2: Nasdaq's daily chart as at Aug 6, 2012 (Source: Stockcharts)

 
 Chart 3: CAC's daily chart as at Aug 6, 2012 (Source: Stockcharts)
  

Chart 4: DAX's daily chart as at Aug 6, 2012 (Source: Stockcharts)


Chart 5: FTSE's daily chart as at Aug 6, 2012 (Source: Stockcharts)


Chart 5: HSI's daily chart as at Aug 6, 2012 (Source: Stockcharts)


Chart 6: STI's daily chart as at Aug 6, 2012 (Source: Stockcharts)