Thursday, November 21, 2013

Benalec- share price takes a knock due to in-fighting amongst shareholders?

Benalec's share price has been sliding for the past 5 months, from a high of RM1.59 in July to a low of RM1.00 today. The selldown could be triggered by a feud amongst its major shareholders, the Leaw brothers. According to a report in The Ant Daily, "the unexpected removal of the executive power of two executive directors of land reclamation specialist Benalec Holdings Bhd has led to uncertainties in the group's operations, arising from a possible family feud." For more, go here. As recently as end October, Affin has called a trading BUY on this stock, with a target price of RM1.98 (here).


Chart: Benalec's weekly chart as at Nov 21, 2012_11.00am (Source: quickcharts)

From the chart, we can see that the stock seems to be in a gradual downward channel. The immediate support would be the psychological level at RM1.00 and thereafter the lower boundary of the channel at RM0.94-0.95. At the RM0.95 mark, I think the stock could be a trading BUY for a possible technical rebound.

Note:
In addition to the disclaimer in the preamble to my blog, I hereby confirm that I do not have any relevant interest in, or any interest in the acquisition or disposal of,Benalec.

Tuesday, November 19, 2013

SKPetro- may have a bullish breakout

CIMB issued a bullish report on SKPetro, valuing the stock at RM6.65 (here). It opined that the real excitements for SKPetro are its recent acquisition of Newfield's Malaysian assets for RM2.85 billion and the purchase of Seadrill's tender rigs for RM11.9 billion.

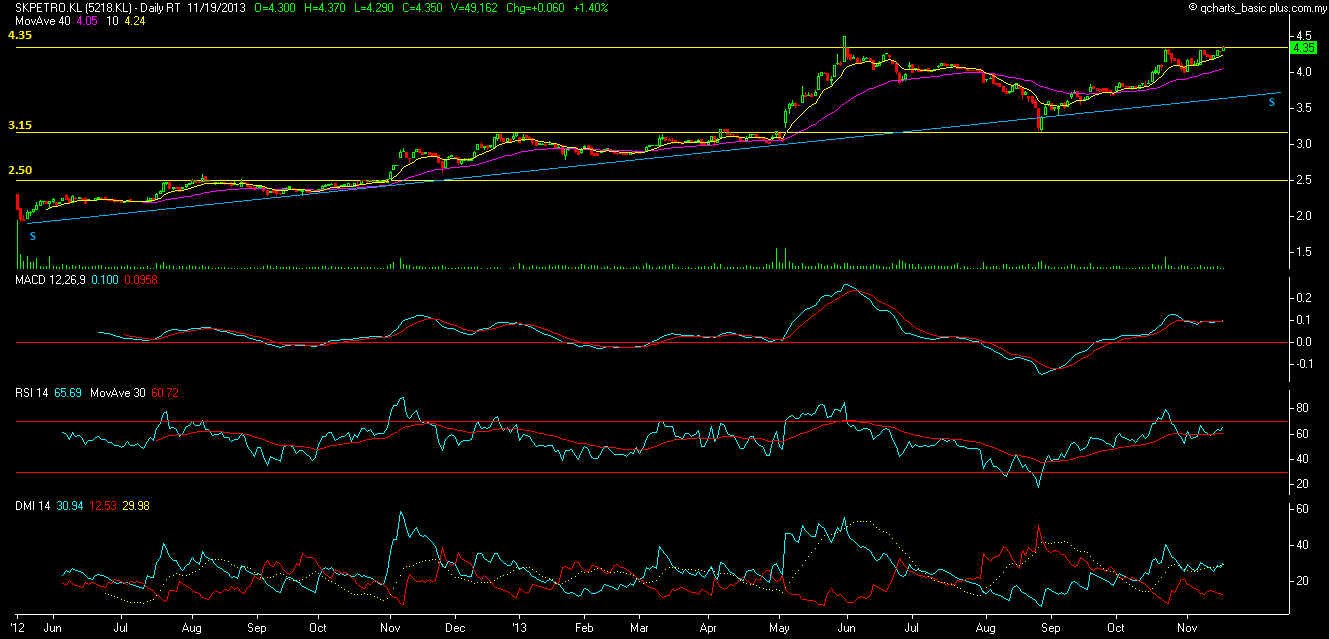
The stock may have just broken above its horizontal line at RM4.35 and it may soon revisit its May 30 high of RM4.50. If it can surpass the recent high, it could be on the way to fulfill the target price set by CIMB.

Based on the bullish breakout above the horizontal line at RM4.35, SKPetro could be a trading BUY. 

 
Chart: SKPetro's daily chart as at Nov 19, 2013_3.00pm (Source: Quickcharts)

Note:
In addition to the disclaimer in the preamble to my blog, I hereby confirm that I do not have any relevant interest in, or any interest in the acquisition or disposal of, SKPetro.

KLK, IOICorp & PPB- moved, moving & about to move...


KLK broke above its intermediate downtrend line at RM22 in mid-September. It may soon revisit its January 2012 of RM25.00.


Chart 1: KLK's weekly hahrt as at Nov 19, 2013_11.00am (Source: Quickcharts)

IOICorp broke above its horizontal line at RM5.60. Its next resistance levels are the horizontal line at RM6.00, RM6.50& RM7.20. Since horizontal line RM5.60 is a very strong resistance, this breakout may surprise on the upside- possibly revisit the 2008 high of RM7.25.


Chart 2: IOICorp's weekly hahrt as at Nov 19, 2013_11.00am (Source: Quickcharts)

PPB has yet to break above its intermediate downtrend line at RM15.00. An upside breakout of that downtrend line could be the start of a sustained rally to retest November 2010 high of RM18.70.


Chart 3: PPB's weekly hahrt as at Nov 19, 2013_11.00am (Source: Quickcharts)

Based on the above, I believe KLK could be due for some profit-taking; IOICorp could be a trading BUY (especially on pullback towards RM5.60); and PPB is worth close-tracking for breakout play.

Note:
In addition to the disclaimer in the preamble to my blog, I hereby confirm that I do not have any relevant interest in, or any interest in the acquisition or disposal of, KLK, IOICorp & PPB.

Tuneins- Riding on Airasia's Growth


Background


Tune Ins Holdings Bhd ('Tuneins') is involved in the provision of various general and life insurance products in the Asia Pacific. The company offers a range of online insurance products, including travel, lifestyle protection, and guest personal accident insurance products. For more details, go here. 

Recent Financial Results

For QE30/9/2013, Tuneins's net profit increased by 3% q-o-q or 80% y-o-y to RM16.8 million while revenue increased by 2% q-o-q or 44% y-o-y to RM99 million. Net profit & revenue for the past 4 quarters are higher than the preceding 4 quarters numbers by118% and 145% , respectively.

Table: Tuneins's last 8 quarterly results


Chart 1: Tuneins's last 8 quarterly results
 
Valuation


Based on closing price of RM1.90 yesterday), Tuneins is now trading at a PE of 19.4 times (based on last 4 quarters' EPS of 9.75 sen). If we just assume a 3-year CAGR for net profit of 25% - a probable scenario given the rapid expansion in the Airasia group-, then the stock is deemed fairly priced at a PE of 25 times or a fair price of RM2.44. (Note: Based on current PE of 19.4 times & assuming a 3-year CAGR of 25% for its earning, the stock's present PEG ratio would be about 0.8 time). 

Technical Outlook

Tuneins has been consolidating in a "descending triangle" for the past 5 months. A breakout to the downside (below RM1.80) would be negative. An upside breakout above RM2.00 would be positive as it would signal the continuation of its prior uptrend.


Chart 2: Tuneins's daily chart as at Nov 18, 2013 (Source: Tragesignum) 

Conclusion

Based on the good financial performance & reasonable valuation (as per PEG ratio of 0.8 times), Tuneins is a good stock for medium to long-term investment.

Note:
In addition to the disclaimer in the preamble to my blog, I hereby confirm that I do not have any relevant interest in, or any interest in the acquisition or disposal of, Tuneins.

Genting- issuing a warrant!

Genting is now trading cum two related entitlements:
1. Special dividend of 50% less tax of 25%; and
2. Right Issue of warrant of 1-for-4 at RM1.50 each.

Effectively, a shareholder who has 1000 shares would get a net dividend of RM375 and that is equivalent to the amount payable of RM375 to subscribe for 250 warrants at RM1.50. The warrant's exercise price was set at RM7.96 and its tenor is 5 years. For more, go here.

The issuance of a warrant by an expensive blue chip stock is a fairly rare thing. As such, I believe there will be a strong demand for this warrant. As the exercise price is less than the current market price (of RM10.70 at the close of the morning session), the warrant is in-the-money. The intrinsic value is RM2.74 (arrived at by deducting RM7.96 from RM10.70) and assuming a small premium of 10% (or RM1.07), the warrant would be worth about RM3.81 (arrived at by adding the intrinsic value of RM2.74 to the premium of RM1.07).

Genting is pressing against its intermediate downtrend line, R1-R1 at RM10.60-10.70. If it can break above the downtrend line, its next upleg may begin. If Genting were to enter into a new upleg, the warrant would be preferred over the share.


Chart: Genting's monthly chart as at Nov 19, 2013_12.30pm (Source: Quickcharts)

Note: 
In addition to the disclaimer in the preamble to my blog, I hereby confirm that I do not have any relevant interest in, or any interest in the acquisition or disposal of, Genting.

Monday, November 18, 2013

Plantation stocks starting to take flight?!


Two weeks ago, I posted on the start of CPO uptrend. Now we can see that the Plantation index is poised to break above its intermediate downtrend line. See Chart 1.


Chart 1: Plantation index's weekly chart as at Nov 16, 2013_3.30pm (Source: Quickcharts)

Below are a few plantation stocks that are moving higher - drawing strength from the uptrend in CPO. They are:

1) SOP


Chart 2: SOP's weekly chart as at Nov 16, 2013_3.30pm (Source: Quickcharts)

2) IJMPLNT


Chart 3: IJMPLNT's weekly chart as at Nov 16, 2013_3.30pm (Source: Quickcharts)

3) GENP


Chart 4: GENP's weekly chart as at Nov 16, 2013_3.30pm (Source: Quickcharts) 
Note: GENP had started moving earlier on reports that its land bank is well-located and could be converted to property development.

Note: 
In addition to the disclaimer in the preamble to my blog, I hereby confirm that I do not have any relevant interest in, or any interest in the acquisition or disposal of, SOP, IJMPLNT & GENP.

Friday, November 15, 2013

MPI- net profit continued to rise sequentially


Result Update

For QE30/9/2013, MPI's net profit jumped 67% q-o-q or more than 100-fold y-o-y to RM17.8 million. Net profit rose q-o-q due to the strengthening of the USD and lower direct material cost. In addition, the result for QE30/6/2013 was affected by start-up cost for Suzhou operation. However, it must be noted that revenue did not improve much; only inched up by 1% q-o-q or 4% y-o-y to RM331 million.


Table: MPI's last 8 quarterly results


Chart 1: MPI's last 27 quarterly results

Valuation

MPI (at RM3.15 as at 3.55pm) is now trading at a PE of 21 times (based on last 4 quarters' EPS of 15 sen). While the PE multiple is high, this multiple should ease off as the earning continue to improve.

Technical Outlook

From Chart 2, we can see that MPI has broken through its long-term downtrend line. The indicators are slowly turning upward.


Chart 3: MPI's monthly chart as at Nov 15, 2013_4.00pm (Source: Quickcharts)

From Chart 3, we can see that MPI has broken above the strong horizontal line at RM2.90 today. Its next resistance is at the horizontal line RM3.60.


Chart 3: MPI's weekly chart as at Nov 15, 2013_4.00pm (Source: Quickcharts)

Conclusion

Based on the improved profitability and mildly positive technical, MPI could be a good stock for a recovery play.

Note:
In addition to the disclaimer in the preamble to my blog, I hereby confirm that I do not have any relevant interest in, or any interest in the acquisition or disposal of, MPI.

Thursday, November 14, 2013

PIE- powered higher by electronic manufacturing activities


Result Update

For QE30/9/2013, PIE's net profit dropped 10% q-o-q or 62% y-o-y to RM10.5 million while revenue was rose 7% q-o-q or 37% y-o-y to RM116 million. Revenue increased q-o-q due to higher revenue from manufacturing activities especially from electronic manufacturing activities. Net profit improved q-o-q due to the higher revenue achieved and higher gain from foreign currency exchange transactions. However, the profit was partly limited by higher operating expenses, higher provision of doubtful debts and lower proceeds from scrap sales.


Table: PIE's last 8 quarterly results


Chart 1: PIE's last 22 quarterly results

Valuation

PIE (closed at RM5.96 at lunch time) is now trading at a PE of 10.5 times (based on last 4 quarters' EPS of 57 sen). At this  multiple, PIE is deemed fairly valued.

Technical Outlook

PIE continued with its uptrend after it broke above its horizontal line at RM4.35. If we assume that the current rally can travel the same distance as its retracement in October 2008 of RM2.20, then the target for the rally is RM6.55.


Chart 2: PIE's weekly chart as at Nov 14, 2013_12.30pm (Source: Quickcharts)

Conclusion

Due to improved financial performance & positive technical outlook, PIE is now rated as a HOLD. If the share price advanced further or approaches the potential target price of RM6.55, we should sell into strength.

Note:
In addition to the disclaimer in the preamble to my blog, I hereby confirm that I do not have any relevant interest in, or any interest in the acquisition or disposal of, PIE.


Wednesday, November 13, 2013

Market Outlook as at November 13, 2013

With a week of strong economic data, pundits and analysts alike are now worried that Fed will begin its tapering exercise (or the rolling back of its QE operation) in December (go here). Already, we have seen sharp correction in EM currencies & sovereign debts. This has or will spread to EM equity soon as had happened in August (go here).

For FBMKLCI, we can see the index has broken below the psychological 1800 level. The next support would be the 100-day EMA line at 1773; the psychological 1750 level; and, then the intermediate uptrend line (S-S2) at 1735.


Chart: FBMKLCI's daily chart as at Nov 13, 2013_4.00pm (Source: Quickcharts)

Thursday, November 07, 2013

Daiboci- top-line & bottom-line rose due to increased export

Result Update

For QE30/9/2013, Daiboci's net profit rose 23% q-o-q or 7% y-o-y to RM7.4 million while revenue rose 26% q-o-q or 33% y-o-y to RM87 million. The q-o-q increase in revenue was attributed to increased export revenue in the packaging segment from 37% to 44% in the current quarter. Despite higher raw material costs in the current quarter, Daiboci's pre-tax profit increased q-o-q to RM10.08 million.


Table: Daiboci's last 8 quarterly results


Chart 1: Daiboci's last 24 quarterly results

Financial Position

As at 30/9/2013, Daiboci's financial position is deemed satisfactory with current ratio at 1.7 times and gearing at 0.3 time only. However, it should noted that trade & other receivables increased from RM61 million as at 31/12/2012 to RM79 million as at 30/9/2013 (or RM66 million as at 30/6/2013). This means the receivable collection period increased from 84 days as at 30/6/2013 to 94 days in 30/9/2013. It may be due to more favorable credit term granted but this is an item that we should watch out for next quarter.

Valuation

Daiboci (closed at RM3.65 yesterday) is now trading at a PE of 15.5 times (based on last 4 quarters' EPS of 23.58 sen). At this PE, Daiboci is deemed fairly valued, with limited upside. However, this stock pays good quarterly dividend, making it an income stock. Its dividend yield is 4.0%.

(Note: As at 11.00am, Daiboci is trading at RM3.77)

Technical Outlook

Daiboci is in an uptrend with resistance at RM3.75. An upside breakout above this resistance would lead to a continuation of its prior uptrend.


Chart 3: Daiboci's weekly chart as at Nov 6, 2013 (Source: quickcharts)

Conclusion

Based on good financial performance & positive technical outlook, Daiboci remains a good stock for long-term investment. However, it is trading at its fair value where its medium-term upside potential may be limited.

Note: 
In addition to the disclaimer in the preamble to my blog, I hereby confirm that I do not have any relevant interest in, or any interest in the acquisition or disposal of, Daiboci.

Wednesday, November 06, 2013

Hevea- may have a bullish breakout


Hevea is  involved in the manufacture, sales and distribution of particleboard and other related products. Its financial performance has improved in the past few quarters after the bouncy ride in 2012 & 2011. Assuming a full-year earning of 16 sen, Hevea (at RM0.85 now) is now trading at a PE of 5.3 times. At that PE, I would rate the stock as nearly full-valued.


Table: Hevea's last 8 quarterly results


Chart 1: Hevea's last 23 quarterly results

Today, the stock broke above its horizontal line RM0.85. The indicators have just started to turn up. If the stock can stay above the horizontal line RM0.85, it may recruit more buying interest and makes a dash to the next resistance at the horizontal line RM1.10.


Chart 2: Hevea's weekly chart as at Nov 6, 2013_10.30am (Source: Quickcharts)

Based on the technical breakout, Hevea could be a trading BUY.

Note:
In addition to the disclaimer in the preamble to my blog, I hereby confirm that I do not have any relevant interest in, or any interest in the acquisition or disposal of, Hevea.

Saturday, November 02, 2013

Happy Deepavali

I like to wish all my readers a Happy Deepavali.


Source: Wikipedia

Friday, November 01, 2013

CPO broke above RM2500

As noted in an earlier post, CPO has broken above its downtrend line. Today, it broke above the RM2500 horizontal line. This also created a higher 'high' which together with an earlier higher 'low' satisfied the requirement for the start of an intermediate uptrend. CPO's next resistance is at RM2700.


Chart: CPO's weekly chart as at Nov 1, 2013_3.30pm (Source: ifs.marketcenter)

Wednesday, October 30, 2013

Coastal- making new high everyday!


Coastal broke above the horizontal line at RM2.60 in mid-July and made a high of RM3.12. Thereafter, it consolidated for 3 months and on October 22, it broke above the July high. With the latest breakout, Coastal is continuing on its uptrend. Based on projection, the current rally could hit a high of RM3.60 if we assumed that the distance of this rally is equivalent to the distance between the recent low (of RM1.60) and the breakout level (of RM2.60). That was what happened in March 2011.


Technically speaking, Coastal's current rally into all-time high territory is a very bullish sign. However, I am a bit puzzled as to why its warrant seems to be non-participative or lagging behind the price movement of the share. The warrant will either rally to catch with the share or the share will have to pullback. One possible explanation is that there is an offer to buy up the company where the offeror has fixed the prices for the share and the warrant. Since the warrant is now trading at a premium of 11%, the offered price for the warrant may be close to the current market price. As such, those in the know choose to buy the share instead of the warrant.

Notwithstanding the buyout scenario, I believe that the warrant is the better way to play the rally in Coastal. This is especially true if the warrant can surpass its horizontal line at RM0.62.


Chart 1: Coastal's weekly chart as at Oct 30, 2013_12.00pm (Source: Quickcharts)


Chart 2: Coastal-WA's weekly chart as at Oct 30, 2013_12.00pm (Source: Quickcharts)

Note:
In addition to the disclaimer in the preamble to my blog, I hereby confirm that I do not have any relevant interest in, or any interest in the acquisition or disposal of, Coastal.

Daya- Uptrend to continue

Daya broke above its recent high of RM0.365 today. With this breakout, the stock is expected to continue with its uptrend. Its possible target is RM0.45 which is arrived at by adding the recent retracement (RM0.365-0.28) to the breakout level (of RM0.365).

Based on technical consideration only, I believe Daya could be a good trading BUY.


Chart: Daya's weekly chart as at Oct 30, 2013_10.30am (Source: Quickcharts)

Note:
In addition to the disclaimer in the preamble to my blog, I hereby confirm that I do not have any relevant interest in, or any interest in the acquisition or disposal of, Daya.

PWRoot- bottom-line held up despite a sharp drop in top-line


Results Update

For QE31/8/2013, PWRoot's net profit dropped 3% q-o-q to RM9.6 million on the back of a 19%-decline in revenue to RM71 million. Compared to the same quarter last year, net profit was 5% higher while revenue was 13% higher. The revenue dropped q-o-q due to lower export. This led to a q-o-q drop in bottom-line.


Table: PWRoot's last 8 quarterly results

The q-o-q drop in revenue is very significant as the quarterly revenue in QE31/8/2013 was lower than that of QE31/5/2013 as well as QE28/2/2013. This could be a warning that its export drive may have hit a wall and future growth may be hard to come by.


Chart 1: PWRoot's last 26 quarterly results

Valuation

PWRoot (closed at RM1.90 yesterday) is now trading at a PE of 15 times (based on last 4 quarters' EPS of  12.30 sen). Based on the drop in revenue in the last quarter (QE31/8/2013), we must weigh the risk that PWRoot's growth in top-line and bottom-line may have come to a pause or may have even ended. As such, previous comparison of PE to growth (for computing PEG ratio) may not be appropriate now. Thus, I believe PWRoot is now fairly valued, with upside potential dependent on questionable prospect of further growth.

Technical outlook

PWRoot is in an uptrend after breaking above its horizontal line at RM0.63. Its immediate support is at the 20-week SMA line at RM1.89-1.90 & at the 40-week SMA line at RM1.74-1.75.


Chart 2: PWRoot's weekly chart as at Oct 29, 2013 (Source: quickcharts)

Conclusion

Based on good financial performance (albeit a sharp drop in top-line) & positive technical outlook, PWRoot remains a good stock for long-term investment. Due to concern about future growth prospect, I believe the stock is now fairly valued. Thus, the rating for the stock is now revised to a HOLD.

Note: 
In addition to the disclaimer in the preamble to my blog, I hereby confirm that I do not have any relevant interest in, or any interest in the acquisition or disposal of, PWRoot.

Tuesday, October 29, 2013

NCB- losing out to Westports


Result Update

For QE30/9/2013, NCB returned to profitability with a quarterly net profit of RM27.3 million. This compared favorably to a net loss of RM5.7 million in QE30/6/2013 but it is still much lower than a net profit of RM45.2 million in the same quarter last year. The q-o-q improvement was attributed to lower operating expenditure while the y-o-y decline was due to losses incurred by its logistics operations, Kontena Nasional which incurred cumulative losses of RM50.6 million for the 9-month ended 30/9/2013. In addition, the port operations seems to be sliding, with containers handled for the 9-month ended dropping from 2.355 million TEUs to 2.177 million TEUs. For comparison purpose, NCB's port operations handled 1.461 million TEUs for 6-month ended 30/6/2013 (a decline from 1.568 millon TEUs handled in 6-month ended 30/6/2012) while Westports' port operations handled 3.6 million TEUs for the same period this year.


Table: NCB's last 8 quarterly results


Chart 1: NCBs last 22 quarterly results


Valuation

NCB (at RM3.70 yesterday) is now trading at a PE of 22 times (based on last 4 quarters' EPS of 17 sen). At this PE, NCB is deemed overvalued.

Technical Outlook

NCB broke its accelerated uptrend line, S1-S1 at RM4.10 in late August. Its immediate support is the long-term uptrend line, SS at RM3.40.


Chart 3: NCB's daily chart as at Oct 28, 2013 (Source: quickcharts)

Conclusion

Based on poor financial performance, overvaluation & deteriorating technical outlook, NCB is rated a SELL.

Note: 
In addition to the disclaimer in the preamble to my blog, I hereby confirm that I do not have any relevant interest in, or any interest in the acquisition or disposal of, NCB.

Digi- earning set to rise


Result Update

For QE30/9/2013, DIGI's net profit rose 18% q-o-q or 42% y-o-y to RM449 million while revenue rose marginally by 3% q-o-q or 7% y-o-y to RM1.7 billion. The improved bottom-line on q-o-q basis was due to "a net result of higher service revenues coupled with lower accelerated depreciation in tandem with the tail end of the network modernization exercise, and was partially off-set by higher cost of handsets in line with higher take-up of device-bundled offerings during the current quarter".


Table: DIGI's last 8 quarterly results

We can see that the profit margin has picked up significantly over the past 2 quarters. With that improvement- a result of lower depreciation charges & higher revenue- the company's net profit has made a new high in QE30/9/2013.


Chart 1: DIGI's last 24 quarterly results

Valuation

DIGI (closed at RM4.93 yesterday) is now trading at a PE of 28 times (based on last 4 quarters' EPS of 18 sen). At this multiple, DIGI is deemed full-valued.

Technical Outlook

DIGI has been moving sideway for the past 1 year. However, the stock is still in a long-term uptrend and the signs are showing that it is poised to continue with the prior uptrend. This is reflected in the uptrend breakout of an intermediate downtrend line, RR at RM4.80 as well as all indicators rising upward.


Chart 2: DIGI's monthly chart as at Oct 28, 2013 (Source: quickcharts)

Conclusion

Based on improved financial performance & improving technical outlook, DIGI's rating is now revised from SELL to HOLD. To raise the recommendation again would require further improvement in its earning in order to justify paying a PE of 28 times for this stock.

Note: 
In addition to the disclaimer in the preamble to my blog, I hereby confirm that I do not have any relevant interest in, or any interest in the acquisition or disposal of, DIGI.

Thursday, October 24, 2013

Hiaptek- price recovery may have started


Hiap Teck Ventures Bhd ('Hiaptek') is involved in the manufacture, rental, and distribution of steel pipes, hollow sections, scaffolding equipment and accessories, and other steel products.

For FY2013, it reported a net profit of RM24.3 million in a revenue of RM1.11 billion. This is an improvement over last year result, where its net profit was RM16.6 million while revenue was RM1.12 billion. Its earning inched up from 3.1 sen in FY2012 to 3.4 sen in FY2013. For more, go here.

In May, the stock has broken above its long-term downtrend line and it has since been moving sideway. In the past 2-3 days, it was attempting to break above its recent high of RM0.66. The same movement was noted for the warrant but it has yet to even test its recent high of RM0.25. If the warrant can breach the RM0.25 mark, this stock and the warrant could begin its upleg.

Based on technical consideration, Hiaptek could be a good stock for trading BUY or even a medium-term investment if these securities can stay above their breakout level.


Chart 1: Hiapteck's weekly chart as at Oct 23, 2013_3.00pm (Source: Quickcharts)


Chart 2: Hiapteck-WA's weekly chart as at Oct 23, 2013_3.00pm (Source: Quickcharts)

As at 9.40 am, Hiapteck & Hiaptek-WA were trading at RM0.66 & RM0.255, respectively.

Note: 
In addition to the disclaimer in the preamble to my blog, I hereby confirm that I do not have any relevant interest in, or any interest in the acquisition or disposal of, Hiaptek.

Huayang- profit margin slid further


Results Update

For QE30/9/2013, Huayang's net profit remained unchanged at RM16.7 million when compared to the immediate preceding quarter (QE30/6/2013) but declined by 28% y-o-y from RM17.1 million. Revenue also declined by 2% y-o-y but rose 26% q-o-q to RM101 million. The decline in bottom-line y-o-y was due to slower construction progress.


Table: Huayang's last 8 quarterly results


Huaynag's bottom-line continued to slide as did its profit margin. If profitability for a developer that builds for the mass market is heading south, it is a sign that all is not well with the property sector. The competition is getting very stiff in the race to the bottom of the market (or more appropriately, the lower-to-medium-end of the market which Huayang is positioned) .


Chart 1: Huayang's last 21 quarterly results

Valuation

Huayang (at RM2.27 yesterday) is trading at a PE of 9.7 times (based on last 4 quarters' EPS of 23.3 sen). At this PE, Huayang is still deemed fairly valued, with limited upside.

Proposed Bonus Issue

Huayang has just proposed a 1-for-3 bonus issue on October 10. In the past 4 years, Huayang had carried 4 bonus issue. The past 3 bonus issues are 1-for-4 on Oct 11, 2012: 1-for-3 on Oct 25, 2011; and, 1-for-5 on Sep 24, 2010. There is a saying that too much of a good thing may not be good for you.

Technical Outlook

Huayang's uptrend seems to have hit the wall. Its immediate resistance is at the horizontal line at RM2.40 while its immediate support is at RM1.95-2.00.


Chart 2: Huayang's weekly chart as at Oct 23, 2013(Source: quickcharts)
 
Conclusion

Based on decline in financial performance, a less-than-cheap valuation and neutral-to-cautious technical outlook, I would rate the stock as a SELL INTO STRENGTH.

Note: 
In addition to the disclaimer in the preamble to my blog, I hereby confirm that I do not have any relevant interest in, or any interest in the acquisition or disposal of, Huayang.