Monday, January 06, 2014

Supermx- may have a bullish breakout

Supermx has been rising in an uptrend line, SS since July 2013. Its upside was capped by the horizontal resistance at RM2.85.This morning, it broke above the RM2.85 resistance. Its next resistance level will be the psychological RM3.00 level & then its 2010 high of RM3.30.

Based on techncial analysis, Supermx could be a good trading BUY.


Chart 1: Supermx's daily chart as at Jan 3, 2014 (Source: Tradesignum)


Chart 2: Supermx's weekly chart as at Jan 3, 2014 (Source: Tradesignum)

Note:
In addition to the disclaimer in the preamble to my blog, I hereby confirm that I do not have any relevant interest in, or any interest in the acquisition or disposal of, Supermx.

Friday, January 03, 2014

Success- let the race begin...

Success broke above its 2010 high of RM1.39 last week. Success is swimming upstream against the jaws of the hungry bears; proving to everyone that nothing succeed as well as Success!!!

I had posted on this stock recently (here). From my simple projection, I put a potential target price of RM1.95 for the current move.

Based on satisfactory financial performance, attractive valuation & bullish technical outlook, Success may be a good trading BUY.


Chart: Success's weekly chart as at Jan 2, 2014 (Source: Tradesignum)

Note:
In addition to the disclaimer in the preamble to my blog, I hereby confirm that I do not have any relevant interest in, or any interest in the acquisition or disposal of, Success.

SKPetro- testing its intermediate uptrend line

SKPetro has dropped sharply over the past 2 days prompting concern that something are not right with the stock. However when you look at the chart, you will see that the stock has risen substantially over the past 4 months from a low of RM3.20 to a recent high of RM4.90. It is quite normal for a stock to give back some of its recent gain. As at this posting, SKPetro was trading at RM4.52-4.53. This is fairly near to the uptrend line, SS as well as the horizontal line at RM4.50. If the share price can stay above this level, a rebound may come quite soon. However, if the share price were to break below the RM4.50 mark, then you can expect a long consolidation.

Based on technical consideration, SKPetro could be coming to a good entry level, provided it does not break below the RM4.50 mark.


Chart : SKPetro's weekly chart as at Jan 2, 2014  (Source: tradesignum)

Note:
In addition to the disclaimer in the preamble to my blog, I hereby confirm that I do not have any relevant interest in, or any interest in the acquisition or disposal of, SKPetro.

Thursday, January 02, 2014

Cypark- bottom-line eased off due to higher interest cost

Result Update

For QE31/10/2013, Cypark's net profit dropped 26% q-o-q but rose 44% y-o-y to RM7.3 million while revenue dropped marginally by 1% q-o-q & 5% y-o-y to RM53 million. Bottom-line dropped q-o-q due to the lower revenue generated from the renewable energy related projects. The profit before tax of the Group also decreased by 19.1% q-o-q, from RM11.8 million to RM9.5 million in current quarter due to higher finance costs incurred for environmental engineering and renewable energy projects.


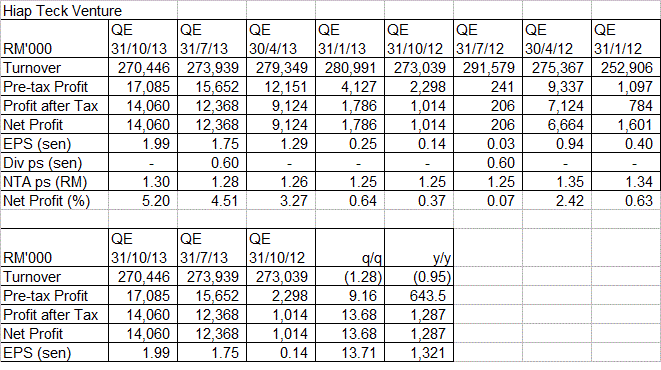
 Table: Cypark's last 8 quarterly results


Chart 1: Cypark's last 14 quarterly results

Financial Position

As at 31/102013, Cypark's financial position is mixed, with current ratio at comfortable 1.2 times while gearing ratio at an elevated level of 1.5 times. Even the current ratio is not free of concern as the bulk of its current assets is in the form of receivables of RM199 million which translates to a debtors' collection period of 335 days. One positive point to note is its cash reserve of RM113 million. If this cash is net off from the bank borrowings, Cypark's gearing ratio would drop to a more reasonable level of 0.96 time.

Valuation

Cypark (closed at RM2.43 at end of morning session) is now trading at a PE of 11 times (based on last 4 quarters' EPS of 21 sen). At this multiple, Cypark is deemed reasonably valued.

Technical Outlook

Cypark rallied in the past 2-3 months to hit its horizontal line at RM2.60. Today, it dropped 12 sen to settle at RM2.43 at end of morning session. This is near a horizontal line of RM2.40 but the really strong support would be at RM2.20. We will have to wait & see whether the stock can hold at the RM2.40 mark.


Chart 2: Cypark's weekly chart as at Dec 31, 2013 (Source: Tradesignum)

Conclusion

Despite the good financial performance & reasonable valuation, Cypark is still rated a HOLD. If the share price were to drop to RM2.20, I think Cypark could be a trading BUY.

Note:
In addition to the disclaimer in the preamble to my blog, I hereby confirm that I do not have any relevant interest in, or any interest in the acquisition or disposal of, Cypark.

SPB- broke above its 2011 high of RM4.55

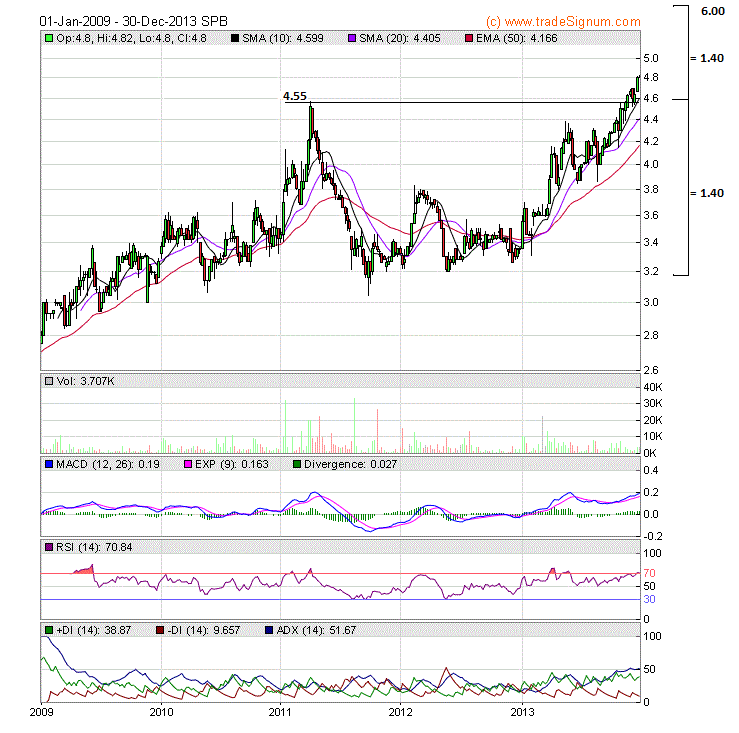
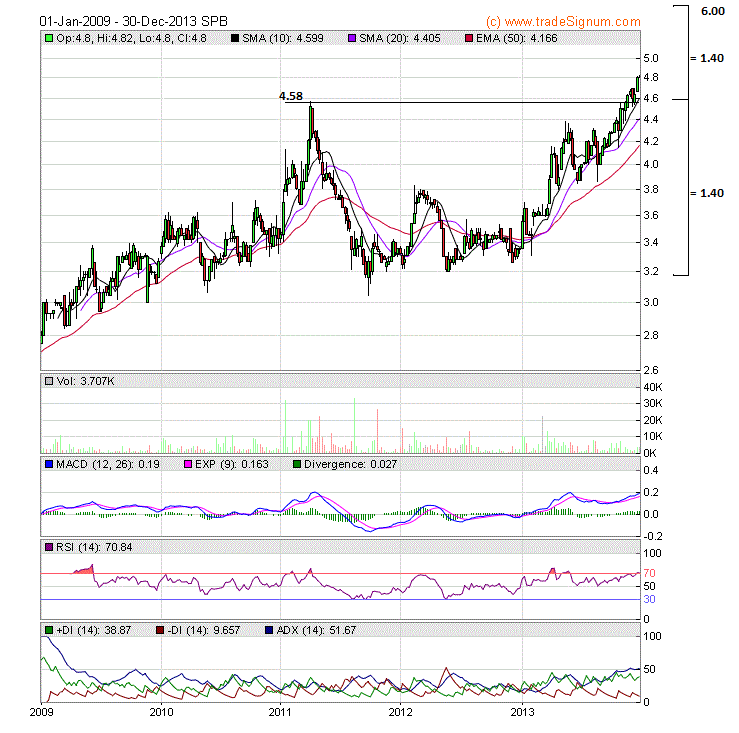
Selangor Properties Bhd ('SPB') has surpassed its 2011 high of RM4.58 4 weeks ago. The upside breakout happened in late November but the rally was cut short by the announcement of the takeover offer for its subsidiary, HELP International Corporation Berhad ('HELP') on December 5 (here). The share price eased back to the breakout level of RM4.55 and the stock rallied again in the past 6 days. See Chart 1 & 2 below.


Chart 1: SPB's daily chart as at Dec 31, 2013 (Source: Tradesignum)


Chart 2: SPB's weekly chart as at Dec 31, 2013 (Source: Tradesignum)

From Chart 2, we can guesstimate that if SPB can recruit enough support, the stock may rally to a target price of RM6.00. This target price is arrived at by adding the distance traveled from the trough in 2012 to the 2011 high (about RM1.40) to the breakout level at RM4.55 (or, RM4.60).

SPB is a profitable property developer and investment company. The biggest complain among its shareholders is the conservative management that failed to realize its valuable land bank. I have tabulated its past 12 years results in the form of a table and a chart below. If you look through its annual report for 2012 (go here), you will see its substantial land bank.


 Table: SPB's past 12 years results


Chart 3: SPB's past 12 years results

Are investors finally recognizing the under-valuation of the land bank in SPB. That's my view after analysing HELP's annual report. I feel that HELP could be a target for takeover because of its land bank in addition to its business.  I have listed below the 3 properties owned by HELP.

Wisma HELP, Lorong Dungun Kiri, Damansara Heights, 50490 Kuala Lumpur
11-storey building known as Wisma HELP (University Campus)
Freehold Land: 43,292 sq ft
Built-up:269,086 sq ft
Age: 33 years
NBV: $30,058,000
Date of Acquisition: 27.11.2003
HELP Residence No. 28, Jalan Damansara, Damansara Heights, 50490 Kuala Lumpur
21-storey building known as HELP Residence (Hostel Building)
Freehold Land: 11,969 sq ft
Built-up: 151,955 sq ft
Age: 5 years
NBV: $46,097,000
Date of Acquisition: 5.5.2010
PT 12291 Seksyen U4 (Subang Delima), Mukim Sungai Buloh, Daerah Petaling, Negeri Selangor
Land for private education
Leasehold for 99 years expires on 5.5.2109
Land area: 23 acres
Age: N/A
NBV: $22,615,000
Date of Acquisition: 17.6.2010
A map of the location of HELP's own properties and rented properties are shown in the map below. This map will show the central location of this part of Damansara Height area where SPB has a few properties.


Map: HELP's premises in Damansara Height area

If HELP's properties are enticing, SPB's properties will be equally enticing. Thus, the play on this stock.

Based on technical breakout, SPB could be a good stock for trading BUY.

Note:
In addition to the disclaimer in the preamble to my blog, I hereby confirm that I do not have any relevant interest in, or any interest in the acquisition or disposal of, SPB.

Airasia- technical outlook is not promising

Since my post on Airasia in November (here), the stock continued to slide. From the semi-log chart below, Airasia has broken below its long-term uptrend line, SS as well as the lower boundary of its downward channel. These double breakdowns will be very negative for the near-term outlook for this stock. It is likely to test the psychological RM2.00 support. Below that, the next support will be the horizontal line at RM1.50.

This technical outlook is opposite the more positive outlook in a few analysts' reports on the stock. As such it is difficult to come a conclusion as to which way the stock may go. In such situation I would recommend that any buying into this stock should be carried out slowly.


Chart: Airasia's weekly chart as at Dec 31, 2013 (Source: Tradesignum)

Note: 
In addition to the disclaimer in the preamble to my blog, I hereby confirm that I do not have any relevant interest in, or any interest in the acquisition or disposal of, Airasia.

Tuesday, December 24, 2013

Merry Christmas & Happy New Year

I would like to wish all my readers a Merry Christmas and a Happy New Year!


AEONCr- running faster to stay in place


Result Update

For QE20/11/2013, AEONCR's net profit was unchanged q-o-q but rose 22% y-o-y to RM43 million while revenue increased by 95 q-o-q or 47% y-o-y to RM178 million.


Table: Aeoncr's last 8 quarterly results

We can see the dip in the profit margin is shown on Chart 1. If you look at Chart 2, we can see that the average quarterly change in top-line and bottom-line seems to diverge in the past 6-7 quarters, with top-line quarterly growth inching higher while bottom-line quarterly growth drifting lower.


Chart 1: Aeoncr's last 26 quarterly results


Chart 2: Aeoncr's average quarterly change in top-line & bottom-line for last 22 quarterly results 

Valuation

AEONCR (closed at RM15.10 yesterday) is now trading at a PE of 13.0 times (based on last 4 quarters' EPS of 116 sen). With weaker consumer sentiment and possible increase in finance cost, the earning of AEONCr is likely to slide further. Thus the PE ratio is likely to increase in the next few quarters. At this moment, AEONCr is deemed fairly valued.

Technical Outlook

AEONCR is still in an uptrend but it is corrected back to its 50-week EMA line at RM14.93 (or RM15.00). If the stock can stay above this support, the uptrend will still be intact. A break below this support would bring forth further consolidation. The next support could be at RM14 & RM12.


Chart 3: Aeoncr's weekly chart as at Dec 23, 2013 (Source: Tradesignum)
 
Conclusion

Based on satisfactory financial performance, fair attractive valuation & still positive technical outlook, AEONCR is rated a HOLD. However, if the share price were to break below the RM15.00  mark or the net profit were to drop next quarter, the rating would be adjusted to REDUCE.

Note:
In addition to the disclaimer in the preamble to my blog, I hereby confirm that I do not have any relevant interest in, or any interest in the acquisition or disposal of, AEONCR.

Wednesday, December 18, 2013

CPO- resting at RM2500 support

CPO pulled back from the recent high of RM2700. It is now resting on the horizontal line RM2500. If it doesn't break below the RM2500 mark, the bullish stance for CPO and plantation stocks would remain. A break below the RM2500 mark would be negative for CPO and plantation stocks. Let's wait & see how CPO will fare over the next few days.


Chart: CPO's weekly chart as at Dec 17, 2013 (Source: ifs.marketcenter)

Hiaptek- bottom-line inched higher

Background

Hiap Teck Ventures Bhd ('Hiaptek') is involved in the manufacture, rental, and distribution of steel pipes, hollow sections, scaffolding equipment and accessories, and other steel products.It has a 55%-stake in a JV with China Shougang International Trade & Engineering Corporation of China to build an integrated steel mill in Kemaman, Terengganu. The JV vehicle is Eastern Steel Sdn Bhd. The mill will have a production capacity of 1.5 million tonnes of steel slabs and cost RM750 million. The mill is currently under construction and expected to be completed end of the year (here).


Source: Company's website

Result Update

For QE31/10/2013, Hiaptek's net profit increased by 14% q-o-q or 13-fold to RM14 million while revenue dropped marginally to RM270 million. The improved bottom-line was attributed to the share of profit from jointly controlled entity.


Table 1: Hiaptek's last 8 quarterly results

From the chart below, we can see that Hiaptek's profit margin is slowly recovering. This could be a sign that the company's profit could improve in the years ahead.


Chart 1: HiaptekScientx's last 31 quarterly results

Valuation

Hiaptek (closed at RM0.745 yesterday) is now trading at a current PE of 14.1 times (based on annualized EPS of 5.28 sen). At this price, it has a Price/Book Value of 0.6 time (based on NTA of RM1.30 p.s.) The elevated PE will contract once the earning expands. For now, the P/BV ratio will be a better guide of the stock's valuation and that multiple seems to suggest that the stock is reasonably valued.

Technical Outlook

Hiaptek has broken above its downtrend line in May. A short-term uptrend has begun but it is capped by the immediate resistance at RM0.75. If it can surpass this level, its next resistance is at RM0.90.


Chart 2: Hiaptek's weekly chart as at Dec 17, 2013 (Source: Tradesignum)

Conclusion

Based on improving financial performance and positive technical outlook, Hiaptek could be a good stock for long-term investment.

Note:
In addition to the disclaimer in the preamble to my blog, I hereby confirm that I do not have any relevant interest in, or any interest in the acquisition or disposal of, Hiaptek.

Scientx- weaker outlook for next few months

Result Update

For QE31/10/2013, Scientx's net profit dropped 4% q-o-q but rose 15% y-o-y to RM29.3 million while revenue also dropped 2% q-o-q but rose 51% y-o-y to RM365 million. The y-o-y increase in top-line & bottom-line is attributable to the acquisition of GW Plastic which was completed in January 2013. The q-o-q decline in top-line & bottom-line is attributable to thefollowing:
  • Manufacturing Division's revenue increased from RM277 million to RM289 million while operating profit dropped from RM21 million to RM17 million; and
  • Property Development Division's revenue dropped from RM94 million to RM75 million and operating profit also similarly dropped from RM31 million to RM22 million
.
Table 1: Scientx's last 8 quarterly results


Chart 1: Scientx's last 33 quarterly results 

Prospects Ahead

Scientx's Manufacturing Division may see another wave of growth after it has completed its acquisition of SEACERA Polyfilms SB, a company involved in the production of biaxially oriented polypropylene films. The cost of acquisition is RM40 million and the expected completion will be in November 2014.

In addition, Scientx's Property development Division will launch another 7 property development projects. This will bring its total projects to 14. The total GDV of these 14 projects is RM7 billion and they will last for 10 years. However, property development is currently weak after the Government's fiscal measures to curb speculation. Recovery is only expected in the middle of 2014.

Valuation

Scientx (closed at RM5.61 yesterday) is now trading at a current PE of 10.6 times (based on annualized EPS of 52.7 sen). At this PE, Scientx is deemed fairly valued.

Technical Outlook

Scientx is in an uptrend since 2009. Currently, the stock is trading sideways with resistance at RM5.60-5.70. The breakout above this resistance may only come once the property sector shows recovery and Scientx has completed its acquisition of SEACERA.


Chart 2: Scientx's weekly chart as at Dec 17, 2013 (Source: Tradesignum)

Conclusion

Based on satisfactory financial performance and reasonable valuation, Scientx remains a good stock for long-term investment. However, its neutral technical outlook reflects its weaker near-term prospect as one of its 2 business segments would be weaker for the next 2-3 quarters.  I would rate Scientx a HOLD.
 
Note:
In addition to the disclaimer in the preamble to my blog, I hereby confirm that I do not have any relevant interest in, or any interest in the acquisition or disposal of, Scientx.

REIT- sufficiently attractive for consideration

Over the past few months, high-yield assets were sold off as interest rate regime began to show signs of reversing after a long decline (see Chart 1 below). Among the high-yield assets, REITs have corrected significantly over the past few months. If you look at Chart 2, you will see that DJ Equity REIT has dropped below its 200-day SMA line. The index seems to have found support at around the 250-mark (with the reaction low converging at that level). The last time the index dropped below the 200-day SMA line was in late 2011. Back then, the reaction lows reflect an inverted head-and-shoulder pattern. Will the index recover from here? We will have to wait and see.


Chart 1: Treasury Yield 30 year's monthly chart as at Dec 13, 2013 (Source: Yahoo Finance)


Chart 2: DJ Equity REIT's weekly chart as at Dec 13, 2013 (Source: Yahoo Finance)

In our local bourse, we do not have an index for REITs. But we can see that the individual charts below, the drop in the prices of REITS had been horrific. Unlike the US markets, our REITs were hit by a double whammy - ongoing foreign find outflow and fear of interest rate hikes to come.

I will look at the top 3 REITs in term of market capitalization, excluding IGBREIT as it was listed only 1 year ago. All 3 have a P/BV of about 1.1 times. In term of yield, SUNREIT and CMMT have higher yield than PAVREIT. See the table below.


Table: Top 3 REITs on BURSA as at Dec 13, 2013

If you look at the charts below, you will see that all 3 REITs had dropped substantially. The retracement is about 56% for SUNREIT and 62-63% for PAVREIT and CMMT. All these REITs are now trading at or near their horizontal support.


Chart 3: CMMT's weekly chart as at Dec 16, 2013 (Source: Tradesignum)


Chart 4: PAVREIT's weekly chart as at Dec 16, 2013 (Source: Tradesignum)


Chart 5: SUNREIT's weekly chart as at Dec 16, 2013 (Source: Tradesignum)

Based on technical consideration, I believe that you can consider buying this asset for your portfolio. In addition, these REITs are approaching their book value soon. With yield better than 6%, these REITs could be attractive assets for income purpose. (Note: SUNREIT pays income 4 times a year.)

However, with interest rate hikes a distinct possibility and the outflow of foreign fund a continuing drag, I do not believe we will see a strong recovery any time soon. We can only hope for a bottom and then a slow climb-up many months down the road. Thus, any buying should be carried out very slow.

Note:
In addition to the disclaimer in the preamble to my blog, I hereby confirm that I do not have any relevant interest in, or any interest in the acquisition or disposal of, CMMT, PAVREIT & SUNREIT.

Tuesday, December 17, 2013

Apollo- top-line & bottom-line declined


Result Update

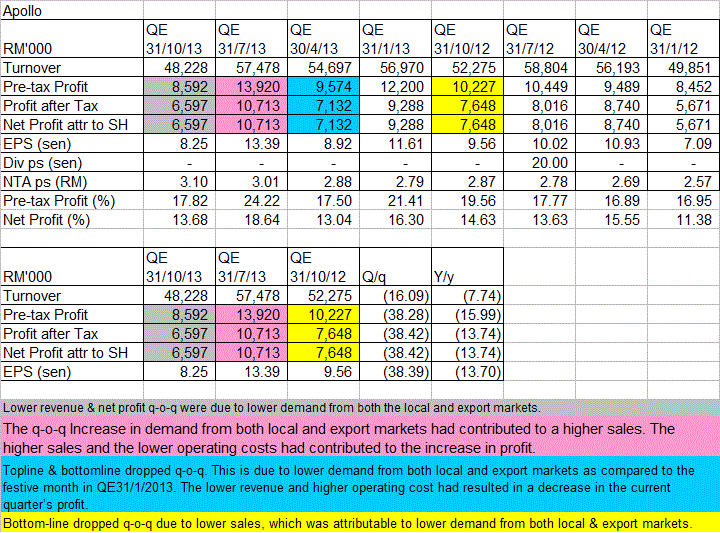
For QE31/10/2013, Apollo's net profit dropped 38% q-o-q or 14% y-o-y to RM6.6 million while revenue dropped 16% q-o-q or 8% y-o-y to RM48 million. The decline in revenue & profit was attributed to lower demand from both local & overseas markets.


Table 1: Apollo's last 8 quarterly results


Chart 2: Apollo's last 25 quarterly results

Valuation

Apollo (closed at RM4.98 yesterday) is now trading at a PE of 12 times (based on last 4 quarters' EPS of 42 sen). Apollo is deemed fairly valued.

Technical Outlook

After it broke above its horizontal resistance at RM3.50, Apollo went into a steady uptrend that sent it to a high of RM5.60-5.70. The strong uptrend may have ran its course and the stock is likely to consolidate for a while.


Chart 2: Apollo's monthly chart as at Dec 16, 2013 (Source: Tradesignum) 

Conclusion

Despite the poorer financial performance,  Apollo remained a good stock for a long-term investment based on  reasonable valuation. For that, the stock is rated a HOLD.

Note:
In addition to the disclaimer in the preamble to my blog, I hereby confirm that I do not have any relevant interest in, or any interest in the acquisition or disposal of, Apollo.

Monday, December 16, 2013

NTPM- profit margin starting to expand

Result Update

For QE31/10/2013, NTPM's net profit increased by 34% q-o-q or 31% y-o-y to RM16.0 million while revenue inched up 2% q-o-q or 7% y-o-y to RM127 million. The improvement in top-line & bottom-line came from both the paper products & personal care products divisions. 


Table: NTPM's last 8 quarterly results

NTPM's profit margin is beginning to improve and this could set the stage for an increase in its net profit. The last time this happened was in early 2008 which led to a rally in NTPM.


Chart 1: NTPM's last 33 quarterly results

Valuation

NTPM (closed at RM0.75 last Friday) is now trading  at a PE of 15.3 times (based on last 4 quarters' EPS of 4.9 sen). At this PE multiple, NTPM is deemed fairly valued.

Technical Outlook

NTPM is in an uptrend after it broke above the horizontal line at RM0.62 in September.


Chart 2: NTPM's weekly chart as at Dec 13, 2013 (Source: Tradesignum)

Conclusion

Despite trading at its fair valuation, NTPM could continue its uptrend based on improving financial performance & still-positive technical outlook,

Note:
In addition to the disclaimer in the preamble to my blog, I hereby confirm that I do not have any relevant interest in, or any interest in the acquisition or disposal of, NTPM.

Friday, December 13, 2013

SKPetro- just broke to a new high

SKPetro broke above its recent high of RM4.50 today. With this breakout, the stock may continue its uptrend. Previous breakout of the preceding high was in May and the stock rose from the breakout level of RM3.20 to RM4.50. Will the same happen again? We will wait & see.

Based on technical consideration, SKPetro could be a trading BUY.


Chart : SKPetro's weekly chart as at Dec 12, 2013  (Source: tradesignum)

Note:
In addition to the disclaimer in the preamble to my blog, I hereby confirm that I do not have any relevant interest in, or any interest in the acquisition or disposal of, SKPetro.

Thursday, December 12, 2013

L&G- has a bullish breakout

Thanks to a very bullish report from Hwang DBS - an extract is published in the Edge - L&G managed to surge through its triangle formation yesterday. The gist of the report is:
1. L&G has RM800 million of unbilled sales from Elements@Ampang & Damansara Foresta Phase 1. These two developments will be completed in 2QCY2014 & 4QCY2015. Thus, L&G will book in profit of RM200 million over the next 3 years.
2. L&G will be launching RM1.5 billion worth of projects in 2014- under Damansara Foresta Phase 2, Elements2@ Ampang & Seremban Phase 1.
3. L&G has cash in hand of RM250 million and likely to pay out dividend next year.
In view of the above, Hwang DBS valued L&G at RM0.65.


Chart: L&G's daily chart as at Dec 11, 2013 (Source: Tradesignum)

Based on technical consideration & reasonable valuation, L&G could be a potentially trading BUY. 

Note:
In addition to the disclaimer in the preamble to my blog, I hereby confirm that I do not have any relevant interest in, or any interest in the acquisition or disposal of, L&G.

LBAlum- an attractive building material stock

Background

LB Aluminium Bhd ('LBAlum') is involved in the manufacturing, marketing & trading of aluminium products, such as aluminium extrusion, expanded mesh, sheets/coils, ceiling suspension system, fittings & accessories. Currently, its main market is Malaysia which accounts for 75% of its revenue while the remaining 25% are exported to Singapore and other neighboring countries.

Results Update

For QE31/10/2013, LBAlum's revenue has risen steadily over the past few quarters due to higher sales volume & higher average selling prices. Profit margin has risen from 2% in 2011 to 6% today. As a result, we can see that  LBAlum's net profit rose 150% to RM22.0 million for the last 4 quarters compared to RM8.8 million achieved in the preceding 4 quarters.


Table: LBAlum's last 8 quarterly results


Chart 1: LBAlum's last 17 quarterly results

Financial position

LBAlum's financial position as at 31/10/2013 is deemed satisfactory with current ratio at 2.1x and gearing ratio at 0.3x. Working capital management improved marginally with debtors' collection period & inventory holding period improved from 170 days to 166 days and from 109 days to 98 days, respectively. Cash holdings rose from RM21 million as at 30/4/2013 to RM31 million as at 31/10/2013 (or, amounting to 12 sen per share).

Valuation

LBAlum (closed at RM0.52 yesterday) is now trading at a PE of 5.9 times (based on last 4 quarters' EPS of 8.8 sen) or at a P/BV of 0.5x. Dividend yield is at a decent 3.4%. At these PE & P/BV multiples, LBAlum is fairly attractive.

Technical Outlook

LBAlum broke above its downtrend line at RM0.38-0.40 in May this year. Its immediate resistance is at the recent high of RM0.55-0.57 and, beyond that, it may encounter resistance from the 2010 high of RM0.60-0.63. Its immediate support is at psychological level at RM0.50 and the horizontal line at RM0.47.


Chart 2: LBAlum's weekly chart as at Dec 11, 2013 (Source: Tradesignum)

Conclusion

Based on good financial performance & attractive valuation, LBAlum could be a good stock for a medium-term investment.

Note:
In addition to the disclaimer in the preamble to my blog, I hereby confirm that I do not have any relevant interest in, or any interest in the acquisition or disposal of, LBAlum.

Monday, December 09, 2013

Maybank- poised for the next upleg

Maybank has been in an intermediate downtrend, RR for the past 4 months. Recently it broke above this downtrend line at RM9.80. As Maybank's MACD is still in the negative territory, the stock is still not in advancing mode. However, with the market sentiment improving steadily, Maybank's participation is crucial and I believe it will join in soon.

With the bullish breakout and improving overall sentiment, I believe that Maybank shall begin its upleg soon.


Chart: Maybank's daily chart as at Dec 6, 2013 (Source: Tradesignum)

Based on technical consideration & reasonable valuation, Maybank could be a potentially trading BUY. 

Note:
In addition to the disclaimer in the preamble to my blog, I hereby confirm that I do not have any relevant interest in, or any interest in the acquisition or disposal of, Maybank.

Bstead may have a bullish breakout


Bstead gained 12 sen to close at RM5.51 at the end of the morning session. A this level, Bstead has broken above its intermediate downtrend line, RR at RM5.45. If it can stay above this level, Bstead may continue its prior uptrend.


Chart: Bstead's weekly chart as at Dec 6, 2013 (Source: Tradesignum)

Based on technical consideration & reasonable valuation, Bstead could be a potentially trading BUY. 

Note:
In addition to the disclaimer in the preamble to my blog, I hereby confirm that I do not have any relevant interest in, or any interest in the acquisition or disposal of,Bstead.

Brem may have a bullish breakout


Brem is involved in property development & investment, civil engineering & construction and water supply & services. In 1H2014, Grem reported a net profit of RM18.8 million on revenue of RM92.2 million.  Compared to 1H2013, the top-line and bottom-line improved substantially due to mainly to better performance from the property development segment.

As at 10.00am, Brem was trading at RM1.35 (a gain of 7 sen). At this price, it is trading at a PE of 6 times- a fair price for a small cap stock.

Chartwise, it has just broken above its horizontal line at RM1.32. With this breakout, the stock could potentially rise to RM1.50-1.55.


Chart: Brem's weekly chart as at Dec 6, 2013 (Source: Tradesignum)

Based on technical consideration & reasonable valuation, Brem could be a good trading BUY. 

Note:
In addition to the disclaimer in the preamble to my blog, I hereby confirm that I do not have any relevant interest in, or any interest in the acquisition or disposal of, Brem.