Thursday, January 08, 2015

O&G stocks stop dropping

Despite the alarming drop in the price of crude oil in the past few weeks (see weekly Chart 1),  there are tentative signs that the bottom is near. From monthly Chart 2, we can see that the long-term uptrend line is still intact. At the same time, we can that most indicators are starting to curve upward.


Chart 1: WTIC's weekly chart as at Jan 7, 2015 (Source: Investorshub)


Chart 2: WTIC's monthly chart as at Jan 7, 2015 (Source: Investorshub)

The prices of O&G stocks listed on Bursa Malaysia seem to confirm the possible bottom in the price of crude oil. We can see from the chart below that SKPETRO, COASTAL, UMWOG & ARMADA failed to retest its recent low despite crude oil price making new low in the past 2 weeks.


Chart 3: SKPETRO, COASTAL, UMWOG & ARMADA's weekly chart as at Nov 21, 2014 (Source: Tradesignum)

Based on the above, I think it is now a good time to start our slow accumulation of good O&G stocks at the current low prices.

Note:
In addition to the disclaimer in the preamble to my blog, I hereby confirm that I do not have any relevant interest in, or any interest in the acquisition or disposal of, SKPETRO, COASTAL, UMWOG & ARMADA.

FBMKLCI-HB Tells a Tale?

If you compared the movement of FBMKLCI-HB & FBMKLCI over the past 6 months, you would notice a divergence (see Chart 1). When FBMKLCI-HB broke above the horizontal line, a in October, it coincided with FBMKLCI breaking below its horizontal line, A. Similarly, when FBMKLCI-HB broke above the horizontal line, b in December, it coincided with FBMKLCI breaking below its horizontal line, B. However, FBMKLCI-HB has been trading above its recent high since the start of the year, FBMKLCI has yet to surplus its recent low.

There are 2 possible explanations or scenarios:
1. The bearish case is that FBMKLCI may eventually catch up with the FBMKLCI-HB (in the opposite direction)
2. The neutral case is that FBMKLCI-HB has its own demand dynamic as it serves as a portfolio insurance in the event of a bear market. You may notice that FBMKLCI-HG has also surpassed its recent high. In a bearish market, put warrant is the appropriate trading instrument.


Chart 1: FBMKLCI & FBMKLCI-HB's daily chart as at Jan 7, 2015 (Source: Shareinvestor.com)

I have tabulated the valuation for all the put options/warrants for FBMKLCI below. FBMKLCI-HB & FBMKLCI-HG have more volume and as such, they are better suited for analysis. However, since FBMKLCI-HB was listed earlier, it offers a better comparison with FBMKLCI for our study.


Table 1: FBMKLCI-HWs' Valuation Table


Chart 2: FBMKLCI-HB's daily chart as at Jan 7, 2015 (Source: Shareinvestor.com)


Chart 3: FBMKLCI-HG's daily chart as at Jan 7, 2015 (Source: Shareinvestor.com)

I have also appended below the volume distribution of FBMKLCI-HB & FBMKLCI-HG. It shows that the transactions involved are fairly small, possibly due to speculative activities by retailers. If so, the divergence noted may be less significant as retailers tend to trade haphazardly. However, institutional traders are also known to trade in smaller lots to disguise their activities. As such, it is hard to come to a firm conclusion whether the trading for these 2 put options are retailer-driven or institutional-driven.


Diagram: Volume Distribution for FBMKLCI-HB & HG (Powered by Shareinvestor.com)

On the other hand, the trading in the call options of FBMKLCI is less of a guide as the volume for many of these options is very small. Nevertheless, I have appended below the valuation table for these call options/warrants. The chart of one of the slightly more active call warrants (FBMKLCI-CO) is shown below.


Table 2: FBMKLCI-CWs' Valuation Table


Chart 4: FBMKLCI-CO's daily chart as at Jan 7, 2015 (Source: Shareinvestor.com)

Based on the movement of FBMKLCI-HB, there is a good possibility that the index may revisit or even surpassing the recent low of 1671. This is based on the bearish assumption that FBMKLCI should track the movement of FBMKLCI-HB. On the other hand, if you feel that the movement of FBMKLCI-HB was driven by retailer trading activities or portfolio insurance buying, then the divergence may be less significant.

Note:
In addition to the disclaimer in the preamble to my blog, I hereby confirm that I do not have any relevant interest in, or any interest in the acquisition or disposal of FBMKLCI or any of the call or put warrants.

Monday, January 05, 2015

Airasia: Still in a long-term uptrend

Airasia has been holding very well despite the negative news flow from the recent plane crash. From the semi-log monthly chart below, we can see that it is still in a long-term uptrend line (SS) with support at RM2.40. This level is also a strong horizontal support. Thus, I believe the stock should stay at or above this level.

Due to lower fuel prices, Airasia has been rising gradually in the past 6 months. This intermediate trend ran counter the 3-year downward channel, AB-A1B1.

Based on technical outlook & expected improvement in the financial performance (flowing from lower fuel cost), I would rate Airasia a HOLD for now. It could be good for a slow accumulation at RM2.40 mark.


Chart: Airasia's monthly chart as at Jan 2, 2015 (Source: ShareInvestor.com)

Note:
In addition to the disclaimer in the preamble to my blog, I hereby confirm that I do not have any relevant interest in, or any interest in the acquisition or disposal of, Airasia.

Pohuat: Uptrend to continue

Results Update

On Dec 24, Pohuat announced a good set of results for 4Q14. A comparison between FY14 & FY13 results shows that revenue grew by 5% to RM377 million while net profit increased by 42% to RM11 million. The improvement in bottom-line is attributable to higher net profit margin of 6.3% vs. 4.7% previously. This is partly due to higher production of furniture by low-cost subsidiaries in Vietnam as well as favorable forex movement.


Table 1: Pohuat's last 8 quarterly results


Chart 1: Pohuat's last 32 quarterly results

10-quarter P&L and Cash Flow

From the diagram below, we can see that Operating Cash Flow has been very healthy for the past 10 quarters.


Diagram 1: 10-quarter P&L & Cash Flow (Powered by Shareinvestor.com)

10-year P&L and 6-year Cash Flow

From the diagram below, we can see the improved profit margin as well as the strong Operating Cash Flow in the past 3 years.

 
Diagram 2: 10-year P&L & 6-year Cash Flow (Powered by Shareinvestor.com)

Fundamental Snapshot

Using the information available in Shareinvestor.com, we can see the following:
1. Improving liquidity & gearing position
2. Improving management efficiency
3. Lowering of PE ratio & increasing DY
4. Rising profit marginal albeit erratic revenue trend


Diagram 3: Fundamental Snapshot (Powered by Shareinvestor.com)

Technical Outlook

Last week, Pohuat broke above its symmetrical triangle at RM1.40 - a continuation of its prior uptrend. After a shoot pause at that level for the past 3 days, the stock is again marching higher. (see Chart 1). At the time of writing,m the stock was trading at RM1.55.


Chart 2: Pohuat's weekly chart as at Jan 2, 2015 (Source: ShareInvestor.com)

From Chart 2, we can see that the next resistance will be at RM1.80.


Chart 3: Pohuat's monthly chart as at Jan 2, 2015 (Source: ShareInvestor.com)

Conclusion

Based on good financial performance & position, attractive valuation & positive technical outlook, Pohuat could be a good stock for medium-term investment.

Note:
In addition to the disclaimer in the preamble to my blog, I hereby confirm that I do not have any relevant interest in, or any interest in the acquisition or disposal of, Pohuat.

Market Outlook as at Jan 5, 2015

From the 3 charts below, we can see that the market ended the last week of 2014 on a weaker note. A close examination will reveal that the market rose steadily from Dec 22-29 albeit on lower volume. After it made a high of 1770, the volume picked up. The increased activity on the last 2 days (Dec 30 & 31) reflects profit-taking or distribution. If no fresh buying surfaces in the next few days, the market is likely to commence its slide. Will the market hold above 1700? Will it revisit the low at 1670-1680? At the time of writing, FBMKLCI was down at 1738.

We will have to wait & see.


Chart 1: FBMKLCI's daily chart as at Jan 2, 2015 (Powered by ShareInvestor.com)


Chart 2: FBMEmas's daily chart as at Jan 2, 2015 (Powered by ShareInvestor.com)


Chart 3: FBMSCAP's daily chart as at Jan 2, 2015 (Powered by ShareInvestor.com)

Note:
In addition to the disclaimer in the preamble to my blog, I hereby confirm that I do not have any relevant interest in, or any interest in the acquisition or disposal of FBMKLCI.

Sunday, December 28, 2014

Happy New Year

I will be on a short hiatus for the whole of next week. I will be back in action the following week.

Until then, I wish all my readers a very Happy New Year.


Source: happynewyear2015wallpapers.info

Wednesday, December 24, 2014

Merry Christmas

Wishing everyone a Merry Christmas.


Source: Freechristmaswallpapers.net

Tuesday, December 23, 2014

Yinson: Bottom-line improved due to forex & disposal gain

Results Update

For QE31/10/2014, Yinson's net profit increased by 183% q-o-q or 460% y-o-y to RM87 million while revenue was mixed- down 9% q-o-q but rose 8% y-o-y to RM255 million. Pre-tax profit increased due to RM20.9 million gain on the disposal of a subsidiary and stake in a JV, increase in forex gain of RM24.8 million and higher contribution from its marine segment.


Table 1: Yinson's last 8 quarterly results

From the table below, we can see that Yinson's revenue growth came from the Marine segment while the Trading segment has suffered decline in revenue. At the same time, the Marine segment contributed a sizable chunk of its operating profit.


Table 2: Yinson's segmental results for QE31/10/2014


Chart 1: Yinson's last 29 quarterly results 

Valuation

Yinson (RM2.81 yesterday) is now trading at a trailing PE of 15.2 times (based on last 4 quarters' EPS of 18.4 sen). However, if we exclude the exceptional gain from disposal of subsidiary & stake in JV plus forex gain, the last 4 quarters' EPS would be reduced to. ~14.0 sen and PE would rise to 20 times. While the earning growth has been solid, it is doubtful that this trend will continue given the current weak crude oil environment. As such, Yinson is deemed fully valued for now.

Technical Outlook

Yinson is in an uptrend, with support at RM2.40 (using the 20-month SMA line as a proxy for uptrend line). The RM2.40 level is also the neckline for a head-and-shoulder formation which is still intact. If Yinson stay above the neckline of the head-and-shoulder formation, it will convert from a potential reversal pattern to a continuation pattern; thus signaling the continuation of the prior or current uptrend.


Chart 2: Yinson's monthly chart as at Dec 22, 20114 (Source: ShareInvestor.com)

 
Chart 3: Yinson's weekly chart as at Dec 22, 20114 (Source: ShareInvestor.com)

Conclusion
Based on satisfactory financial performance & positive technical outlook, Yinson is rated a good stock for medium-term investment. However, its upside potential is limited as the stock is fully valued for now.

Note:
In addition to the disclaimer in the preamble to my blog, I hereby confirm that I do not have any relevant interest in, or any interest in the acquisition or disposal of, Yinson.

Monday, December 22, 2014

Market Outlook as at December 22, 2014

Our FBMKLCI rebounded very well today. At the time of writing (4:40pm), the index is up 29 points at 1745. The question on everyone's mind is whether this is the beginning of the recovery.

Looking at the weekly chart, it is clear that our FBMKLCI was in a Head-and-shoulder formation until it broke below the neckline at 1770 two weeks ago. This means that FBMKLCI has a bearish reversal. Based on a 1-for-1 projection, the immediate downside will be 1640. It may go below that level. However, if FBMKLCI can climb back above the neckline of 1770, the bearish reversal may be negated.

It has been 2 weeks since the breakdown and I feel that the market had ample opportunity to recover above the neckline and it failed to do so. If you shared this view, then you should use the current rebound to reduce your position. The rebound may fail at 1750-1770.


Chart: FBMKLCI's weekly chart as at Dec 19, 2014 (Powered by ShareInvestor.com) 
 
Note:
In addition to the disclaimer in the preamble to my blog, I hereby confirm that I do not have any relevant interest in, or any interest in the acquisition or disposal of FBMKLCI.

AEONCR: Uptrend ended!

Result Update

For QE20/11/2014, AEONCR's net profit increased by 2% q-o-q or 12% y-o-y to RM48 million while revenue inched higher by 3% q-o-q or 21% y-o-y to RM216 million. Pre-tax profit improved 15.9% y-o-y due to 29.5%-increase in financing receivables (brought on by 3.6%-growth in financing volume) plus 64.6%-increase in other op. incomes (due to increase in bad debts recovered and AEON Big loyalty program processing fee). These had more than offset the increase in non-performing loans (NPL) ratio from 2.02% to 3.07% and increase in the ratio of total operating expenses against revenue from 58.7% to 60.4%. and higher average funding cost (though no number was given). The Company’s effective tax rate was higher than the statutory tax rate as certain expenses are not deductible for tax purpose.


Table: Aeoncr's last 8 quarterly results


Chart 1: Aeoncr's last 30 quarterly results

Valuation

AEONCR (closed at RM11.04 last Friday) is now trading at a PE of 8 times (based on last 4 quarters' EPS of 138 sen). At this PE, AEONCR is deemed very attractive. Based on earning CAGR of about 20%, the stock's PEG ratio is at an attractive 0.4 time.

Technical Outlook

AEONCR's uptrend has reversed, with lower troughs and lower peaks. Immediate support is at the psychological RM10.00 level.


Chart 2: Aeoncr's monthly chart as at Dec 19, 2014 (Source: ShareInvestor.com)

Conclusion

Based on good financial performance & attractive valuation, AEONCR is still a good stock for long-term investment. However, AEONCR will likely to slide further as its technical outlook has turned negative.

Note:
In addition to the disclaimer in the preamble to my blog, I hereby confirm that I do not have any relevant interest in, or any interest in the acquisition or disposal of, AEONCR.

Scientx: Bottom-line dipped

Result Update

For QE31/10/2014, Scientx's net profit  dropped by 38% q-o-q but rose 3% y-o-y to RM30 million while revenue grew by 4% q-o-q or 18% y-o-y to RM431 million. Pre-tax profit dropped q-o-q due to poorer products mix for both manufacturing & property development divisions plus provision for unrealized forex loss of RM5.0 million.


Table 1: Scientex's last 8 quarterly results


Chart 1: Scientex's last 37 quarterly results

Valuation

Scientex (at RM7.08 last Friday) is now trading at a trailing PE of 10.4 times (based on last 4 quarters' EPS of 68 sen). With strong growth of about 30% last 4 quarters, Scientx is an attractive growth stock with PEG ratio is about 0.3 time only.

Technical Outlook

Scientx has been in an uptrend since breaking above its large triangle (ABC) at RM1.50 in early 2010. Despite the recent selldown, Scientx's uptrend is still intact. The sharp q-o-q drop in bottom-line could lead to short-term weakness in the share price.


Chart 2: Scientex's weekly chart as at Dec 19, 2014 (Source: Tradesignum)

Conclusion

Based on good financial performance, attractive valuation & positive technical outlook, Scientex remains a good stock for medium to long-term investment.

Note:
In addition to the disclaimer in the preamble to my blog, I hereby confirm that I do not have any relevant interest in, or any interest in the acquisition or disposal of, Scientex.

VS: A good quarter!

Result Update

For QE31/10/2014, VS's net profit dropped by 3.4% q-o-q but rose 268% y-o-y to RM35 million while revenue rose marginally by 1.9% q-o-q or 25% y-o-y to RM545 million. Pre-tax profit increased q-o-q mainly attributable to higher sales generated by the Malaysian operations compared to the preceding quarter coupled with improved gross profit margin resulting from improved sales mix for the Malaysian operations. Profit after tax dropped q-o-q as VS did not enjoy a tax credit, unlike the immediate preceding quarter. For QE31/10/2014, it recognized a lower tax incentive in relation to the export incentive of RM4.04 million as compared to an oversized export incentive of RM20.38 million in QE31/7//2014.


Table 2: VS's last 8 quarterly results


Chart 1: VS's last 39 quarterly results

Valuation

VS (closed at RM2.41 last Friday) is trading at a trailing PE of 6 times (based on last 4 quarters' EPS of 42 sen). If we exclude the exceptional large tax credit for QE31/7/2014, the 4 quarters' EPS  would be reduced to 32 sen and the trailing PE would rise to 8 times. Based on the revised PE, VS is still trading at undemanding PE multiple.

Technical Outlook

VS was a strong uptrend since June this year. It rose from RM1.60 to a high of RM2.70 in October before dropping to an intra-day low of RM2.08 on December 15. Since the release of its good results, the stock had rebounded to about RM2.40. We can see that VS's immediate resistance and support are RM2.70 & RM2.20, respectively.


Chart 3: VS's monthly chart as at Dec 19, 2014 (Source: ShareInvestor.com)

Conclusion

Based good financial performance and fairly attractive valuation, VS is still a good stock for medium-term investment. To go higher, the share price needs to break above the immediate resistance of RM2.70.

Note:
In addition to the disclaimer in the preamble to my blog, I hereby confirm that I do not have any relevant interest in, or any interest in the acquisition or disposal of, VS.

Friday, December 19, 2014

Market Outlook as at December 19, 2014

Courtesy of ShareInvestor.com, I have accessed to a powerful website that offers fundamental & technical analysis that are very useful to investors and traders alike.

From this paid website, I have been studying the FBMKLCI chart for the past few days. You will notice that the FBMKLCI has been in an upward channel since 1999 (see the blue lines). If you divide the channel into 2 halves, i.e. X-Y & Y-Z, you can see 2 distinct periods: 2000 to 2007 (denoted as 'Zone A') and 2008 until today (denoted as 'Zone B').,

In Zone A, you will see that the index was trading mostly in the lower half of the channel, except for 2007. In Zone B, the index was trading mostly in the upper half of the channel. Why? Is it because US & Japanese central banks flooded their market with easy money thru QE? If so, what would happen when US Fed begins the tightening measures next year? Would ECB's easy money policies be sufficient to make up for Fed's withdrawal?

In Zone A, the index's upside was capped in the lower half from 2004-2006 by the line Y-Y1. Would the opposite happens this time around, i.e. would the line Y-Y1 acts as the support if the market were to weaken further?

These are some questions I can post here today because our market has rebounded nicely over the past 2 days. Let's hope that the market will be kinder to us for the rest of the year, so that we can have a worry-free Xmas and a bountiful New Year.


Chart: FBMKLCI's monthly chart as at Dec 19, 2014 (Powered by ShareInvestor.com)

Note:
In addition to the disclaimer in the preamble to my blog, I hereby confirm that I do not have any relevant interest in, or any interest in the acquisition or disposal of FBMKLCI.

Tuesday, December 16, 2014

Japanese Yen: At the critical juncture

What's happening to the yen? JPY has depreciated by 15% against USD in the past 3 months and as much as 30% against USD since October 2012. See Chart 4 below.


Chart 1: JPY-USD & USD-JPY's weekly chart as at Dec 12, 2014 (Source: Stockcharts.com)

The long-term uptrend for JPY-USD is still intact provided it does not break below the 0.008 mark (or 1 JPY = 0.008 USD). Alternatively, the long-term downtrend for USD-JPY is still intact provided it does not break above the 125 mark (or 1 USD = 125 JPY).

A breakout of this 40-year trend would have serious ramification, which I am not in the position to examine. However, given the difficulty that the Japanese government is facing in trying to revive the economy, one cannot rule out the possibility that Japanese government may adopt extreme measures, including a cheap yen policy to jump-start the moribund economy. The recent electoral victory for Abe could help to strengthen his hands to push through these measures. Who knows?


Chart 1: JPY-USD & USD-JPY's monthly chart from 1960 to Dec 12, 2014 (Source: fxtop.com)

Note:
In addition to the disclaimer in the preamble to my blog, I hereby confirm that I do not have any relevant interest in, or any interest in the acquisition or disposal of, JPY and/or USD.

Monday, December 15, 2014

MYR: Due for a rebound!

After a depreciation of 5-6% over the past 2 months, MYR is set to test its technical support. The SGD-MYR chart shows that the SGD is rising against the MYR in an upward channel. The recent weakness in MYR has pushed the SGD to the upper boundary of that channel. For political reason, I do not think it is acceptable for SGD to break above the level of RM2.70. I expect BNM to support the MYR in order to keep SGD-MYR within the upward channel (or not exceeding the 1 SGD = 2.70 MYR.


Chart 1: SGD-MYR's weekly chart as at Dec 15, 2014 (Source: XE Currency Converter)

Similarly, I do not expect MYR to recover lost ground against the THB. MYR is now hanging onto the support of 9400.


Chart 2: MYR-THB's weekly chart as at Dec 15, 2014 (Source: XE Currency Converter)

MYR has however strengthened against the JPY. That's because JPY has weakened substantially since August. Notwithstanding the extremely sharp drop in the value of JPY, it is good to note that MYR-JPY will be coming up against a strong resistance at 36 (or 1 MYR = 36 JPY). The weakness of the JPY will be covered in another article.


Chart 3: MYR-JPY's weekly chart as at Dec 15, 2014 (Source: XE Currency Converter)

All in all, I believe that our MYR is poised for a technical rebound. This could coincide with a temporary bottom for our market, which had been badly mauled over the past 2 months. Where will the bottom be? From the market action today, it seems likely that the 1700 psychological support may not hold. Let's hope that 1600 psychological level will stop the carnage!


Chart 4: FBMKLCI's weekly chart as at Dec 15, 2014 (Source: BTX)

Note: 

In addition to the disclaimer in the preamble to my blog, I hereby confirm that I do not have any relevant interest in, or any interest in the acquisition or disposal of, FBMKLCI, MYR, SGD, THB and/or JPY.

Wednesday, December 10, 2014

BJFood: Bottom-line soared due to one-time investment gain

Results Update

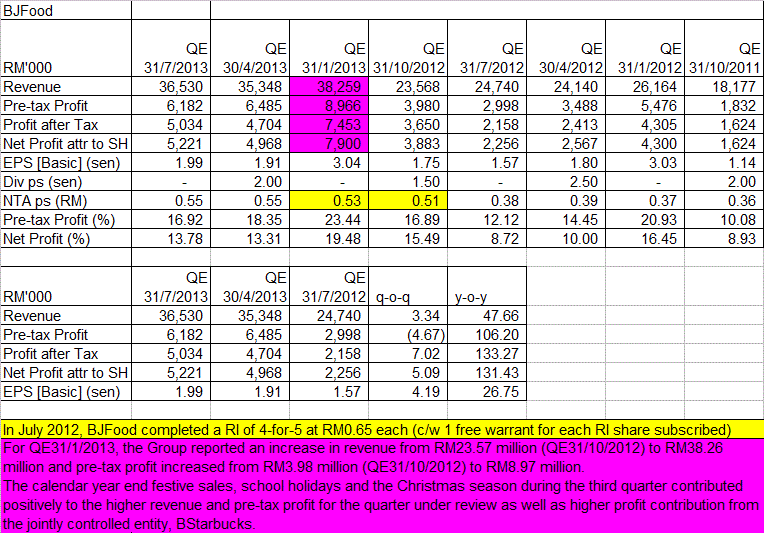
For QE31/10/2013 2014, BJFood's net profit increased increased by 26-fold q-o-q or 6-fold y-o-y to RM164 million due mainly to the recognition of the gain of RM158.6 million arising from re-measurement of the 50% equity interest in BStarbucks.

Excluding the one-time net gain of RM158.6 million, the current quarter pre-tax profit of RM6.70 million showed a y-o-y increase of RM1.64 million. The higher pre-tax profit was mainly due to the consolidation of the improved results of BStarbucks arising from more store openings and the contribution of the Brunei Starbucks operations. 

Revenue increased y-o-y due to the effect of consolidation of the newly acquired wholly-owned subsidiary, BStarbucks, as well as the contribution from the Starbucks operations in Brunei, which only commenced operation in February 2014.


Table: BJFood's last 8 quarterly results


Chart 1: BJFood's last 20 quarterly results (excluding the extraordinary gain of RM158.6 million recorded in QE31/10/2014)

Valuation

BJFood (closed at RM2.79 yesterday3) is now trading at a PE of 29 times (based on last 4 quarters' EPS of 9.6 sen, excluding the extraordinary gain of RM158.6 million). At this PE, BJFood is deemed fully valued.

Technical Outlook

BJFood is still in an uptrend line. Its immediate support is the horizontal line at RM2.60. If this support is broken, the stock's next support is at RM2.35.


Chart 3: BJFood's weekly chart as at Dec 9, 2014 (Source: Share Investor)

Conclusion

Based on good financial performance, BJFood is still a good stock to hold for long-term investment. However, it is immediate upside is likely to be limited as its valuation is fairly demanding.

Note:
In addition to the disclaimer in the preamble to my blog, I hereby confirm that I do not have any relevant interest in, or any interest in the acquisition or disposal of, BJFood.

SKPetro: A lot cheaper...

Results Update

For QE31/10/2014, SKPetro's net profit increased by 42% y-o-y to RM348 million while revenue increased marginally by 1% to RM2.41 billion. Compared to the immediate preceding quarter, QE31/7/2014, net profit dropped by 22% while revenue declined by 11%.


Table 1: SKPetro's last 8 quarterly results

The y-o-y improvement in bottom-line was attributed to higher contribution from the Drilling & Energy Services ("DES') segment, which experienced a 34%-increase in revenue. This increased revenue offset the drop in revenue from the Offshore Construction & Subsea Services ('OCSS') segment.

The q-o-q decline in bottom-line was attributed to drop in earning by all segments, especially the DES & OCSS segments. These 2 segments experienced lower revenue of 5% & 26%, respectively.


Table 1: SKPetro's segmental results


Chart 1: SKPetro's last 10 quarterly results

Financial Position

As at 31/10/2014, SKPetro's financial position is deemed acceptable, with adequate liquidity albeit slightly elevated leverage. Its current ratio stood at 1.2 times while gearing ratio stood at 1.9 times. Gearing ratio is defined as Total Liabilities over Total Equity. However, if you used Total Borrowings over Total Equity to calculate gearing ratio, then that number would be 1.4 times.

Valuation

SKPetro (closed at RM2.45 yesterday) is now trading at a trailing PE of 8.9 times (based on last 4 quarters' EPS of 27.4 sen). This low PE multiple seems to suggest that SKPetro's earning going forward would drop sharply in line with lower crude oil prices. If this negative scenario does not pan out, then the earning decline would be less and the share price could recover.

Technical Outlook

SKPetro broke its uptrend line at RM4.20 in September. At RM2.45, SKPetro is now trading near its initial quoted prices of RM2.20.


Chart 2: SKPetro's weekly chart as at Dec 9, 2014 (Source: Share Investors)
 
Conclusion

Based on good financial performance & attractive valuation, SKPetro is a good stock to consider for long-term investment, especially after its recent sharp selldown. However, the low prices may persist for a while due to poor technical outlook and depressed prices for crude oil.

Note:
In addition to the disclaimer in the preamble to my blog, I hereby confirm that I do not have any relevant interest in, or any interest in the acquisition or disposal of, SKPetro.