Thursday, May 14, 2015

TChong: Improved sequential earnings

Result Update

For QE31/3/2015, TChong's net profit soared 204% q-o-q to RM26 million while revenue rose 24% to RM1.569 billion. Compared to the same quarter last year, net profit was down 36% despite a 25%-rise in revenue.

Revenue rose q-o-q due 24.3%- increase in revenue from Vehicle Assembly, Mfg, Distribution & After-Sale Services Division. This was mainly due to higher sales volume arising  from  the  strong sales and marketing efforts. EBITDA rose 97.7% q-o-q due to realignment of sales strategy and promotional campaigns.

The Financial Services division enjoyed a 10.9%-increase in revenue to RM14.4 million while EBITDA rose from RM2.2 million to RM7.1 million. Other Operations division saw its revenue rose from RM3.5 million to RM4.1 million but its EBITDA dropped RM11.8 million to RM5.6 million as the preceding quarter's EBITDA was boosted by an one-off revaluation gain from investment properties.


Table: TChong's last 8 quarterly results


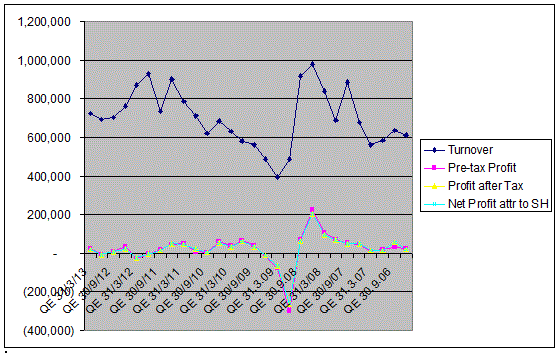
Chart 1: TChong's last 34 quarterly results

Valuation

TChong (closed at RM3.05 yesterday) is now trading at a PE of 22 times (based on last 4 quarters' EPS of 13.9 sen). At this PE multiple, TChong is deemed over valued.

Technical Outlook

TChong is in a long-term upward channel that started in 1999. However, it is trending down over the past 2 years after it tested the upper boundary of that channel. I am doubtful TChong will test the lower boundary at RM1.80-2.00. It has already showed signs of bottoming at around RM3.00. If this fails to hold up the stock, the next support will be the horizontal line at RM2.20.


Chart 2: TChong's weekly chart as at May 14, 2015-9.45am (Source: Tradesignum)

Conclusion

Despite the poor financial performance, demanding valuation & bearish technical outlook, TChong is a good stock for long-term investment. For now, it is worth close monitoring to ascertain whether the RM3.00 support is the base from which the stock would stage its recovery.

Note: 
In addition to the disclaimer in the preamble to my blog, I hereby confirm that I do not have any relevant interest in, or any interest in the acquisition or disposal of, TChong.

Wednesday, May 13, 2015

SCN: The Authacity of Hope

The unfortunate shareholders of Scan Associates Bhd ("SCN"), who have been suffering in silence for the past few years, were given a further beating when the share price dropped from RM0.13 to RM0.04 in the past few days. That's a long way down from the high of RM2.30 recorded in January 2007.


Chart 1: SCN's monthly chart as at May 12, 2015 (Source: ShareInvestor.com)   


Chart 2: SCN's daily chart as at May 12, 2015 (Source: ShareInvestor.com)   

However, this morning SCN rebounded on news report that the company is suing Bursa Malaysia for exercising its duty to classify the stock as a Guidance Note 3 (GN3) issue based rules 2.1(b) and (c) of GN3. Bursa made that decision by referring to SCN's fourth quarter results for 2014.

SCN's suit is probably based on two grounds. The first ground was that the "company has no means to make such announcement as the company Secretary had resigned on the same day." The announcement in question refers to the announcement that "company had triggered rules 2.1(b) and (c)  of GN 3 based on the company 's Q4 2014 results". The second ground is probably the interpretation of rules 2.1(b) and (c)  of GN 3. The good news for the shareholders of SCN is that their company was granted an ad interim injunction by the high court on May 11 to restrain Bursa Malaysia from implementing the classification of the company". That may explain why the share price is up today.

The first ground for the suit - my Company Secretary has left - should not be allowed to stand and be used as an excuse for all future failure to make announcement to the exchange. And with regards to the interpretation of the rules 2.1(b) and (c)  of GN 3 which supposedly state that "company's loss equals to or exceed the amount of shareholders' equity and the shareholders' equity is equal to or less than 50% of the issued and paid-up capital for one full financial year loss", my thoughts are as follows:

1) Rule 2.1 (c) requires that “the shareholders' equity is equal to or less than 50% of the issued and paid-up capital for one full financial year loss”. I feel that the phrase “for one full financial year loss” is not necessary as it is more a P&L item. Shareholders’ equity & issued/paid-up capital are Balance Sheet items. This criterion is met if the reduced shareholders’ equity is equal to or less than 50% of the share capital. For SCN, its shareholders’ equity of RM6.247 million as at 31/12/2014 is only 31% of its share capital of RM20.0 million.

2) Rule 2.1 (b) requires that the company's loss equals to or exceeds the amount of shareholders' equity. Now, I must admit I have not read this rule in full. I assume that it is stated correctly. What’s the meaning of loss? Is it accumulated losses or current year loss?

To get a correct interpretation of this rule, I racked through the internet and stumbled upon a Slideshare presentation by Ch’ng Boon Huat, the Head of Issuers Investigation & Surveillance dated July 10, 2009 (here). On slide #5, the prescribed criteria for classification under GN3 were shown. I believe that rules 2.1 (b) is “L1 > SE1”, which mean last year loss is equal to or more than shareholders’ equity "last year". SCN's last year loss of  RM7.1 million exceeded its shareholders’ equity "last year" of RM6.247 million. (Note: I've denoted "last year" shareholders' equity as such because the more accurate description should be shareholders' equity as at end of last year.)

This may be a contestable point. However, it is hard to convince the judge to compare the net loss for FY2014 with the shareholders' equity as at 31/12/2013. I am sure he/she would ask, Why are we comparing with numbers from different periods?


Diagram: GN3 Prescribed Criteria


Table 1: SCNs P&L account as at 31/12/2014 


Table 2: SCNs Balance Sheet as at 31/12/2014

Based on the above, I believe that SCN's suit against Bursa is a long shot. If you are stuck in this stock, you may want to take advantage of the current rebound to reduce your position.

Note:
In addition to the disclaimer in the preamble to my blog, I hereby confirm that I do not have any relevant interest in, or any interest in the acquisition or disposal of, SCN.

Petgas: Top-line & bottom-line dropped q-o-q

Results Update

For QE31/3/2015, Petgas's net profit increased by 8% y-o-y to RM450 million on the back of a 4%-increase in revenue. However, net profit dropped 21% q-o-q on the back of a 1%-decline in revenue.

Revenue dropped q-o-q due to lower gas transportation revenue as a result of lower capacity booking number of calender days. Bottom-line dropped q-o-q due to lower share of profits from JVs as a result of recognition of deferred tax assets by Kimanis Power SBarising from investment tax allowance granted by the Min. of Finance in the preceding quarter.


Table: Petgas's last 8 quarterly results

Looking at Chart 1, we can see that Petgas's top-line & bottom-line has been rising steadily over the past 8-9 years. At the same time, its profit margin has also been on a gradual uptrend.


Chart 1: Petgas's last 35 quarterly results

Valuation

Petgas (closed at RM22.20 yesterday) is now trading at a PE of 23x (based on last 4 quarters' EPS of 95 sen). Its dividend yield is fair attractive at 3.1%. At this PE multiple, Petgas is deemed fairly valued.

Technical Outlook

Petgas broke its intermediate uptrend line, SS at RM22.50 in August. Its found support at the horizontal line of RM21.00.


Chart 2: Petgas's monthly chart as at May 12, 2015 (Source: ShareInvestor.com)   


Chart 3: Petgas's monthly chart as at May 12, 2015 (Source: ShareInvestor.com) 

Conclusion

Based on satisfactory financial performance & reasonable valuation, I would maintain my rating for Petgas a HOLD.

Note: 
In addition to the disclaimer in the preamble to my blog, I hereby confirm that I do not have any relevant interest in, or any interest in the acquisition or disposal of, Petgas.

Tuesday, May 12, 2015

Market Outlook as at May 12, 2015

Today is not a good day for our market. FBMKLCI broke below the previously overcame downtrend line, RR as well as the psychological 1800 support. With these double whammy, FBMKLCI is poised to go lower, possibly testing the 1770-1780 level in the next few days. To avoid this downside trajectory, FBMKLCI must recover above the 1800 mark soon.


Chart 1: FBMKLCI's daily chart as at May 12, 2015_12.30am (Source: ShareInvestor.com)

Over the past few months, we have been adopted a constructive outlook towards the market after the recovery that began in early January. This tinted view of the market is partly a function of a financial market that is flushed with liquidity, courtesy of various central banks around the world that have to prop up their respective economy. The investors has been so accustomed to this condition, which is not unlike a frog who has gotten used to the lukewarm water in a slow boiling pot. Once in a while, we must look at the numbers and the charts to see exactly where we are.

If you look at the monthly chart for FBMKLCI, you will see that the 10-month SMA line has just cut below the 21-month SMA line. The MACD line has not to yet hooked up, let alone cut above the MACD Signal line. The -DI is still above the +DI and they have again started to diverge. In short, the negative technical outlook is slowly reasserting itself in the market.


Chart 2: FBMKLCI's monthly chart as at May 12, 2015_12.30am (Source: ShareInvestor.com)

The same reading is also present for FBM70.


Chart 3: FBM70s monthly chart as at May 12, 2015_12.30am (Source: ShareInvestor.com)

With the prevailing uncertain condition, we must reduce our trading activities in the market.

Petdag: Bottom-line recovered

Result Update

For QE31/3/2015, Petdag's net profit soared to RM206 million despite a sharp plunge in revenue to RM6.1 billion.
 
Revenue dropped y-o-y due to a 22%-drop in average selling price coupled with a 6%-drop in sales volume. Group operating profit increased y-o-y by RM58.3 million as a result of lower operating expenditure (dropped by RM64.8 million) and higher other  income (rose by RM19.9 million) which had more than offset by lower gross profit dropped by RM26.4 million).

Group operating profit increased q-o-q mainly due to higher gross profit (rose by RM156.8 million) coupled with lower operating expenditure (declined by RM100.1 million). Gross profit dropped in QE31/12/2014 mainly as a result of margin compression in line with the sharp decline in MOPS prices. In addition, operating expenditure, manpower expenses and marketing and promotions expenses were lower in the current quarter compared to the preceding quarter (QE31/12/2014). Higher operating expenditure in QE31/12/2014 was due to higher repair and maintenance activities at petrol stations and terminals.


Table: Petdag's last 8 quarterly results

 
Chart 1: Petdag's last 28 quarterly results

Valuation

Petdag (closed at RM21.64 yesterday) is now trading at a trailing PE of 39 times (based on last 4 quarters' EPS of 55.54 sen). Based on PE multiple, Petdag is overvalued.

Technical Outlook

Petdag tested its long-term uptrend line with support at RM16.00 in November 2014. From there, it staged a good rebound which sent the share price to a recent high of nearly RM23.00. I doubt Petdag is ready to charge through the horizontal resistance at RM23-24. (Note: I have revised the long-term uptrend line as drawn in my previous post.)


Chart 2: Petdag's monthly chart as at May 11, 2015 (Source: ShareInvestor.com)

Conclusion

Despite the improved financial performance & positive technical outlook, I still maintain my rating for Petdag as SELL or REDUCE due to demanding valuation. However, if the share prices were to ease back to the uptrend line (say, RM18), I think Petdag could be a BUY.

Note: 
In addition to the disclaimer in the preamble to my blog, I hereby confirm that I do not have any relevant interest in, or any interest in the acquisition or disposal of, Petdag.

Monday, May 11, 2015

WTIC & CRB: A pause in the recovery?!

WTIC broke below its medium-term uptrend line, SS at USD60 last Thursday. The MACD line is poised to cut below the MACD Signal line. If that were to happen, it would give a bearish signal. WTIC's immediate support is at the horizontal line USD54.00.


Chart 1: WTIC's daily chart as at May 8, 2015 (Powered by Stockcharts.com)

We were a bit early to cheer the recovery for CRB. It has dropped back below the horizontal line 230. However, it is able to stay above the medium-term uptrend line, SS at 227.


Chart 2: CRB's daily chart as at May 8, 2015 (Powered by Stockcharts.com)

Based on the tentative negative signal from WTIC, we can expect weakness for Oil & Gas stocks for the next few days.

Friday, May 08, 2015

Masteel: Support found!

Masteel, which tumbled badly after the delay in the release of its annual report, seems to have found support at the RM0.60 mark. Ahead of the upcoming weekend, Masteel is gaining ground. As at 3.50pm, it is up 4 sen at RM0.625.

Based on the trading activities today, I think the selling pressure has been exhausted and the buying is present. If you are stuck in this stock, it is time to breath easy. For those looking to get into the stock, go slow - make that very slow! - and aim low. Try around RM0.60.


Chart 2: Masteel's 60-min chart as at May 8, 2015_3.30pm (Source: ShareInvestor.com)

Note: 
In addition to the disclaimer in the preamble to my blog, I hereby confirm that I do not have any relevant interest in, or any interest in the acquisition or disposal of, Masteel.

Tomypak: Upside breakout!

Tomypak broke to the upside of the line connecting the peaks in 2010 & 2013 (see Chart 1). That line should act as a resistance at RM1.55 is now a support. Tomypak may charge all the way to test its 1997 high of RM1.85 (maybe more). See Chart 2.


Chart 1: Tomypak's 5-year monthly chart as at May 8, 2015_3.25pm (Source: ShareInvestor.com)


Chart 2: Tomypak's 20-year monthly chart as at May 8, 2015_3.25pm (Source: ShareInvestor.com)

Based on technical breakout, Tomypak could be a trading BUY.

Note: 
In addition to the disclaimer in the preamble to my blog, I hereby confirm that I do not have any relevant interest in, or any interest in the acquisition or disposal of, Tomypak.

Alibaba: Recovery beckons

Alibaba (Code: BABA) was the largest global IPO for 2014. Listed at USD68 a piece, Alibaba quickly zoomed up to USD120 in November. From that high perch, the share started to decline. It made an intraday low of just under USD78 on May 5. Yesterday, it announced a set of results that beat the street expectation (48 cents vs. 43 cents) as well as the appointment of a new CEO.

Investors reacted positively- chasing the share price higher to close at USD86 (from previous day close of USD80). Technically, Alibaba has broken above its intermediate downtrend line, RR at USD85. Its immediate resistance is the horizontal line at USD87.50. If it can stay above the downtrend line, SS and charge through the USD87.50 resistance, Alibaba's recovery may begin.


Chart: Alibaba's daily chart as at May 7, 2015 (Source: Stockcharts.com)

Note: 
In addition to the disclaimer in the preamble to my blog, I hereby confirm that I do not have any relevant interest in, or any interest in the acquisition or disposal of, Alibaba.

SSteel: It's darkest before dawn?

Result Update

For QE31/3/2015, SSteel's LBT declined 43% q-o-q from RM68 million to RM39 million due to improved margins from higher selling prices. Its revenue rose 7% q-o-q to RM675 million. Despite incurring substantial losses for the past 3 quarters, the company is sounding optimistic. It expects that its "operating results to improve in the fourth quarter of the financial year ending 30 June 2015".
 

Table: SSteel's last 8 quarterly results


Chart 1: SSteel's last 36 quarterly results

Valuation

SSteel (closed at RM0.97 yesterday) is now trading at a Price to Book of 0.45 times (based on its NTA of RM2.16 as at 31/3/2015). We are unable to compute SSteel's PE multiple since it has incurred a net loss of RM103 million or LPS of 24.6 sen. Based on PB of 0.45 times, I believe the downside for SSteel is limited.

Technical Outlook

SSteel is in a downward channel, RR-SS since 2010. The lower line, acting as support, could hold up the stock at around RM0.90.


Chart 2: SSteel's monthly chart as at May 7, 2015 (Source: ShareInvestor.com)

Looking at the 20-year monthly chart, we can see that SSteel has been trading in a range between RM1.00 & RM2.00 for the past 15 years (except for a brief breakout in 2008) . In a worst case scenario, it may go as low as RM0.80 (recorded in 2001) before recovering.


Chart 3: SSteel's monthly chart as at May 6, 2015 (Source: ShareInvestor.com)

Conclusion

Based on technical support & asset-backing, SSteel could be a good long-term investment at the current price of around RM0.90-1.00. Its financial performance could take a while to recover due to dumping activities by Chinese steel producers.

Note: 
In addition to the disclaimer in the preamble to my blog, I hereby confirm that I do not have any relevant interest in, or any interest in the acquisition or disposal of, SSteel.

MBSB: Top-line & bottom-line seesawed

Result Update

For QE31/3/2015, MBSB's net profit ('NP') dropped by 68% q-o-q or 37% y-o-y to RM124 million while revenue rose by 16% q-o-q or 4% y-o-y to RM691 million.  Pre-tax profit ('PBT') rose 81% q-o-q but dropped 41% y-o-y to RM158 million. PBT improved q-o-q due to higher operating income. NP declined when compared to the immediate preceding quarter (QE31/12/2014) as the later quarter earning was bumped up by the recognition of deferred tax in relation to origination & reversal of temporary differences.

Compared to the previous 4-quarter, the last 4-quarter revenue was down marginally by 0.4% while PBT was off by 14%. NP rose by a whopping 50% mainly due to the recognition of deferred tax in relation to origination & reversal of temporary differences. If these items were excluded, NP would be lower by 8%.


Table: MBSB's last 8 quarterly results

A closer look at the chart below reveals that MBSB's revenue has probably peaked while its 4-Q average PBT margin has begun to decline. In the current economic environment- with weaker consumer confidence & rising funding costs- it is likely that MBSB will face even more challenges in keeping its earning at the present level, let alone growing its earning going forward.


Chart 1: MBSB's last 43 quarterly results

Valuation

MBSB (at RM2.03 yesterday) is now trading at a current PE of 5.8 times (based on the annualized EPS of 35 sen). However, the last 4 quarters' EPS was boosted by a one-off deferred tax recognition of RM366 million. If this one-off item is excluded, the 4 quarters' EPS would be lowered to 21 sen and PE would increase to 9.6 times. Given an option; would you invest in a finance company trading at a PE of 10 times or would you rather pay a bit more and invest in Maybank at a PE of 12 times?

MBSB has an attractive DY of 6.0%. That nearly matches Maybank's DY of 6.2% or AFG's DY of 6.2%. However, AFG paid a special dividend of 10.5 sen which bumped up its DY last year. If this special dividend is excluded, AFG's DY would be 4%.

Technical Outlook

In the last post, I have commented that MBSB could have made a double top reversal at RM2.60. If it slid further (say below RM2.00), the stock could be entering into a downtrend. That comment is still valid.

 
Chart 2: MBSB's monthly chart as at May 7, 2015_3.30pm (Source: ShareInvestor.com)

Conclusion

Based on poorer financial performance and tougher operating environment, I believe it is advisable to reduce our position in MBSB. However, it must be noted that its valuation is not excessive and its technical outlook is neutral, albeit hanging precarious at the RM2.00 mark.

Note: 
In addition to the disclaimer in the preamble to my blog, I hereby confirm that I do not have any relevant interest in, or any interest in the acquisition or disposal of, MBSB.

Thursday, May 07, 2015

PMetal: Top-line & bottom-line inched higher!

Results Update

For QE31/3/2015, PMetal's net profit rose by 3% q-o-q or 54% y-o-y to RM43.1 million while revenue dropped 7% q-o-q but rose 18% y-o-y to RM1.06 billion. Its PBT rose q-o-q from RM60.8 mil to RM70.2 mil accounting for unrealised forex losses of RM97.0 mil & RM80.9 mil respectively. If forex losses are excluded, PBT would be adjusted to RM167.2 mil & RM141.7 mil for QE31/3/2015 & 31/12/2014 respectively.


Table 1: PMetal's last 8 quarterly results


Chart 1: PMetal's 30 quarterly results

Aluminium Outlook


Aluminium is still trading sideways at around USD1800/MT.


Chart 2: Aluminium's monthly chart as at May 6, 2015 (Source: LME) 

Valuation

PMetal (closed at RM2.85 yesterday) is now trading at a PER of 13 times (based on last 4 quarters' EPS of 22 sen). At this PER, PMetal is deemed fairly valued.

Technical Outlook

PMetal broke above the line connecting its 2007 & 2011 peaks at RM1.70-1.75 in early 2014. It rose to a high of RM3.66 in September 2014. During the market selldown in December last year, the share price dropped back to RM2.20 before recovering.

PMetal's monthly MACD is about to crossover its MACD signal line. The last 2 times that these happened (early 2008 & middle of 2011), the share price dropped sharply. These sell signals coincided with the share price dropping below the 10-month EMA line. Currently, PMetal is resting on its 10-month EMA line at RM2.80. Thus, PMetal could enter into a downtrend if the share price goes below RM2.80 and the MACD flashes signal line crossover.


Chart 3: PMetal's monthly chart as at May 6, 2015 (Source: ShareInvestor.com)

Conclusion

Based on satisfactory financial performance (albeit large unrealized forex losses) & reasonable valuation, PMetal is considered a good stock for medium-term investment. However, we have to be careful that the share prices remain above RM2.80. A drop below that level could signal the start of a downtrend for the stock.

Note:
In addition to the disclaimer in the preamble to my blog, I hereby confirm that I do not have any relevant interest in, or any interest in the acquisition or disposal of, Pmetal.

Wednesday, May 06, 2015

Commodiities: Uptrend Starting...

In the middle of April, I posted that crude oil has made a bottom and poised to recover. I used Wyckoff Schematic to analyze the bottom for crude oil (or, more specifically WTIC). If we can do the same for CRB, we can see that the CRB has also formed a bottom and is poised to recover. CRB is made up of 19 commodities that are traded on NYMEX, CBOT, LME, CME & COMEX. For more, go here.

Based on this bullish breakout, it maybe a good time to look at commodities complex again.


Chart: WTIC CRB's weekly chart as at Apr 16, 2015 (Powered by Stockcharts.com)

Oil & Gas: Let the Recovery Begins...

WTIC broke above USD60 yesterday. This signaled the beginning of the recovery for crude oil prices.


Chart 1: WTIC's monthly chart as at May 5, 2015 (Source: investorshub.advfn.com)

I have appended below the 5 stocks that have been recommended as a BUY by both CIMB and Maybank. Out of these 5 stocks, my picks are listed below with their respective entry levels:
1) Perdana (RM1.30)
2) Armada (RM1.20)
3) Dialog (RM1.55)
4) SKPetro (RM2.70)

Chart 2: Perdana's weekly chart as at May 6, 2015_4.15pm (Source: ShareInvestor.com)


Chart 3: Armada's weekly chart as at May 6, 2015_4.15pm (Source: ShareInvestor.com)


Chart 4: Dialog's weekly chart as at May 6, 2015_4.15pm (Source: ShareInvestor.com)


Chart 5: SKPetro's weekly chart as at May 6, 2015_4.15pm (Source: ShareInvestor.com)


Chart 6: UMWOG's weekly chart as at May 6, 2015_4.15pm (Source: ShareInvestor.com)

Note: 
In addition to the disclaimer in the preamble to my blog, I hereby confirm that I do not have any relevant interest in, or any interest in the acquisition or disposal of, Perdana, Armada, Dialog, SKPetro & UMWOG.

Market Outlook as at May 6, 2015

 FBMKLCI has convincingly broken below its intermediate uptrend line, SS at 1820 this morning (see Chart 1). The next support would be the horizontal line at 1805 (not far from the psychological 1800 mark) as well as the overcome downtrend line, RR.


Chart 1: FBMKLCI's daily chart as at May 6, 2015_9.30am (Source: ShareInvestor.com)

We see the same breakout in FBMEMAS, which broke its intermediate uptrend line, SS at 12600 last Friday (see Chart 2). 


 Chart 2: FBMEMAS's daily chart as at May 6, 2015_9.30am (Source: ShareInvestor.com)

Over the past  1-2 weeks, we have seen Mumbai's BSE & Shanghai's SSEC breaking their respective uptrend lines. This development could herald a temporary pause in the rally for many Asian markets for the next few weeks.


Chart 3: BSE's daily chart as at May 5, 2015 (Source: Stockcharts.com)

 
Chart 4: SSEC's daily chart as at May 5, 2015 (Source: Stockcharts.com) 

Is this simply the operation of the old maxim, Sell in May and Go Away? Or, is it something more dangerous, possibly the end of the 6-years bull run? Until the dusk has settled, we should exercise careful discretion in our trading activities.

F&N: Earnings improved despite lower revenue

Result Update

For QE31/3/2015, F&N's net profit rose marginally by 1% q-o-q or 4% y-o-y to RM70 million while revenue was mixed- down 9% q-o-q but rose less than 1% y-o-y to RM940 million.

Revenue was lower q-o-q due to the pre-GST de-stocking by its distributors and retailers, which impacted both Soft Drinks and Dairies Malaysia. Its profit before tax however, increased by 6.5% to RM86.6 million, with Dairies Thailand recording a significant improvement in operating profit mainly due to lower trade discounting and  improved  milk-based  commodity  cost. Soft Drinks’s  operating  margin  improved by 2.0% mainly due to the reversal of provision of impairment of property, plant and equipment associated with the floods in the East Coast States on near finalisation of repairs of  affected assets and the absence of impairment of  receivables. Excluding the effects of certain one-off  income in the current quarter, Dairies Malaysia’s operating profit was in line with the lower revenue.


Table: F&N's last 8 quarterly results


Chart 1: F&N's last 34 quarterly results

Recent Business Development

In March, F&N announced that it has lost the distributorship for Red Bull energy drinks in Malaysia. This distributorship - expired at end March - will continue during the transition period up to end September 1995.

According to a recent CIMB's report, Red Bull accounts for 5% of F&N's revenue (or RM200 million) and 5% of F&N's net profit. Although the loss of the contract would hit F&N's bottom-line temporarily, CIMB expects F&N to recover quickly based on its experience after the termination of the Coca-Cola contract in 2011. 

Valuation

F&N (closed at RM18.54 yesterday) is now trading at a PE of 26 times (based on last 4 quarters' EPS of 72 sen). At this PE multiple, F&N is deemed fully valued.

Technical Outlook

F&N has been range-bound for the past 4 years between RM15.50 and RM19.00.A breakout of this trading range would determine the direction of the price movement going forward.


Chart 2: F&N's daily chart as at May 5, 2015 (Source: ShareInvestor.com)

Conclusion

Based on satisfactory financial performance and strong management, F&N remained a good stock for long-term investment. However, F&N's demanding valuation and neutral technical outlook would argue against a BUY at current level. It deserves at best a HOLD rating.

Note: 
In addition to the disclaimer in the preamble to my blog, I hereby confirm that I do not have any relevant interest in, or any interest in the acquisition or disposal of, F&N.

Harta: Earnings rose higher sales volume & stronger USD

Result Update

For QE31/3/2015, Harta's net profit rose 11% q-o-q or 12% y-o-y to RM55 million while revenue gained 7% q-o-q or 9% y-o-y to RM305 million. Revenue increased q-o-q due to the strengthening of the USD and increase on sales volume. Bottom-line improved due to lower operating profit margin - dropped from 24.9% to 22.2% - basically due to increase in maintenance and packaging material costs.


Table: Harta's last 8 quarterly results

From Chart 1 below, we can see that the profit margin has been sliding since 2010. Revenue has finally begun to rise again after a pause of 5 quarters. The increased revenue was able to arrest the drop in profit margin and this stopped the slide in the bottom-line.


Chart 1: Harta's last 30 quarterly results

Valuation

Harta (closed at RM8.22 yesterday) is trading at a PE of 30 times (based on last 4 quarters' EPS of 27.27 sen). At this PE multiple, Harta is deemed over-valued.

Technical Outlook

Harta is in a long-term uptrend over the past 6 years. It may have made a temporary top at RM8.50 and could correct back to find support at the psychological RM8.00 mark or the horizontal support at RM7.50 (which coincides with the 10-month SMA line).


Chart 2: Harta's daily chart as at May 5, 2015 (Source: Share Investor)

Conclusion

Based on lack of growth in its earnings, demanding valuation & mildly negative technical outlook, I would maintain my rating for Harta as a SELL INTO STRENGTH.

Note: 
In addition to the disclaimer in the preamble to my blog, I hereby confirm that I do not have any relevant interest in, or any interest in the acquisition or disposal of, Harta.