Monday, August 08, 2016

Unisem: Earnings Improved

Results Update

For QE30/6/2016, Unisem's net profit increased 8% q-o-q or 20% y-o-y to RM38 million while revenue was up a minuscule 1% q-o-q or 7% y-o-y to RM321 million. The profit before tax increased q-o-q primarily due to the higher gain on foreign exchange. Revenue increased y-o-y mainly due to improved average selling prices arising from the appreciation of US$/RM and US$/RMB exchange rates. PBT rose y-o-y due to increased revenue and improved margins from better contribution in its wafer bumping and advanced package operations.  


Table: Unisem's last 8 quarterly results


Chart 3: Unisem's last 47 quarterly results

Valuation

Unisem (closed at RM2.55 last Friday) is now trading at a PE of 11 times (based on last 4 quarters' EPS of 23.59 sen). At this multiple, Unisem - a cyclical stock - is deemed fairly valued. 

Technical Outlook

Unisem broke above the intermediate downtrend line, AB at RM2.46 in early July. It rallied to a high of RM2.79 in the past 2 week. Last Friday, it announced its latest results, which is quite good but its share price tumbled. It closed below the April 2015 high of RM2.65. This could lead to further correction in the days ahead. The immediate support is at RM2.45-2.50.

 
Chart 2: Unisem's weekly chart as at Aug 5, 2016 (Source: ShareInvestor.com)

If the share price can remain above RM2.45, Unisem's breakout may lead to its next upleg.

 
Chart 3: Unisem's monthly chart as at Aug 5, 2016 (Source: ShareInvestor.com)

Conclusion

Based on good financial performance fairly and attractive valuation, Unisem remains a good stock for medium-term investment. Its sudden price correction heralds uncertainty in the near term.

Note:

I hereby confirm that I do not have any direct interest in the security or securities mentioned in this post. However, I could have an indirect interest in the security or securities mentioned as some of my clients may have an interest in the acquisition or disposal of the aforementioned security or securities. As investor, you should fully research any security before making an investment decision.

F&N: Strong Earnings

Result Update

For QE30/6/2016, F&N's net profit rose 3.3% q-o-q or 12.8% y-o-y to RM93 million while revenue increased by 9.7% q-o-q or 1.8% y-o-y to RM1.10 billion. Revenue rose q-o-q due to increased revenue in F&B Malaysia of RM57.2 million & F&B Thailand of RM39.0 million. F&B Malaysia's revenue rose due to effective festival sell-in (supported by consumer-driven packaging formats);  favorable product portfolio mix and higher sell-in in June (brought on by earlier Hari Raya). Nevertheless, F&B Malaysia's operating  profit dropped from RM64.3 million to RM62.6 million mainly due to higher advertising and promotions expenditure and accrual for staff costs. F&B Thailand revenue increased due to its anniversary campaign. This helped to boost its operating profit from RM41.2 million to RM52.8 million. The higher operating profit led to higher pre-tax profit. (Note: F&N's result for QE30/6/2016 was announced on August 2, 2016.)


Table: F&N's last 8 quarterly results


Chart 1: F&N's last 39 quarterly results

Valuation

F&N (closed at RM24.50 last Friday) is now trading at a PE of 23 times (based on last 4 quarters' EPS of 107.10 sen). At this PE multiple, F&N is deemed fairly valued.

Technical Outlook

F&N broke out of its 5-year trading range between RM16.00 and RM19.00 in February this year.This brought on a sharp rally to RM27.00. Its current correction could lead to a prolonged sideways trading- possibly around RM24.00.


Chart 2: F&N's weekly chart as at Aug 5, 2016 (Source: ShareInvestor.com)


Chart 3: F&N's monthly chart as at Aug 5, 2016 (Source: ShareInvestor.com)

Conclusion

Based on good financial performance, fair valuation and good prospect in near term, F&N remains a good stock for long-term investment.

Note:
I hereby confirm that I do not have any direct interest in the security or securities mentioned in this post.
However, I could have an indirect interest in the security or securities mentioned as some of my clients may have an interest in the acquisition or disposal of the aforementioned security or securities. As investor, you should fully research any security before making an investment decision.

Penta: Earnings Rose Sharply

Results Update

For QE30/6/2016, Penta's net profit increased by 110% q-o-q or 105% y-o-y to RM6.7 million while revenue dropped by 36% q-o-q or 61% y-o-y to RM39 million. Revenue increased q-o-q mainly due to increase in sales contribution from both automated equipment operating segment and smart control solution system segment which was partially offset by the lower revenue from automated manufacturing solution operating segment. Due to the higher revenue achieved and better product mix secured, profit before tax rose 102% q-o-q to RM8.6 million.
  

Table: Penta's last 14 quarterly results

Penta's quarterly revenue made new high. This also pushed its quarterly earnings to new high.

 
Chart 1: Penta's last 14 quarterly results 

Valuation

Penta (closed at RM1.00 last Friday) is now trading at a PER of 8.3 times (based on last 4 quarters' EPS of 12.1 sen). Based on strong growth of 84% last year, Penta's trailing PER of less than 10 times would make the stock looks fairly attractive.

Technical Outlook

Penta surpassed its 2015 high of RM0.92. It could continue in its uptrend and test the next resistance from the horizontal line at RM1.45.


Chart 2: Penta's weekly chart as at August 5, 2016 (Source: ShareInvestor)


Chart 3: Penta's monthly chart as at August 5, 2016 (Source: ShareInvestor)

Conclusion

Based on good financial performance, attractive valuation and positive technical outlook, Penta is a good stock for long-term investment. I revised my rating from SELLING INTO STRENGTH to BUY.

Note:

I hereby confirm that I do not have any direct interest in the security or securities mentioned in this post. However, I could have an indirect interest in the security or securities mentioned as some of my clients may have an interest in the acquisition or disposal of the aforementioned security or securities. As investor, you should fully research any security before making an investment decision.

Friday, August 05, 2016

MFCB: Time to Lift-off?

On June 2, I recommended a BUY on MFCB in view of its good financial performance and attractive valuation. For more, go here.

Today, I like to reiterate my BUY call on this stock. The reason is that MFCB has now broken above the “horizontal line” that capped its earlier upside rally (following the breakout of the downtrend as noted on June 2). The current breakout is the flag-off for the upleg to come. 

Chart 1: MFCB's daily chart as at Aug 5, 2016_12.30pm (Source: Kentrade)

In addition, MFCB has a warrant, MFCB-WA. Today we saw this warrant has also experienced a bullish technical breakout at RM0.48. 

Chart 2: MFCB-WA's daily chart as at Aug 5, 2016_12.30pm (Source: Kentrade)

MFCB is now trading at RM1.99-2.00. I prefer the stock to the warrant, which is trading at RM0.53-0.545. 

Note:

I hereby confirm that I do not have any direct interest in the security or securities mentioned in this post. However, I could have an indirect interest in the security or securities mentioned as some of my clients may have an interest in the acquisition or disposal of the aforementioned security or securities. As investor, you should fully research any security before making an investment decision.

Thursday, July 28, 2016

Vitrox: Making New High on Thin Volume

Technical Outlook

On thin volume (143,000 shares), Vitrox broke above its horizontal resistance of RM3.80 yesterday. Despite the thin volume, the share price continues to rise today. As at 3.45pm, it is trading at RM3.95 on volume of only 30,000 shares.

 
Chart 1: Vitrox's weekly chart as at July 28, 2016_2.45pm (Source: Kenanga BTX/Chartnexus)


Chart 2: Vitrox's monthly chart as at July 28, 2016_2.45pm(Source: Tradesignum)

Recent Financial Results

For QE31/3/2016, Vitrox's net profit increased by 67% q-o-q & y-o-y to RM15.6 million while revenue increased by 17% q-o-q or 68% y-o-y to RM56 million. PAT increased due to tax credit of RM4.6 million which was the result of 2 subsidiaries obtaining pioneer status for their products, namely embedded high density electronic modules (1/1/2013-31/12/2017) and embedded  intelligent  robotic  inspection system and machine with M2M connectivity and predictive analytic capability for semiconductor and electronics industries (17/6/2015-16/6/2020).


Table: Vitrox's last 8 quarterly results


Chart 3: Vitrox's last 34 quarterly results

Valuation

Vitrox (closed at RM3.95 at the time of writing) is now trading at a PE of 18.2 times (based on last 4 quarters' EPS of 21.71 sen). At this PER, Vitrox is deemed fully valued.

Conclusion

Based on improving financial performance & bullish technical outlook, Vitrox could be a good trading BUY. As always, you should exercise careful discretion as the stock is at its all-time high.

 Note: 
In addition to the disclaimer in the preamble to my blog, I hereby confirm that I do not have any relevant interest in, or any interest in the acquisition or disposal of, Vitrox.

Genting: A Double Whammy!!

Last night, a tour bus crashed down Genting, killing the driver and injuring 15 Chinese tourists (here). This morning, when investors saw the sharp drop in Genting share price, they would think it was an over-reaction. After all, the last 3 bus crashes (in 2010, 2011 & 2012) did not cause a sharp price drop.

What could be the real cause of Genting selldown is the failure of the drug, TauRx to pass the Alzheimer's disease trial (here). Genting has a 21%-stake in the company that owns the drug which was undertaking tests to meet US FDA requirement. If the drug had passed the test, it was reported that it could add more than RM2.00 to Genting share price. With the failure of the recent test, some of the recent price gain will be given back. How much will that be is the big question!


Chart 1: Genting's weekly chart as at July 28, 2016_11.00am (Source: Kenanga BTX/Chartnexus) (Note: Bus crashes in 2010, 2011 & 2013 were noted down in blue vertical lines)


Chart 2: Genting's daily chart as at July 28, 2016_11.00am (Source: Kenanga BTX/Chartnexus) 

Genting's immediate support will come from the horizontal line at RM8.20 and below that the psychological RM8.00 mark (which is very near the intermediate uptrend line, SS).

Based on the proximity of technical support, I feel that Genting is a HOLD for those having the stock. For those seeking to jump in, you can look at the RM8.00-8.20 level.

Note:
In addition to the disclaimer in the preamble to my blog, I hereby confirm that I do not have any relevant interest in, or any interest in the acquisition or disposal of, Genting.

Takaful: Earnings Dipped Sequentially

Results Update

For QE30/6/2016, Takaful's net profit dropped by 2% q-o-q to RM46 million on the back of a 27%-drop in revenue to RM462 million. Comapred to same quarter last year, revenue increased by 7%  while net profit rose by 17%. Revenue increased y-o-y mainly attributable to higher sales generated by Family & General Takaful business. Family Takaful business rose from RM287.3 million to RM310.9 million, due to higher sales of Family Takaful Group Medical & Family Takaful mortgage-related products. General Takaful revenue rose marginally from RM112.6 million to RM119.4 million due to higher business from Fire and commercial classes. Its profit before zakat and taxation rose y-o-y mainly due to higher wakalah fee income.


Table: Takaful's last 8 quarters' results

From the Chart 1 below, we can see that the revenue is on the uptrend. Earnings continues to rise gradually while profit margins have stagnated of late.


Chart 1: Takaful's last 41 quarters' results

Valuation

Takaful (closed at RM4.00 yesterday) is now trading at a PE of 20 times (based on the last 4 quarters' EPS of 19.93 sen). At this PER, Takaful is deemed fully valued.

Technical Outlook

The stock has been in an uptrend in the past 5 years. The stock is showing a bit of weakness, with the MACD crossing below the MACD signal line. In addition, the Bollinger Bands are beginning to constrict. These mean that the share price may dip below the RM4.00. If that were to happen, one can only hope that the Bollinger middle band will once again provide support for the stock (at RM3.50) - like it did in late 2014.


Chart 2: Takaful's monthly chart as at Jul 27, 2016 (Source: ShareInvestor)


Chart 3: Takaful's weekly chart as at Jul 27, 2016 (Source: ShareInvestor)

Conclusion

Despite high valuation & cloudy technical outlook, BIMB is still rated a HOLD based on its steady financial performance & its strong position in the takaful insurance business.

Note:
In addition to the disclaimer in the preamble to my blog, I hereby confirm that I do not have any relevant interest in, or any interest in the acquisition or disposal of, Takaful.

Wednesday, July 27, 2016

Gtronic: Earnings Stabilized

Result Update

For QE30/6/2016, Gtronic's net profit increased by 77% q-o-q to RM6.5 million while revenue was dropped 2% q-o-q to RM57 million. Compared to the same quarter last year, net profit dropped 64% while revenue was down by 36%.

Revenue dropped q-o-q due to the continuous softer volume loading from some of the Group's customer as a result of reduction in end customers' demand. Net profit rose q-o-q mainly due to cost control program carried out in the Group and forex gain (net) recognized (RM341K) compared to forex loss incurred in the preceding quarter.

Table 1: Gtronic's last 8 quarterly results


Chart 1: Gtronic's last 38 quarterly results
  
Valuation 

Gtronic (closed at RM3.27 yesterday) is now trading at a PE of 20 times (based on last 4 quarters' EPS of 16.49 sen). At that PER, Gtronic is deemed fully valued.

Technical Outlook

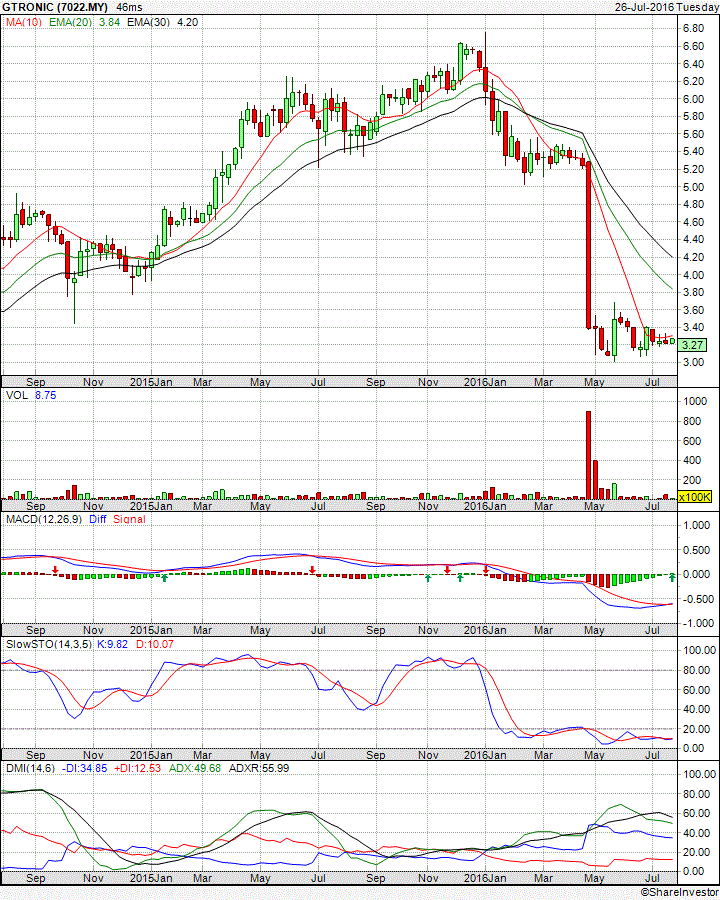
Due to sharp drop in earning, Gtronic share price plunged in April to the level of the 2004 high of around RM3.00.


Chart 2: Gtronic's monthly chart as at July 26, 2016 (Source: ShareInvestor.com)

Gtronic may have found a base for the share price to consolidate. ADXR has eased back to indicate a lessening of the downtrend momentum. MACD has also flashed a bullish crossover. Nonetheless, it is still too early to be overly bullish on this stock,


  Chart 3: Gtronic's weekly chart as at July 26, 2016 (Source: ShareInvestor.com)

Conclusion

Based on earning stabilization & possible base formed for the share price, Gtronicis now rated a HOLD. I would like to see a rebound in revenue & continued improvement in earning before calling a BUY on the stock.

Note: 
In addition to the disclaimer in the preamble to my blog, I hereby confirm that I do not have any relevant interest in, or any interest in the acquisition or disposal of, Gtronic.

BAT: Earnings Plummeted

Result Update
For QE30/6/2016, BAT's net profit dropped by 72% q-o-q or 78% y-o-y to RM48 million while revenue dropped by 6% q-o-q or 12% y-o-y to RM963 million. This is the first time since 2011 that BAT's quarterly revenue had dropped below the RM1 billion mark!

The drop in revenue was due to the following:
  • Group’s Domestic and Duty Free recorded a q-o-q decline of 9.1% due to the continued impact of the November 2015 excise led price increase as well as reduced consumption during the fasting month
  • Contract Manufacturing volumes declined 11.1% q-o-q
The weak volume performance coupled with inflationary increases in costs and timing differences in expenditures, caused the revenue and gross profit to decline q-o-q by 5.7% and 8.1% respectively.

During the same period, the Group has made a provision for restructuring expenses of RM86 million in relation to the winding down of its factory operations. As a result, Profit from Operations declined 49.6% q-o-q to RM117million. Excluding the impact of one-off restructuring expenses above mentioned, Profit from Operations registered a decline of 13.1% (or, RM31 million) versus the first quarter of 2016.

Net profit dropped by 72.7% q-o-q due to higher effective tax rate of 36% (as compared to 25% previously) as restructuring expenses in relation to the cessation of factory operations were non-deductible.


Table 1: BAT's last 8 quarterly results


Chart 1: BAT's last 38 quarterly results

Below, I tabulated BAT's last 8 quarters' P&L after excluding the restructuring expenses of RM86 million. While the drop in warnings is still bad, it was not so disastrous. Net profit would be lowered by 12% q-o-q or 29% y-o-y to RM152 million. EPS would improve from 236.sen to 273 sen.


Table 2: BAT's last 8 quarterly results (Restructuring expenses in QE30/6/2016 excluded)


Chart 2: BAT's last 38 quarterly results (Restructuring expenses in QE30/6/2016 excluded)
  
Valuation

BAT (closed at RM56.00yesterday) is now trading at an adjusted PE of 20.5 times (based on the last 4 quarters' adjusted EPS of 273 sen). However, this adjusted EPS of 273 sen may not be the earning going forward. If the earning going forward is similar to QE30/6/2016, then full-year EPS would be 214 sen. Thus forward PER would be 26 times. Compare this with HEIM & Carlsbg's PER of 21 times & 19 times respectively, BAT appears more expensive.

In addition, BAT has paid out a quarterly dividend of 78 sen; thus giving a Dividend Yield of 5.6%. The dividend payment has declined in line with lower earning to 55 sen last quarter and 45 sen in the latest quarter. Assuming the dividend payment stabilized ta 45 sen a quarter, its DY would be 3.2%. Again, this compared less favorably to HEIM & Carlsbg's DY of 4.6% & 5.2% respectively.

Technical Outlook

BAT peaked at RM74 in 2014. Its steady decline over the past 2 years picked up momentum due to poor financial performance after the sharp rise in excise duties on cigarettes in 2015. The drop was so severe that the share price went thru the long-term uptrend line support at RM50-51.00 mark.


Chart 3: BAT's monthly chart as at July 26, 2016 (Source: ShareInvestor)

BAT has since rebounded but its upside is capped by the intermediate downtrend line at RM56.00.


Chart 4: BAT's weekly chart as at July 26, 2016 (Source: ShareInvestor)

Conclusion

Based on the poorer financial performance, unattractive valuation & bearish technical outlook, BAT is rated a SELL. If you want to be invested in beer & cigarette stocks, my preference is for Carlsbg.

Note: 
In addition to the disclaimer in the preamble to my blog, I hereby confirm that I do not have any relevant interest in, or any interest in the acquisition or disposal of, BAT.

Monday, July 25, 2016

Alibaba: Poised for Uptrend?

Alibaba is a Chinese e-commerce company that provides consumer-to-consumer, business-to-consumer and business-to-business sales services via web portals (as per Wikipedia). Alibaba is listed on the New York Stock Exchange under the stock code "BABA".

In May last year, I posted about a possible recovery for Alibaba when the share price broke above its downtrend line. After a brief rally to USD95 in May 2015, the stock continued its decline and eventually dropped to USD77 in September.

From the chart below, we can see that Alibaba is now trading above its"downtrend" line, RR. In fact, Alibaba's recent lows have been getting higher (C is higher than B and B is higher than A). Recently, Alibaba's high has finally surpassed its previous high (Z is higher than Y). This satisfies the definition of an uptrend- a higher high (or peak) and a higher low (or trough).

Some may feel that the entire price pattern from April till today is a larger "high". Thus, it is not enough that Z is higher than Y (at USD82.00). Z must be higher than X (at USD86.50).

I believe that Alibaba is probably commencing its upleg now. You may choose to play it safe by waiting for the share price to clear the USD86.50 mark before taking a position.


Chart: Alibaba's daily chart as at July 22, 2016 (Source: Stockcharts.com)

For those of you who like to look at the numbers, I regret to say that I don't have much to offer. My study of this stock is pretty much confine to Yahoo Finance. There is an interesting piece from a contributor to Forbes.com (here). To wit: 

As far as Alibaba goes, I think the days of relatively paltry returns (albeit far better than the return of any of our index funds for sure) could very well be behind us and the Alibaba engine is about to kick into high gear. Consider the following announcements from the company in the last couple of months:

Just last week, Bloomberg reported that Alibaba was readying Ant Financial for an IPO this year and was close to wrapping up a $3.5 billion dollar financing round that values Ant at $60 billion. Alibaba owns about a third of Ant Financial and also currently receives about 37.5% of Ant Financial’s pre-tax earnings which gives us an ownership stake worth $22.5 billion based on the $60 billion fund raising valuation.

On April 12, 2016, Alibaba announced a $1 billion investment in Lazada Group, an eCommerce company with operations in Indonesia, Singapore, Thailand, Vietnam and the Philippines. On a combined basis, these 6 countries have a population of 560 million or so with an approximate internet user base of 200 million.

On March 21, Alibaba announced that it reached three trillion RMB or $463 billion in GMV (gross merchandise volume) for fiscal year 2016 ended March 31, almost a week and a half ahead of the close of the quarter.

In the latter third of 2015, Alibaba announced that it was part of a group that consisted of Foxconn, Softbank , Temasek, Premji Invest (Investment Fund of Wipro founder Azim Premji) among others that had invested $500 million in India’s e-commerce company, Snapdeal, at a $5 billion valuation.

Maybe, beginning with the Ant Financial IPO sometime in 2016, Alibaba has begun the process of unlocking shareholder value and could see its shares appreciate at a faster clip than the tepid rate of return since the IPO in late 2014.

Better luck this time!

Note: 
In addition to the disclaimer in the preamble to my blog, I hereby confirm that I do not have any relevant interest in, or any interest in the acquisition or disposal of, Alibaba.

Ajiya: Earnings plummeted

Results Update

For QE31/5/2016, Ajiya's net profit dropped 69% q-o-q or 84% y-o-y to RM1.0 million while revenue was mixed- rose 8% q-o-q but dropped 9% y-o-y to RM101 million.Net profit peaked a year ago and it has been sliding since due to lower revenue or lower margin or provision for doubtful debts.


Table: Ajiya's 8 quarterly results


Chart 1: Ajiya's 39-quarter top-line & bottom-line performance

Valuation

Ajiya (closed at RM4.13 last Friday) is now trading at a trailing PE of about 21 times (based on last 4 quarters' EPS of 19.65 sen). At this multiple, Ajiya is fully valued.

Technical Outlook

Ajiya has risen substantially since my last post in October 2009. The stock is in an irregular upward channel, with resistance at RM5.00 & support at RM2.50.


Chart 2: Ajiya's monthly chart as at July 22, 2016  (source: Shareinvestor.com)

If you compared its the share price movement with its profit trend, you will see a persistent divergence. This is made worse by the recent decline in bottom-line while share price pulled away from RM2.80-3.00 level. This divergence must be corrected by either a price retracement or a rebound in earnings or both. (Note: These words were accidentally left out.)


Chart 3: Ajiya's monthly chart as at July 22, 2016 & Profits from 2006-2016  (source: Shareinvestor.com)

Conclusion

Based on weak financial performance and demanding valuation, Ajiya is rated a SELL INTO STRENGTH.

Note: 
In addition to the disclaimer in the preamble to my blog, I hereby confirm that I do not have any relevant interest in, or any interest in the acquisition or disposal of, Ajiya.

Sunday, July 24, 2016

IBHD: A Steady Performer at A Beaten Down Price

Background

I-Berhad ('I-Bhd") is the master developer of i-City, a mixed development that spans 72ac in Shah Alam. I-City is strategically located alongside the Federal highway and is easily accessible to the NKVE. It will be connected to the Bandar Utama-Klang LRT line once this line is completed.


In addition to the i-City, I-Bhd is also involved in the development of luxurious condominiums located next to KLCC, known as 8 Kia Peng,.


Besides property development, I-Bhd owns & operates a theme park known as Theme Park @i-City and hotels (Best Western & soon-to-be-opened Double Tree by Hilton).

Historical Financial Performance

I-Bhd's transformation began in 2012. In the next 5 years financial performance, its revenue & profit grew strongly. From the half-yearly results below, we can see I-Bhd's half-yearly revenue broke above the RM20 million in 2H2012. This propelled its half-yearly net profit above RM13 million.

After a small pullback in 2015, revenue continued to grow. PBT peaked at RM40 million in 2H2013 due to the recognition of fair value gain of RM13 million from the revaluation of investment properties. After a dip in 1H2015, profits roared back in 2H2015 & continued to rise in 1H2016.


Chart 1: I-Bhd's last 10 half-yearly P&L

Recent Financial Results

The quarterly results bears only the recovery in top-line and bottom-line in the past 3 quarters. This steady grow is expected to continue in view of its strong unbilled sales (see Chart 3 below).


Table: I-Bhd's last 8 quarterly P&L


Chart 2: I-Bhd's last 10 quarterly P&L


Chart 3: I-Bhd's last 5 half-yearly unbilled sales

Financial Position

I-Bhd's financial position is deemed healthy as at 30/6/2016 with current ratio at 4.5x and total liabilities to equity at 0.5x.

Valuation

I-Bhd (closed at RM0.545 last Friday) is now trading at a trailing PER of 10x (based on last 4 quarters' EPS of 5.23 sen). At this PER, I-Bhd is deemed fairly valued.

Technical Outlook

Over the last 20 months, I-Bhd gave back almost all its gain from 2012 to late 2014.


Chart 4: I-Bhd's monthly chart as at July 22, 2016 (Source: Shareinvestor.com)

I-Bhd's bottoming phase may be nearly completion. From the weekly chart below, we can see that the stock's recent low in June is higher than the low recorded in January. If it can go above and stay above the April high of RM0.55-0.56, the stock may begin its recovery.


Chart 5: I-Bhd's weekly chart as at July 22, 2016 (Source: Shareinvestor.com)

Conclusion

Based on good financial performance, healthy financial position and sharply lower share prices, I-Bhd could be a good stock to consider for long-term investment. However, it must be noted that its valuation is not cheap and its technical outlook is at best neutral.

Note: 
In addition to the disclaimer in the preamble to my blog, I hereby confirm that I do not have any relevant interest in, or any interest in the acquisition or disposal of, IBHD.

Waseong: Earnings Clarity Ahead

Background

Wah Seong Corporation Bhd ('Waseong") is a major oil & gas service group that provides a wide range of services globally such as highly specialised pipe coating, corrosion protection, drilling supplies as well as EPC, fabrication and rental of gas compressors (as per Wikipedia). Waseong is also a leading distributor and manufacturer of building materials and spiral welded steel pipes for water transmission and infrastructure use.

Recent Development

Waseong has recently secured a project from Nord Stream 2 AG for the new pipeline which will deliver gas from North Russia to the German coast near Greifswald. 

  • This pipeline involves two parallel 48 inch lines, roughly 1,200km each starting from south-west of the Russian port city of St Petersburg on the Baltic Sea and ending at German coast, Greifswald.  
  • The award involves concrete weight coating and storing of approximately 2,400 km of pipes. The project is expected to commence in September 2016 and be completed by third quarter of 2019.
  • Using the earlier Polarled project contract value as a yardstick, KAF-Seagroatt & Campbell Securities gave an estimate for Nord Stream 2 contract to be US$600-US$650mil (RM2.4bil-RM2.6bil). For more, go here and here.
Map of Nord Stream Pipeline

Historical Financial Performance

For the past 6 years, Waseong's bottom-line has been very erratic with a downward bias.This was due to lower profit margins while top-line was maintained at around the RM2 billion mark.


Chart 1: Waseong's last 10 years' P&L

Recent Financial Results

Waseong's revenue had been declining in the last 4 quarters due to the challenging operating environment for oil & gas sector. Waseong reported a loss in QE31/12/2015 due to the recognition of impairment losses on plant and equipment of RM30.3 million during the current quarter. Excluding this impairment, the Group’s profit before taxation would have been RM13.3 million.


Chart 1: Waseong's last 18 quarters' P&L

Financial Position

Waseong's financial position is weak with current ratio at 0.97x and total liabilities to equity of 1.35x.

Valuation

Waseong (closed at RM0.745 last Friday) is now trading at a Price to Book of 0.5x (based on NTA p.s. of RM1.40 as at 31/3/2016). As it was loss-making for the last 4 quarters, its PER is not meaningful.

Technical Outlook

Waseong is in a downtrend line in the past 2 years. This downtrend line will pose a resistance at RM0.85.


Chart 3: Waseong's weekly chart as at July 22, 2016 (Source: Shareinvestors.com)

Waseong nearly tested the low of its 2002 rounding bottom of RM0.60 recently. While there is no sign of a bottom yet, this level of RM0.60 should present a fairly strong support for the stock.


Chart 4: Waseong's monthly chart as at July 22, 2016 (Source: Shareinvestors.com) 

Finally, if we compared the retracement in Waseong's share price vis-a-vis its profit trend, it looks like share price has overshot in the downside. Thus, I believe the Nord Stream pipeline could well be the catalyst for a re-rating of the stock.


Chart 5: Waseong's monthly chart as at July 22, 2016 and last 18-quarter P&L (Source: Shareinvestors.com)

Conclusion

Based on earning clarity from contracts in hand, possible turnaround in earnings and attractive valuation, Waseong could be a good stock for a recovery play. 

Note: 
In addition to the disclaimer in the preamble to my blog, I hereby confirm that I do not have any relevant interest in, or any interest in the acquisition or disposal of, Waseong.