Thursday, September 07, 2017

Tunepro: A Possible Trading Buy

Results Update

For QE30/6/2017 (2Q17), Tunepro's net profit rose 9% q-o-q but dropped 51% y-o-y to RM13 million while revenue rose 3% q-o-q or 7% y-o-y to RM134 million. Revenue came from increase of RM3.2 million in Gross Earned Premium from the Philippines and Middle East markets in general reinsurance business and increase of RM0.6 million in investment income, mainly due to reversal of MMIP investment income in 1Q17. There was a decrease of RM2.0 million in Group's segment profit, from RM15.1 million in 1Q17 to RM13.1 million in 2Q17, due mainly to increases in net commissions mainly from general insurance business. [Note: Tunepro's result for QE30/9/2016 was released on August 18.]


Table: Tunepro's last 8 quarterly results


Graph: Tunepro's last 23 quarterly results

Valuation

Tunepro (closed at RM1.09 yesterday) is now trading at a PER of 14.7 times (based on last 4 quarters' EPS of 7.43 sen). Its dividend yield is about 4.6% (based on dividend payment of 5 sen in FY16). Based on these 2 valuation models, Tunepro is deemed fairly valued.

Technical Outlook

Tunepro broke below the medium-term downtrend line, rr at RM1.02 in late August. It then rallied to a high of RM1.12 before correcting back to about RM1.05. Today, it broke above the recent high of RM1.12- possibly starting its recovery.


Chart 1: Tunepro's daily chart as at Sep 7, 2017_12.30pm (Source: Malaysiastock.biz) 

Tunepro's immediate resistance could be the intermediate downtrend line, RR at RM1.30. If it can also break above this downtrend line, then Tunepro could begin its next upleg.


Chart 2: Tunepro's weekly chart as at Sep 7, 2017_12.30pm (Source: Malaysiastock.biz) 

Conclusion

Despite weaker financial performance and negative technical outlook, Tunepro remains a good stock for a recovery play due to its recent sharp selldown from RM1.60 to RM1.00.

Note:
I hereby confirm that I do not have any direct interest in the security or securities mentioned in this post. However, I could have an indirect interest in the security or securities mentioned as some of my clients may have an interest in the acquisition or disposal of the aforementioned security or securities. As investor, you should fully research any security before making an investment decision.

Wednesday, September 06, 2017

KPJ: 1-to-4 Share Split Goes Begging

Background

KPJ is the largest private hospital group in Malaysia, owing a total of 3000 beds which accounts for 23% of the 13,000 private hospital beds in the country. It’s the fifth-largest hospital operator based on market capitalisation in Asia Pacific behind IHH Healthcare Bhd, Apollo Hospitals Enterprise Ltd, Phoenix Healthcare Group Co Ltd and Fortis Healthcare Ltd.

KPJ currently operates 26 hospitals in Malaysia, two in Indonesia and one in Bangladesh and have more than 1,000 medical specialists on board. KPJ has allocated RM1 billion to add seven new hospitals in the country in the next 5 years. Two of the new hospitals will be built in Sarawak, three in Johor and one each in Perlis and the Klang Valley.

Recent Financial Performance 

For QE30/6/2017, KPJ's net profit dropped 16% q-o-q but rose 6% y-o-y to RM32 million while revenue dropped less than 1% q-o-q but rose 4% y-o-y to RM793 million. The drop in profits was caused by a slight drop in gross profit margin (from 30.2% to 29.9%) and increased administrative expenses (by RM10 million) which had more than offset the drop in net finance cost (by RM3 million) and increased share of results of associates (by RM0.6 million). (Note: KPJ's latest result was announced on August 24.)


Table: KPJ's last 8 quarterly results

KPJ's quarterly revenue has been on a steady uptrend for the past 10 years. Its earning has been flattish in the past 5-6 years due to expansion program which led to lower profit margin as higher administrative expenses were not fully absorbed by revenue from the newly hospitals opened.


Graph: KPJ's last 42 quarterly results

Latest Financial Position

As at 30/6/2017, KPJ's financial position is deemed average, with current ratio at 1.0x and total liabilities to total equity at 1.4x.

Proposed Corporate Exercise

In April, KPJ proposed to carry out a share split of 1-to-4 (here). Such a generous share split has caused many a stock to run amok. While we can see similar euphoria in KPJ-WB (see Chart 3 below), the response from KPJ was muted. The main reason is that steady selling by EPF. Strangely, EPF appears to have ceased its selling since early May (here). It's likely that EPF expects better prices ahead once the share split has been implemented. At that point, KPJ will be priced around the RM1.00 and that would make it an affordable stock for the general public; thus inviting speculative activity and higher prices.

Valuation

KPJ (closed at RM4.16 yesterday) is now trading at a PE of 29.5 times (based on last 4 quarters' EPS of 14.08 sen). At this PER, AEON KPJ is over-valued. (Note: IHH is now trading at a PER of about 31 times- based on annualized EPS of 19 sen).

Technical Outlook

KPJ has been moving sideways with a downward bias for the past 3 years. There is no sign that the sideways movement is about to change.


Chart 1: KPJ's monthly chart as at September 5, 2017 (Source: ShareInvestor.com)


Chart 2: KPJ's weekly chart as at September 5, 2017 (Source: ShareInvestor.com)


Chart 3: KPJ-WB's weekly chart as at September 5, 2017 (Source: ShareInvestor.com)

Conclusion

KPJ could be a good speculative stock for a short-term play. While the stock is a good stock for long-term investment, the continuous expansion program is a drag on its earning. This plus the fact that the stock is fully valued make KPJ an unexciting stock, except for one possible short-term play for the 1-to-4 share split.

Note:
I hereby confirm that I do not have any direct interest in the security or securities mentioned in this post. However, I could have an indirect interest in the security or securities mentioned as some of my clients may have an interest in the acquisition or disposal of the aforementioned security or securities. As investor, you should fully research any security before making an investment decision.

AJI: Post-Dividend Payout Blue

"Too much of a good thing can be wonderful!" Mae West

A Handsome Windfall, A Bumper Dividend & A Sharp Drop

In February this year, AJI received the award of compensation of RM166 million from the Government for the compulsory acquisition of its factory land located in Jalan Kuchai Lama for the MRT2 project (here). The compensation gave the company a gain on disposal of RM145 million. To reward its shareholders, AJI announced a final dividend and a special dividend totaling RM1.55 per share in May (here) . These dividend entitlements went ex on August 30.

Driven by higher earning (as a result of forex gain) and news of the big windfall from the compulsory acquisition of the above land, AJI share price rose from RM8.00 in late 2015 to a recent high of RM26.48 (recorded on August 8).


Chart 1: AJI's monthly chart as at September 5, 2017 (Source: ShareInvestor.com)

AJI hanged around the RM26 price level for about 2 weeks, and on August 25, it started to slide down. At the close on August 29 (the last cum date for the bumper dividend), AJI closed at RM24.00 (after it dropped to an intraday low of RM23.02). After the ex date, AJI share price continued to drop below its reference price (or, theoretical ex entitlement price) of RM22.45. Yesterday it closed at RM19.98.


Chart 2: AJI's intraday chart as at September 5, 2017 (Source: ShareInvestor.com)

Technical Outlook

Whether you are looking at the unadjusted price chart or adjusted price chart (adjusted for the bumper dividend payment), you can see that the uptrend line of the stock has been violated. The question is where will the share price find its next support and begin to right itself. Since the share price has dropped about 19% from adjusted high of RM24.50, I think the base for corrective move to the upside should kick in soon. I believe that the first support will be at the psychological RM20.00 mark even though the share price closed just below that level yesterday. Beyond that I would refer to the adjusted price chart (on the right hand side) and I see support at RM19.50 (the base formed in June) and then the horizontal line at RM18.60.


Chart 3: AJI's daily chart as at September 5, 2017 (Source: Kenanga/BTX)

Recent Financial Result

AJI's latest quarterly result is for QE30/6/2017, which was announced on August 24. In that quarter, AJI's net profit dropped 95% q-o-q or 40% y-o-y to RM7.9 million while revenue dropped 16% q-o-q or 2% y-o-y to RM96 million. The q-o-q decline is due to two main reasons: huge gain on disposal of the factory land of RM145 million plus the seasonally weaker quarter. The y-o-y decline was attributed to weaker performance from the Consumer Segment, where operating profit plunged from RM10.2 million to RM2.1 million due to lower revenue, higher production cost as a result of higher material costs and higher advertising and sales promotion expenses incurred to promote its products locally and overseas. I believe the financial performance will recover next quarter.


Table: AJI's last 8 quarterly results


Graph: AJI's last 48 quarterly results

Latest Financial Position

As at 30/6/2017, AJI's current ratio stood at 12x and total liabilities to total equity stood at 0.1x. Not many companies listed on Bursa Malaysia can match AJI in term of financial strength.

Valuation

AJI (closed at RM19.98 yesterday) is trading at a trailing PER of 76x (based on adjusted 4 quarters' EPS of 26 sen). The "normal" profit of the company for the past 2 quarters had gone haywire due to the A&P expenses as well as the huge gain on disposal of the factory land (where all kind of "additional" expenses had sprung up). Once AJI net profit returned to normal (~RM12 million a quarter), its PER will stabilize at 26x. At this level, the stock is deemed fairly valued.

Including the recent bumper dividend, AJI has paid out dividend totaling RM3.56 over the past 12 years since I first started tracking this stock. See my first report.

Conclusion

Based on satisfactory financial performance & strong financial position, solid management and unique & established products, AJI is a good stock for long-term investment. The current selldown could be a good opportunity to get into this stock. However, your buying should be gradual as the share price has just broken its long-term downtrend line. Good luck!

Note:
I hereby confirm that I do not have any direct interest in the security or securities mentioned in this post. However, I could have an indirect interest in the security or securities mentioned as some of my clients may have an interest in the acquisition or disposal of the aforementioned security or securities. As investor, you should fully research any security before making an investment decision.

Tuesday, September 05, 2017

Axiata: Earning Rebounded

Background

Axiata Group Berhad (“Axiata”) provides various telecommunications products and services in Asia. It has controlling interests in six mobile operators under the brand names of ‘Celcom’ in Malaysia, ‘XL’ in Indonesia, ‘Dialog’ in Sri Lanka, ‘Robi’ in Bangladesh, ‘Smart’ in Cambodia and ‘Ncell’ in Nepal, with strategic interests in ‘Idea’ in India and ‘M1’ in Singapore. The Group has an infrastructure company, ‘edotco’, which operates in five countries to deliver telecommunications infrastructure services, and operates and manages a regional portfolio of over 25,000 towers. For more information on the group, go here.  

Historical Financial Performance

Axiata’s top-line has been on a steady uptrend over the past 10 years. However its bottom-line suffered a decline in the past 5 quarters, with net profit below RM400 million from QE31/3/2016 to QE31/3/2017. It even incurred a net loss of RM309 million in QE31/12/2016. The reasons for the decline in profit (and loss) for these 5 quarters are:
  • amortisation of intangibles assets arising from acquisition of Nepal operation
  • accelerated depreciation in Indonesia & Bangadesh
  • foreign exchange losses
  • higher net finance costs
In QE30/6/2017, Axiata net profit climbed back above the RM400 million. This may mark the beginning of its earning recovery.

Graph: Axiata’s last 42 quarters revenue & profits

Recent Financial Result

Axiata announced its latest quarterly result for QE30/6/2017 last week. Its net profit rose 70% q-o-q or 116% y-o-y to RM407 million while revenue rose 3% q-o-q or 14% y-o-y to RM6.06 billion. The q-o-q improvement in profit was due to improved performance in all major operating companies with the exception of the Cambodian operation. Improved revenue and effective cost management resulted in EBITDA growth by 5.6%. For the quarter, share of results from associates and joint ventures declined by more than 100% mainly as a result of the investment in India. India continues to face intense market aggression arising from the new entrant in the Indian market. PAT improved by 82.8% and PATAMI increased by 70.4% to RM407.2 million contributed mainly by the improved quarter performance by all major operations.

Table: Axiata’s last 8 quarters’ P&L

Latest Financial Position

Axiata’s financial position is relatively weak as at 30/6/2017, with current ratio at 0.66x and total liabilities to total equity at 1.25x. The weak financial position - due to over-expansion - need to be rectified by either capital-raising or partial disposal of its stakes in some of the operating units (such as its tower asset company).

Valuation

Axiata (closed at RM4.93 on August 30, 2017) is now trading at a trailing PER of 75x (based on last 4 quarters’ EPS of 6.6 sen). At this PER, the stock is over-valued. However Axiata may be on the path of recovery. If its net profit can climb back to RM600 million a quarter, its full-year EPS would be about 28 sen - bringing down its PER to 18x. At a PER of less than 20x, Axiata will again be an attractive telco stock.

Technical Outlook

Axiata broke its long-term uptrend in 2015 when its share price went below its 30-month EMA line. Since then, Axiata has been on a downtrend.  

Chart 1: Axiata’s monthly chart as at August 30, 2017 (Source: Shareinvestor.com)

If Axiata can surpass the intermediate downtrend line, RR at RM5.30, the share price recovery may begin.

Chart 2: Axiata’s weekly chart as at August 30, 2017 (Source: Malaysiastock.biz)

Conclusion

Axiata could be a good stock for a recovery play based on tentative sign of earning recovery. It is a home-grown multi-national company with good management, steady revenue growth and, until recently, long track record for profitable operation. However the stock is not cheap as its earning had declined sharply over the past 5 quarters. With earning recovery beckons, Axiata could be a good stock to consider for long-term investment. 

Note:
I hereby confirm that I do not have any direct interest in the security or securities mentioned in this post. However, I could have an indirect interest in the security or securities mentioned as some of my clients may have an interest in the acquisition or disposal of the aforementioned security or securities. As investor, you should fully research any security before making an investment decision.

BONIA: Signs of Earning Recovery

Background

Bonia Corporation Berhad (“Bonia’”) is an investment holding company, with subsidiaries involve in the design, manufacture, promotion, marketing, distribution, wholesale, and retail of leatherwear, footwear, apparel, accessories, and eyewear for men and women. Bonia was founded in 1974 and listed on Bursa Malaysia in 1994. For more information on the group, go here. If you wish to Bonia products online, go here.

Historical Financial Performance

Bonia’s top-line has been on a steady uptrend until FY2015. Despite the drop in sales in the past 3 years, Bonis’s bottom-line started to recover in FY2017. The earning recovery was brought about by improvement in gross profit margin (“GPM”) as the Group has adjusted its pricing strategy by introducing higher-margin products, reducing discounts given out to customers, in particularly for Bonia and Braun Buffel brands.

 Graph 1: Bonia’s last 19 years revenue & profits

Recent Financial Result

Bonia announced its latest quarterly result for QE30/6/2017 last week. Its net profit rose 61% q-o-q or 103% y-o-y to RM7.7 million while revenue was mixed - up 2% q-o-q but down 4% y-o-y – at RM154 million. As explained earlier, Bonia’s bottom-line improved due to the improvement in gross profit margin as the Group has adjusted its pricing strategy by introducing higher-margin products, reducing discounts given out to customers for new product ranges, in particularly for Bonia and Braun Buffel brands. The higher PBT achieved also due to lower fair value adjustments on investment properties of RM238,000 for the current quarter as compared to last year’s RM2.66 million.

Table: Bonia’s last 8 quarters’ P&L

Graph 2: Bonia’s last 40 quarters revenue & profits

Latest Financial Position

Bonia’s financial position is deemed healthy as at 30/6/2017, with current ratio at 2.77x and total liabilities to total equity at 0.56x.

Valuation

Bonia (closed at RM0.565 on August 30, 2017) is now trading at a trailing PER of 14x (based on last 4 quarters’ EPS of 3.94 sen). At this PER, Bonia is deemed fully valued. However if earning recovery picks up, valuation may become more attractive.

Technical Outlook

Bonia broke its long-term uptrend line, SS at RM0.70 in late 2015. It has since found support at the horizontal line at RM0.55-0.56. While the MACD indicator has hooked up (a positive sign), long-term uptrend will only commence once MACD has gone above the zero line.

Chart 1: Bonia’s monthly chart as at August 30, 2017 (Source: Shareinvestor.com)

The weekly chart is mildly negative, with the MACD indicator just below the zero line. Will the support at the horizontal line at RM0.55 stop the slide? We will have to wait and see.

Chart 2: Bonia’s weekly chart as at August 30, 2017 (Source: Malaysiastock.biz)

Conclusion

Bonia could be a good stock for a recovery play based on tentative earning recovery. It is a well-established company with good management and a long track record for profitable operation and steady sales growth. However the stock is not cheap as the green shoots of earning recovery have only begun to sprout. If you like to get into a beaten down stock and ride on its recovery, Bonia could be a good stock to do so.

Note:
I hereby confirm that I do not have any direct interest in the security or securities mentioned in this post. However, I could have an indirect interest in the security or securities mentioned as some of my clients may have an interest in the acquisition or disposal of the aforementioned security or securities. As investor, you should fully research any security before making an investment decision.

Wednesday, August 30, 2017

Spritzer: Earning Dropped

Result Update

For QE30/6/2017Spritzer's net profit rose 2.3% q-o-q but dropped 32% y-o-y to RM5.1 million. Revenue was mixed - rose 8.2% q-o-q but dropped 8.3% y-o-y to RM79 million. Profit before tax increased 8% q-o-q from RM7.1 million to RM7.6 million mainly due to higher revenue, which increased q-o-q mainly due to increased in average selling prices as well as sales volume increase due to festive season and hot weather. The increased revenue had more than offset 9%-increase in cost of sales and other operating expenses which was contributed by continued increase in PET resin costs and higher spending on advertising and promotion, in particular on SEA Games sponsorship.


Table: Spritzer's last 8 quarterly results


Graph: Spritzer's last 38 quarterly results

Valuation

Spritzer (closed at RM2.16 yesterday) is now trading at a PE of 9.8 times (based on last 4 "full" quarters' EPS of 22 sen). At this PER, Spritzer is still deemed very attractive for a consumer stock.

(Note: I have excluded the period ended 31/12/2016, which is actually a 1-month accounting period to reflect the change in financial year-end, in computing the last 4 quarters EPS.)

Technical Outlook

Spritzr is in a long-term uptrend line, with support at RM2.10.


Chart 1: Spritzer's monthly chart as at Aug 30, 2017_11.30  (Source: ShareInvestor.com)

Spritzer is however trending lower for the past 12 months as the share price is trapped in a downward channel. The lower line may provide support for the share price at RM2.15. This plus the support from the long-term uptrend line, SS (as noted above) at RM2.10 means that the share price is likely to stabilize soon.


Chart 2: Spritzer's weekly chart as at Aug 30, 2017_11.30  (Source: ShareInvestor.com)

Conclusion

Despite weaker financial performance, Spritzer is a good stock to consider for long-term investment based on attractive valuation and positive technical outlook.

Note:
I hereby confirm that I do not have any direct interest in the security or securities mentioned in this post. However, I could have an indirect interest in the security or securities mentioned as some of my clients may have an interest in the acquisition or disposal of the aforementioned security or securities. As investor, you should fully research any security before making an investment decision.

Tuesday, August 29, 2017

Dialog: Breaking New High

Background

Dialog Group Berhad ("Dialog") is an investment holding company. Its subsidiaries are involved in the provision of engineering, procurement, construction and commission services and plant maintenance services. Dialog is also involved in the retailing of petroleum to oil, gas and petrochemical industries and marketing of specialty chemical and equipment.

Historical Financial Performance

Since its listing in 1996, Dialog's revenue has been on a steady growth path except for two periods: 2002-2006 and 2015-2016.


Graph 1: Dialog's last 19 years' P&L

Results Update

In QE30/6/2017, Dialog's net profit rose by 9.7% q-o-q or 32.9% y-o-y to RM104 million while revenue rose 6.1% q-o-q or 35.1% y-o-y to RM969 million. While revenue is still below the RM1 billion mark, Dialog has achieved a milestone as its net profit has surpassed the RM100 million!

The improved financial performance was “mainly attributable to higher contributions from the Group’s joint ventures which recorded an increase by 51.1% to RM107 million from RM70.8 million recorded in previous financial year”.

The Group’s Malaysia operation was “busy in the midstream and downstream activities with engineering, construction and fabrication works from various on-going projects such as the Pengerang Deepwater Terminal Phase 2, Jetty Topside works for Samsung in Pengerang and the construction of plasticizer plant for UPC Chemicals in Kuantan”.

The Group’s International operation also recorded a better financial performance “primarily driven by the increased downstream activities in Singapore and Saudi Arabia”.


Table: Dialog's last 8 quarters' P&L


Graph 2: Dialog's last 14 quarters' P&L

Latest Financial Position

Dialog's financial position as at 30/6/2017 is deemed satisfactory with current ratio at 1.7x while gearing ratio at 0.8x. Its cash & cash equivalent stood at RM1.425 billion- which nearly matches total borrowings of RM1.423 billion. If borrowings were netted off, gearing ratio would drop to 0.38x.

Valuation

Dialog (closed at RM2.03 yesterday) is now trading at a trailing PER of 30x (based on last 4 quarters' EPS of 6.7 sen). At this PER, Dialog is deemed fully valued. However, Dialog's earning grew by 26% last 4 quarters- which gives the stock a reasonable PEG ratio of 1.2x.

Technical Outlook

Dialog has broken above the psychological RM2.00 level. It also happens to be the upper line of a flag formation. This could mean that the stock could continue with its prior uptrend. If the breakout can gain sufficient support, the target price for this rally could be RM2.50.


Chart 1: Dialog's weekly chart as at Aug 28, 2017 (Source: ShareInvestor.com)


Chart 2: Dialog's monthly chart as at Aug 28, 2017 (Source: ShareInvestor.com)

Conclusion

Based on good financial performance and position, fair valuation for a growth stock & potential bullish technical outlook, Dialog could be a good stock for long-term investment.

Note:
I hereby confirm that I do not have any direct interest in the security or securities mentioned in this post. However, I could have an indirect interest in the security or securities mentioned as some of my clients may have an interest in the acquisition or disposal of the aforementioned security or securities. As investor, you should fully research any security before making an investment decision.

Monday, August 28, 2017

N2N: Earnings Boosted By Its New Subsidiary, AFE


Result Update

In QE30/6/2017, N2N's net profit rose 174% q-o-q or 247% y-o-y to RM9.9 million while its revenue rose 164% q-o-q or 182% y-o-y to RM30 million. Revenue rose y-o-y as a result of full consolidation of AFE Solutions Ltd's ("AFE") profit after its acquisition. In addition, the increase was also due to higher monthly variable matched trades.

Net profit rose y-o-y due to the full consolidation of AFE's results, the unrealised foreign exchange gain on USD loan of approximately RM3.85 million and fair value change on financial assets at fair value through profit or loss of RM0.79 million. Excluding the last 2 items, N2N's net profit would have been RM5.3 million for QE30/6/2017 - a 85%-increase from same quarter last year.


Table: N2N's last 8 quarters' P&L


Graph: N2N's last 15 quarters' P&L

Latest Financial Position

As at 30/6/2017, N2N's financial position is satisfactory, with current ratio of 8x and gearing ratio of 0.55x. In addition, it has net cash, FDs & financial assets totaling RM49 million (or, 10 sen per share).

Valuation

N2N (closed at RM0.73 last Friday) is now trading at a PER of 17x (based on annualized core EPS 4.4 sen). At this PER, N2N is deemed fairly attractive.

(Note: Annualized EPS is arrived at by dividing annualized net profit by number of shares outstanding of 477 million. Annualized net profit is computed by multiplying core net profit for QE30/6/2017 of RM5.30 million by 4.)

Technical Outlook

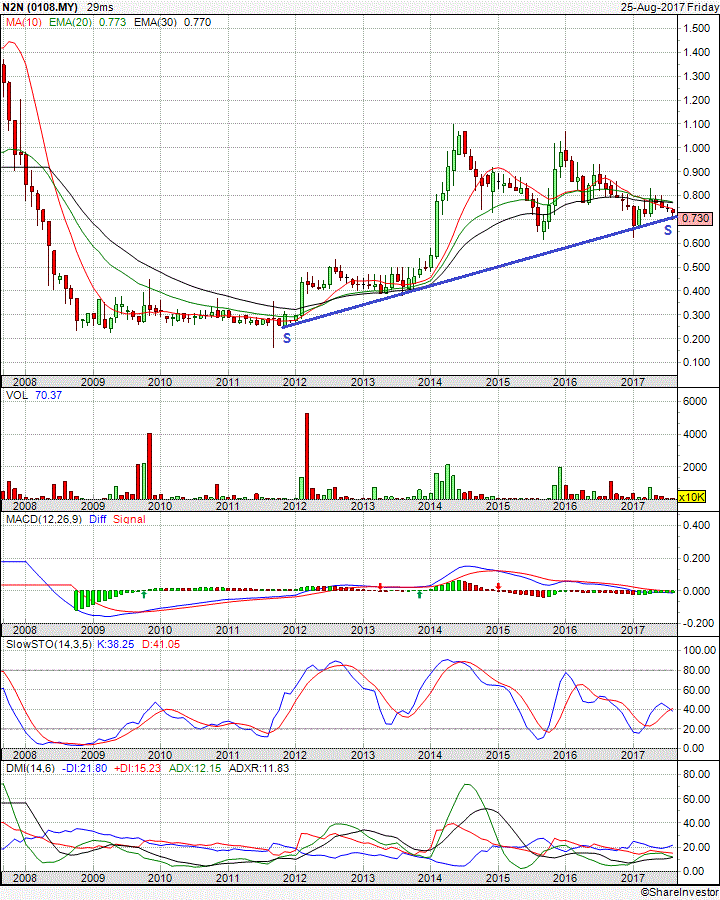
N2N is in a long-term uptrend line (SS) with support of RM0.70.


Chart 1: N2N's monthly chart as at Aug 25, 2017 (Source: ShareInvestor)


Chart 2: N2N's weekly chart as at Aug 25, 2017 (Source: ShareInvestor)

Conclusion

Based on good financial performance, healthy financial position, fairly attractive valuation & still positive technical outlook, N2N could be a good stock for long-term investment.

Note:
I hereby confirm that I do not have any direct interest in the security or securities mentioned in this post. However, I could have an indirect interest in the security or securities mentioned as some of my clients may have an interest in the acquisition or disposal of the aforementioned security or securities. As investor, you should fully research any security before making an investment decision.

Friday, August 18, 2017

IFCAMSC: Riding The Property Dragon

Background

IFCA MSC Bhd ("IFCMSC") is involved in the provision of IT business solution. Its area of specialty is the property industry where its solutions have found ready acceptance. It has expanded to other ASEAN countries as well as China.

Recent Financial Performance

IFCAMSC's financial performance was on a steady uptrend from 2008 until 2013. In 201, its revenue & profits took off. It peaked in 2015 and crashed down in 2016. The trajectory of its revenue & profits mirrors the health of the Malaysian property market, which peaked in 2015.

The sharp drop in IFCAMSC's profit in FY2016 was due to the following:
1) Drop in revenue due to the slump in the property market; and
2) Recognition of depreciation & amortization charges for developing its online portal Property365


Graph 1: IFCAMSC's last 10 years P&L

Recent Quarterly Result

In QE30/6/2017, IFCAMSC's net profit rose 50% q-o-q to RM2.5 million while revenue increased by 7% to RM20.6 million. In the same quarter last year, the company reported a net loss of RM535k. Revenue increased y-o-y mainly attributable to the higher sales contribution from our overseas segment and this has resulted in a higher profit before tax for the quarter.


Table: IFCAMSC's last 14 quarters P&L


Graph 2: IFCAMSC's last 14 quarters P&L

Financial Position

IFCAMSC's financial position as at 30/6/2017 is deemed healthy with current ratio at 3.9x and total liability to equity at 0.3x. Its cash reserve stood at RM69.6 million or RM0.11 per share.

Valuation

IFCAMSC (closed at RM0.41 yesterday) is now trading at a PER of 26x (based on last 4 quarters' EPS of 1.60 sen) or at a Price to Book of 2.3x (based on NTA per share of 18 sen). IFCAMSC paid out a 0.5 sen dividend last year- a drop from 1 sen dividend paid out in FY2015 & FY2014. If the dividend payment remains at 0.5 sen per share, then the dividend yield is only 1.2%. Overall, IFCAMSC is deemed fully valued. If its profit recovery can continue, then its share price will look more attractive and the price recovery can begin in earnest.

Technical Outlook

IFCAMSC rallied from a low of RM0.10 in 2014 to a high of RM1.80 in 2015- a dream came true for the lucky investors who owned the stock. Its long decline to a low of RM0.25 in 2016 is a nightmare that all investors would want to avoid.


Chart 1: IFCAMSC's monthly chart as at Aug 17, 2017 (Source: Shareinvestor.com)

IFCAMSC may have broken above its downtrend line, RR. If it can surpass the RM 0.50 level (from the line, AB), IFCAMSC recovery may begin.


Chart 2: IFCAMSC's weekly chart as at Aug 17, 2017 (Source: Shareinvestor.com)

Conclusion

Based on improving financial performance and healthy position, IFCAMSC could be a good stock for long-term investment.

Note:

I hereby confirm that I do not have any direct interest in the security or securities mentioned in this post. However, I could have an indirect interest in the security or securities mentioned as some of my clients may have an interest in the acquisition or disposal of the aforementioned security or securities. As investor, you should fully research any security before making an investment decision.

Vitrox: Earnings Continued To Rise

Result Update

For QE30/6/2017, Vitrox's net profit increased by 15% q-o-q and 48% y-o-y to RM21million while revenue increased by 12% q-o-q or 37% y-o-y to RM78 million. Both revenue and profit before tax have recorded an increase of 12% and 16% respectively. The increase in PBT was due to increase in revenue recorded for Machine Vision System (MVS) and Automated Board Inspection (ABI) plus other operating income generated from grant income.


Table: Vitrox's last 8 quarterly results


Chart 3: Vitrox's last 39 quarterly results

Valuation

Vitrox (closed at RM4.80 uesterday) is now trading at a PE of 30 times (based on last 4 quarters' EPS of 15.96 sen). At this PER, Vitrox is deemed fully valued. [Note: Vitrox has completed its 1-for-1 bonus issue in early July. Like most listed companies who carried out their bonus issue, the date of the bonus is conveniently put right after the end of a financial quarter. This gives rise to misleading comparison between EPS & share price. If you are not an existing shareholder, you will compare the share price with the reported but unadjusted EPS and come to the wrong conclusion on valuation.] 

Technical Outlook

Vitrox rose sharply after it broke above the RM2.00 horizontal line in late February (which coincided with its strong result for QE31/12/2016). The rise went exponential when the company proposed its bonus issue in May.

 
Chart 1: Vitrox's weekly chart as at Aug 17, 2017 (Source: Shareinvestor.com)

Vitrox may be pressing against the upper line of its upward channel. This line may act as a resistance, capping its upside until it has been taken out.


Chart 2: Vitrox's monthly  chart as at Aug 17, 2017 (Source: Shareinvestor.com)

Conclusion

Based on improving financial performance & bullish technical outlook, Vitrox could be a good stock for long-term investment. However, it may be a good idea to take some profit as the share price upside may be constrained by technical resistance.

Note:

I hereby confirm that I do not have any direct interest in the security or securities mentioned in this post. However, I could have an indirect interest in the security or securities mentioned as some of my clients may have an interest in the acquisition or disposal of the aforementioned security or securities. As investor, you should fully research any security before making an investment decision.

Thursday, August 17, 2017

PMetal: Earnings Stayed Strong

Results Update

For QE30/6/2017, PMetal's net profit increased by 1% q-o-q or 3% y-o-y to RM150 million while revenue rose 3% q-o-q or 31% y-o-y to RM2.079 billion.  Higher profit was mainly due to the strengthening of metal price during the current year quarter under review and continuous improvement in reducing the production costs


Table: PMetal's last 8 quarterly results


Graph: PMetal's 39 quarterly results

Aluminium Outlook


Contrary to my earlier post on aluminium outlook, prices shot up in the past 2 weeks from USD1985 a tonne to USD2100 a tonne today. Its immediate resistance is at the horizontal lines at USD2100 and USD2200.


Chart 1: Aluminium's monthly chart from 2009 to Aug 2017 (Source: Investing.com)

Prospect

PMetal is fairly confident that its financial performance this year will be satisfactory. This is based on the following:
Aluminium price continues to increase as more and more production cuts are being announced in China according to the government supply reform policy. As a result, the China smelting production is expected to slow down and the world’s supply and demand will tilt towards a deficit situation which will support long term aluminium price performance.
 Our smelting operations will continue to run at full capacity for the remaining of the year with demand continues to be well supported. We will remain focused on expanding our value-added products and improving the overall operation efficiency.


Valuation

PMetal (closed at RM3.34 at end of morning session today) is now trading at a PER of 21 times (based on last 4 quarters' EPS of 16.25 sen). Based on this PER, PMetal is deemed fairly valued.

Technical Outlook

PMetal broke above its recent high of RM3.00. This leads to the continuation of its prior uptrend.


Chart 2: PMetal's weekly chart as at Aug 16, 2017 (Source: ShareInvestor.com)

PMetal was rising in a long-term upward channel up until January this year. At the start of the year, PMetal broke above the upper line at RM1.70 and shot up.


Chart 3: PMetal's monthly chart as at Aug 17, 2017 (Source: ShareInvestor.com)

Conclusion

Based on strong financial performance, fair valuation and bullish technical outlook, PMetal is a good stock for long-term investment.

Note:

I hereby confirm that I do not have any direct interest in the security or securities mentioned in this post. However, I could have an indirect interest in the security or securities mentioned as some of my clients may have an interest in the acquisition or disposal of the aforementioned security or securities. As investor, you should fully research any security before making an investment decision.