Tuesday, February 06, 2018

Market Outlook as at February 6, 2018


DJIA plunged to the 100-day SMA line yesterday before it recovered slightly to close at 24346. Nevertheless, DJIA lost a whopping 1175 points- it's greatest point loss in history. I believe the stage is set for a technical rebound today.


Chart 1: DJIA's daily chart as at Feb 5 2018 (Source: Stockcharts.com)

The sharp drop in DJIA caused sharp drop in stock market everywhere. Malaysia is no exception. FBMKLCI dropped below 1800 in the morning session (made an intraday loss of 1795). We can see from the weekly & monthly charts below that this level of 1795-1800 is a good support level. If DJIA were to stage a technical rebound today, we may see stocks jumping up tomorrow.


Chart 2: FBMKLCI's weekly chart as at Feb 5 2018 (Source: Snareinvestor.com)


Chart 3: FBMKLCI's monthly chart as at Feb 5 2018 (Source: Snareinvestor.com)

I believe that stocks at the current prices are worth buying- not selling. However, please exercise careful discretion if you choose to venture into the market now. Good luck!!

Monday, February 05, 2018

DJIA: A 666-point Drop


Last Friday, Dow Jones Industrial Average ('DJIA') shed 666 points- making it the biggest single-day daily drop in 2 years. On the weekly basis, DJIA lost 1100 points- its biggest loss in the past 9 years. In my opinion, there are 3 likely reasons for the sharp drop:
1. Fed is about to embark on a roll-back of its easy money policies. Recently it has given indication that it may even hasten its rate hike schedule; 
2. The stock market is significantly over-bought; and 
3. The Russian collusion cum obstruction of justice investigation against the Trump administration is approaching the home stretch. The probability of a constitutional crisis is very likely as Trump and his Republican supporters are not the kind of people who play by the rules; they believe in alternate truth, and seem to live in a parallel universe. Thus, the stage is now set for a test of the rule of law in the US, the greatest democracy in our life time. 
Meanwhile, DJIA broke the 20-day SMA line at 25939 last Friday. The 20-day SMA line has been supporting the index in its previous corrections for the past 5 months. DJIA may test its 50-day SMA line at 25016 this week. Notwithstanding technical rebound along the way, I expect the correction to persist for a few weeks and DJIA to find support at the 100-day SMA line at 23982. Global equity markets will see similar correction, albeit of a slightly small magnitude. Volatility will be the order of the day. My advice is to reduce your trading activities. However, as correction will flush out stocks at better valuation, you should be prepared to buy into the market when the share prices are below their valuation. Good luck!


Chart: DJIA's daily chart as at Feb 2, 2018 (Source: Stockcharts.com)

Thursday, February 01, 2018

USD-MYR: Near-term Target 3.80

It is now quite well-accepted that our MYR is on a strengthening mode. There are a few reasons to explain the strengthening of our MYR, ranging from crude oil recovery to interest rate hike. The main reason is the steady growth of our economy at 5.5-5.6%.

The best way to figure out where USD-MYR is going is to look at the chart. Chart 1 below shows very clearly that USD-MYR broke below its uptrend line at 4.25 in September 2017. It went to a low of 4.17 and attempted to climb back to its uptrend line in November. It went as high as 4.24- missing the rising uptrend line at 4.33.


Chart 1: USD-MYR weekly chart from July 2013 to January 2018 (Source: Investing.com) 

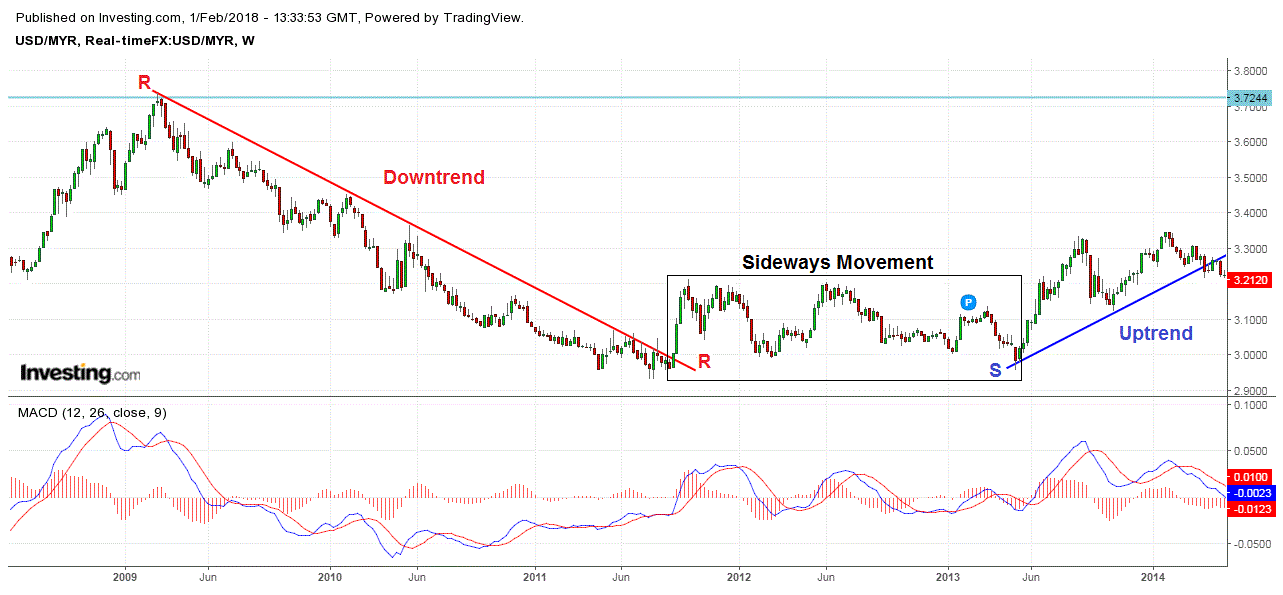
If you looked back at USD-MYR movement from 2008 to 2013, you would see the opposite, where USD-MYR broke above its downtrend line at 3.00 in September 2011. Here we are given a lesson in technical analysis which I would enumerate here:
1. The upside breakout of a downtrend line marks the end of the current downtrend.
2. The end of a downtrend means a significant bottom has been achieved; thus it is relatively safe to buy.
3. The end of a downtrend could lead to two possible scenarios- a sideways movement or an uptrend

The upside breakout of USD-MYR was followed by a sideways movement that lasted 23 months from September 2011 to July 2013.


Chart 2: USD-MYR weekly chart from July 2008 to June 2014 (Source: Investing.com) 

I am sharing this observation because there are some investors who feel that USD-MYR will continue to drop after the breakdown of the uptrend line as noted above. I believe that it is not a very likely scenario because Malaysian exporters would be badly affected if our MYR were to strengthen too rapidly. Thus I believe BNM will intervene in the forex market to slowdown the strengthening of our MYR, especially if the level of USD1 to MYR3.80 is threatened. That's the level that our MYR was pegged to the USD during the period of capital control from 1999 to 2005.

Astro: Earnings may get a Boost from WC2018

Results Update

For QE31/10/2017, Astro's net profit dropped 40% q-o-q or 3% y-o-y to RM147 million while revenue dropped 2% q-o-q and y-o-y to RM1.40 billion.

Revenue dropped y-o-y mainly due to a decrease in subscription, advertising and licensing revenue, offset by higher production revenue. The decrease in subscription revenue was mainly due to lower package take-up. The decrease in advertising revenue was due to subdued advertising market. The decrease in licensing revenue was due to loss of content recovery for sports channel.

Net profit decreased y-o-y due to decrease in EBITDA, which was offset with impairment of investment in associate of RM15.1 million in the corresponding quarter and lower net finance costs. Lower net finance cost was due to favorable unrealized forex gain arising from unhedged non-current balance sheet liabilities comprising, finance lease liabilities and vendor financing.
(Note: Astro's result for QE31/10/2017 was announced on December 6, 2017.)


Table 1: Astro's last 8 quarterly results


Graph: Astro's last 25 quarterly results

Prospect for FY2019

Being the main provider of live sport event, Astro is likely to get a boost from FIFA World Cup 2018. To compute the financial impact, I have compared the increase in revenue and  profit for the TV segment from FIFA World Cup 2014. We can see the TV segmental revenue & profit for 1H2015 increased by 13% and 28% respectively. Net profit rose by 25% from RM213 million to RM266 million in 1H2015.

Assuming the same level of increase were to happen in 1H2019, then revenue & segmental profit would increase to RM3.057 billion & RM764 million respectively while net profit would increase to RM552 million. Divided by total shares outstanding of 5214 million, 1H2019 EPS would be about 10.6 sen. Assuming 2H2019 EPS is about 6 sen, then Astro's full-year earning for FY2019 would be about 16.6 sen- giving the stock a prospective PER of 15.7times.


Table 2: Astro's forecast earning for 1H2019

Valuation

Astro (closed at RM2.60 on Thursday) is now trading at a trailing PE of 18 times (based on last 4 quarters' EPS of 14.09 sen). In addition, Astro paid out dividend quarterly which amounted to 12.50 sen for the last 4 quarters; giving the stock a decent DY of 4.8%. Based on the above PER and DY, Astro is fairly attractive.

Technical Outlook

Astro is transitioning from a downtrend to a sideways trend, with resistance from the line, XY and support from the line, AB.


 Chart: Astro's weekly chart as at Jan 30, 2018 (Source: Malaysiastock.biz)

Conclusion

I like to revise Astro's rating from a HOLD to a BUY based on steady financial performance, relatively attractive valuation & potential boost from WC2018.

Note:

I hereby confirm that I do not have any direct interest in the security or securities mentioned in this post. However, I could have an indirect interest in the security or securities mentioned as some of my clients may have an interest in the acquisition or disposal of the aforementioned security or securities. As investor, you should fully research any security before making an investment decision.

Tuesday, January 30, 2018

TMCLife: Earnings Continued to Rise

Background

TMCLife Sciences Bhd ("TMCLife') is essentially involved in the operation of the Tropicana Medical Centre, Kota Damansara, a 180-bedded medical centre that provides complete services for fertility, women & children health.


Source: hospitals-malaysia.org

Result Update

For QE30/11/2017, TMCLife's PBT rose 23% q-o-q or 36% y-o-y to RM8.3 million while revenue rose 6% q-o-q or 15% y-oy- to RM42 million. PBT rose q-o-q mainly due to higher revenue achieved and higher EBITDA margin 23% as compared to 20% in QE31/8/2017.


Table: TMCLife's last 9 quarterly results


Graph: TMCLife's last 9 quarterly results

Valuation

TMCLife (closed at RM0.84 yesterday) is now trading at a PE of 53 times (based on annualized EPS of 1.6 sen). Based on an earning CAGR of 58% last year, TMCLife's PEG ratio is marginally below 1x. That makes TMCLife a fairly attractive growth stock.

Technical Outlook

TMCLife is in a long-term uptrend line, SS with support at RM0.77. It peaked at RM0.99 in late 2016 and early 2017 and dropped back to test its uptrend line, SS in at RM0.73 in September 2017. With the share price below the 10-month SMA line and MACD below the MACD signal line, TMCLife share price may continue to drift lower.


Chart: TMCLIfe's monthly chart as at Jan 29, 2018 (Source: Malaysiastock.biz)

Conclusion

Based on improving financial performance, fairly attractive valuation for a growth stock and mildly positive technical outlook, TMCLife could still a good stock for long-term investment. Good entry will be below RM0.80.

Note:

I hereby confirm that I do not have any direct interest in the security or securities mentioned in this post. However, I could have an indirect interest in the security or securities mentioned as some of my clients may have an interest in the acquisition or disposal of the aforementioned security or securities. As investor, you should fully research any security before making an investment decision.

MPI: Earnings Pulled Back


Result Update

For QE31/12/2017, MPI's net profit rose 14% q-o-q but dropped 25% y-o-y to RM41 million while revenue rose 2% q-o-q but dropped 2% y-o-y to RM395 million. PBT rose q-o-q due to higher overall revenue which rose due to 12%-increase in the revenue from the Europe segment which more than offset the 5%-decline in revenue from the America segment while revenue from the Asian segment was flattish.


Table: MPI's last 8 quarterly results


Graph: MPI's last 44 quarterly results 

Valuation

MPI (closed at RM11.24 yesterday) is now trading at a trailing PER of 13.4 times (based on last 4 quarters' EPS of 85 sen). At this PER, MPI is deemed fairly valued. Its dividend yield is also decent at 2.6%.

Technical Outlook

MPI is in a long-term uptrend line, SS. However the share price has moved way above the uptrend line and appears to have formed a rounding top. If MPI breaks below RM10.70, it may slide to the psychological support of RM10.00; the next horizontal line at RM9.30 or the long-term uptrend line at RM8.70.


Chart: MPI's weekly chart as at Jan 29, 2018 (Source: Malaysiastock.biz)  

Conclusion

Albeit the weaker financial performance, MPI remains a good stock for long-term investment. As long as earnings uptrend remains intact - due to strong demand for semiconductor - MPI remains a HOLD. It can be a buying opportunity if share price were to drop to RM10.

Note:

I hereby confirm that I do not have any direct interest in the security or securities mentioned in this post. However, I could have an indirect interest in the security or securities mentioned as some of my clients may have an interest in the acquisition or disposal of the aforementioned security or securities. As investor, you should fully research any security before making an investment decision.

Monday, January 29, 2018

Astino: Uptrend May Continue

Result Update

In QE31/10/2017, Astino's net profit rose by 88% q-o-q or 71% y-o-y to RM9.5 million while its revenue rose by 12% q-o-q or 22% y-o-y to RM139 million. Revenue rose q-o-q primarily due to increase in local and oversea market demand.  PBT rose q-o-q mainly due to increase in sales and profit margin.

Astino's financial performance recovered from the sharp q-o-q drop in both revenue & profits in QE31/7/2017. In that quarter, revenue dropped q-o-q due to decrease in local market demand. PBT dropped q-o-q mainly due to allowance for diminution in value of inventories amounted to RM5.2 million and decrease in gross profit margin.

(Note: The results for QE31/10/2017 was announced on Dec 28, 2017.)


Table: Astino's last 8 quarters' results


Graph: Astino's last 42 quarters' results

Financial Position

Astino's financial position as at 31/10/2017 is deemed healthy with current ratio at 3.1x and gearing ratio at 0.3x.

Valuation

Astino (closed at RM1.10 last Friday) is now trading at a trailing PER of 7.9x (based on last 4 quarters' EPS of 14.03 sen). At this PER, Astino is deemed reasonably valued.

Technical Outlook

Astino is in a long-term uptrend. Its recent peak was in July 2017 and thereafter the share price dropped due to poorer financial performance. See the monthly chart below.


Chart 1: Astino's monthly chart as at Jan 26, 2018 (Source: Malaysiastock.biz)

In early January, Astino broke above its intermediate downtrend line, RR at RM1.00-1.02. This may signal the start of its recovery. See the daily chart below.


Chart 2: Astino's daily chart as at Jan 26, 2018 (Source: Malaysiastock.biz)

Conclusion

Based on improved financial performance, reasonable valuation and mildly bullish technical outlook, Astino could be a good stock for long-term investment.

Note:

I hereby confirm that I do not have any direct interest in the security or securities mentioned in this post. However, I could have an indirect interest in the security or securities mentioned as some of my clients may have an interest in the acquisition or disposal of the aforementioned security or securities. As investor, you should fully research any security before making an investment decision.

Pantech: Earnings dipped sequentially


Result Update

For QE30/11/2017, Pantech's net profit dropped 14% q-o-q but rose 57% y-o-y to RM10 million while its revenue unchanged q-o-q but rose 58% y-o-y to RM157 million. Net profit dropped q-o-q mainly due to the trading mix and foreign exchange currency loss.


Table: Pantech's last 8 quarterly results


Graph: Pantech's last 44 quarterly results

Valuation

Pantech (closed at RM0.635 last Friday) is now trading at a PE of 10 times (based on last 4 quarters' EPS of 6.37 sen). Dividend yield is decent at 3.9%. At these multiples, Pantech is priced fairly for a stock in the O&G sector where recovery is progressing slowly.

Technical Outlook

Pantech is in a large trading range, with a slight upward biasness. However, it is in an intermediate uptrend line, with support at RM0.63.


Chart 1: Pantech's monthly chart as at Jan 26, 2018 (Source: Malaysiastock.biz)


Chart 2: Pantech's daily chart as at Jan 26, 2018 (Source: Malaysiastock.biz)

Conclusion

Based satisfactory financial performance, fair valuation and mildly bullish technical outlook, Pantech is a good stock for long-term investment.

Note:

I hereby confirm that I do not have any direct interest in the security or securities mentioned in this post. However, I could have an indirect interest in the security or securities mentioned as some of my clients may have an interest in the acquisition or disposal of the aforementioned security or securities. As investor, you should fully research any security before making an investment decision.

Thursday, January 25, 2018

Sasbadi- Earnings Recovered

Background

Sasbadi Holdings Bhd ("Sasbadi") is a publisher of educational materials, undertaking print publishing as well as online publishing of educational materials based on the Malaysian National School Curriculum.  It is also involved in the distribution of applied learning products - miniature building blocks and mechanical, electrical and electronic components, as well as devices for measuring and analysing live signals, and software to create measurement and control systems - designed to provide hands-on learning experience to students. 

Diagram: Sasbadi's Main Businesses

Result Update

For QE30/11/2017, Sasbadi reported to a net profit of RM4.4 million as compared to a net loss of RM4.2 million in the immediate preceding quarter (QE31/8/2017). The turnaround was due to higher revenue & lower operating expenses.

The poor performance in QE31/8/2017 was due to a drop in revenue from the academic publishing subsidiaries d- partially due to a seasonally weaker quarter as well as weaker retail market. This decline was only partially offset by the increase in revenue of the online/digital products division - leading to an overall drop in revenue. In addition, the group incurred higher operating costs in QE31/8/2017 due to the consolidation of the United Publishing Group's full quarter results, impairment loss on trade receivables, and increased interest expense arising from higher gearing.

(Note: This latest quarterly result was announced on Jan 18.)


Table: Sasbadi's last 8 quarters' financial performance


Graph: Sasbadi's last 14 quarters' financial performance

Financial Position

As at 30/11/2017, Sasbadi's financial position is deemed satisfactory with current ratio at 3.1x and gearing ratio at 0.50x.

Valuation

Sasbadi (closed at RM0.605 yesterday) is now trading at a trailing PER of 21 times (based on last 4 quarters' EPS of 2.89 sen). However, if we were to exclude the exceptional loss from QE31/8/2017, the 4 quarters' EPS could be raised to 5.0-5.5 sen. Based on a full year EPS of 5 sen, Sasbadi's PER would be 12 times. At this adjusted PER of 12 times, Sasbadi looks fairly attractive.

Technical Outlook

Sasbadi share price is moving within a large expanding triangle. As noted in the past, an expanding triangle is an unusual price pattern where the bulls get more bullish over times while the bears get more bearish as well. At some point, the stalemate must be resolved. Failing which, the share price will move sideways or begin to converge. If we make the fair assumption that the price will stay within the triangle, then the next likely movement is for the share price to rise up to the middle line. Thus the stock could be a good buy at the current price of RM0.60.


Chart: Sasbadi's weekly chart as at Jan24, 2018 (Source: Malaysiastock.biz)

Conclusion

Based on satisfactory financial performance & position and reasonable valuation, Sasbadi is a good stock for long-term investment.

Note:
I hereby confirm that I do not have any direct interest in the security or securities mentioned in this post. However, I could have an indirect interest in the security or securities mentioned as some of my clients may have an interest in the acquisition or disposal of the aforementioned security or securities. As investor, you should fully research any security before making an investment decision.

Wednesday, January 17, 2018

ANNJOO: At the Uptrend Line!

In the past 2 years, Annjoo enjoyed a price run-up of more than 6 folds, from 60 sen to almost RM4.00. This makes Annjoo the best performing steel producer in our market.

Annjoo's share price has pulled back to its uptrend line in the current correction. If you stick to the rule that a trend remains intact until it has reverse, then this would be a buying opportunity. While indicators - like ADX & MACD - are cautioning against possible break of the uptrend line, until that has happened the trend remains intact.    


Chart 1: ANNJOO's weekly chart as at Jan 16, 2018 (Source: Malaysiastock.biz)

Why did Annjoo drop so much in the past 2 weeks? The drop in Annjoo's share price could be due to the correction in steel rebar prices in China in the past 2 months. Rebar prices peaked at 4950 yuan in December last year, and is now trading at 3800 yuan- a drop of 25%!


Chart 2: China Steel Rebar Price chart as at Jan 16, 2018 (Source:Sunsirs.com)

Is this a short-term correction or has steel rebar prices peaked? Looking at the chart below, we can see that the last 2 years rally is fairly similarly to the 200-2008 rally which ended during the Global Financial Crisis. While there is no crisis on the horizon, a reversal in the price uptrend could lead to lower steel prices and lower earning for steel companies.


Chart 3: Global Steel Rebar Price chart as at Jan8, 2018 (Source: Steelbenchmarker.com)

Based on the above, we must be careful to avoid over-exposing ourselves to a sector that's in peak earning today. As for Annjoo, you would have to monitor closely and be prepared to take the necessary action to reduce your position in the event the share price breached the uptrend line at RM3.60.

Thursday, January 11, 2018

Market Outlook as at January 11, 2017

As at 12.05pm, FBMKLCI was down 8 points to 1815. The scoreboard showed 180 gainers to 730 losers. Many investors who wanted a correction after a strong rally, seem to have second thoughts. It all goes to show that no one wants correction. Period!

Looking at the daily chart, I believe that this correction has gone far enough to whine off excessive bullishness that we saw over the past 2 weeks. I believe FBMKLCI will soon find support at the 10-day SMA line at 1807. Failing which, it may test the psychological 1800 level. If the index is going into its next upleg, that market should stabilize by then.


Chart 1: FBMKLCI's daily chart as at Jan 11, 2018_12.05 (Source: Shareinvestor.com)

Looking at the weekly chart, we can see that FBMKLCI has broken above the intermediate downtrend line, RR that stretches back to 2014. This breakout is the reason for the strong rally in the past 2 weeks. The correction has set in after the index hit the parallel line, R1-R1 at 1820.


Chart 2: FBMKLCI's weekly chart as at Jan 10, 2018(Source: Shareinvestor.com)

Based on the bullish breakout of the intermediate downtrend line, R1-R1 and my earlier market expectation, I think that this correction is an opportunity to buy or add to your position to ride the upleg. Good luck!

Monday, January 08, 2018

Evergrn: Awaiting Earnings Recovery

Results Update

In QE30/9/201, Evergrn's net profit rose 144% q-o-q but dropped 11% y-o-y to RM15.1 million while revenue rose 0.4% q-o-q or 7% y-o-y to RM260 million. Its  revenue increased q-o-q mainly due to commercial run of new Particle Board Plant in Segamat. Its profit before tax increased q-o-q mainly due to production efficiency and effective cost measures of new Particle Board Plant in Segamat.


Table: Evergrn's last 8 quarters' financial performance


Graph: Evergrn's last 51 quarters' financial performance

Financial Position

As at 30/9/2017, Evergrn's financial position is deemed satisfactory with current ratio at 2.05 times and gearing ratio at 0.34 time.

Valuation

Evergrn (closed at RM0.69 last Friday) is now trading at a trailing PER of 12 times (based on last 4 quarters' EPS of 5.87 sen. At this PER, Evergrn is still deemed fairly valued.

Technical Outlook

Evergrn has been in a slow decline after it peaked at RM1.68 in January 2016. The decline takes the form of a downward channel, with the lower line at RM0.65 providing support. 


Chart: Evergrn's weekly chart as at Jan 5, 2017 (Source: Malaysiastock.biz)

Conclusion

Based on satisfactory financial performance & position and reasonable valuation, Evergrn is a good stock for long-term investment. However, its share price recovery will only begin once earnings begin to improve noticeably.

Note:
I hereby confirm that I do not have any direct interest in the security or securities mentioned in this post. However, I could have an indirect interest in the security or securities mentioned as some of my clients may have an interest in the acquisition or disposal of the aforementioned security or securities. As investor, you should fully research any security before making an investment decision.

Sunday, January 07, 2018

Market Outlook as at Jan 9, 2018

For the past 2 weeks, the market has been so charged up that many investors are blindsided and left standing at the sideline. Many are like the bears that had recently awaken from their hibernation, and standing in the Adams River in a full-blown salmon run. 

Today I will not talk about what stocks to buy. You have to look through the charts to get ideas on trading or investing. FBMKLCI has broken above the June 2017 high of 1795 as well as the psychological 1800 level. While correction may come any time now - and correction is not a bad thing - I believe any correction will not be long and deep. The market has an appointment to meet: 1900 sometime this year. That's not all! I believe that our market could potentially peak only in 2019. See my earlier market outlook (here).


Chart 1: FBMKLCI's daily chart as at Jan 6, 2018 (Source: Shareinvestor.com) 


Chart 2: FBMKLCI's monthly chart as at Jan 6, 2018 (Source: Shareinvestor.com) 

My July 2017 bullish market outlook is predicated on two assumptions:
1. US markets, which are at all time high, shall avoid a crash.
2. MYR shall avoid another bout of weakening.

From Chart 3 below, we can see that USD-MYR is now in a downtrend, with MACD below the zero line and the +DMI  and ADX are rising fast.


Chart 3: USD-MYR's weekly chart as at Jan 6, 2018 (Source: Investing.com) 

Some investors believe that MYR recovery is due to the improvement in crude oil prices. This may be true, and we can see that Brent crude oil prices are on a steady increase. However I believe the USD67-69 will be a strong resistance which may cap price rise for the next 2-3 months.


Chart 4: Brent's weekly chart as at Jan 6, 2018 (Source: Investing.com) 

If you are sitting on a pile of cash, this is a good time to lose the cash. By that, I mean you deploy your cash quickly in the market. Good luck!!

Tuesday, January 02, 2018

Harta: Earnings Shot Up!!

Result Update

For QE30/9/2017, Harta's net profit rose 18% q-o-q or 59% y-o-y to RM113 million while revenue was mixed - down 3% q-o-q but up 34% y-o-y - to RM585 million. Revenue dropped q-o-q mainly due to lower average selling price arising from more competitive pricing but the sales volume increased by 5.2% due to increase in demand. PBT rose q-o-q mainly due to lower nitrile and latex cost, lower chemical cost and improvement in operation efficiency.


 Table: Harta's last 8 quarterly results


Graph: Harta's last 40 quarterly results

Valuation

Harta (closed at RM10.68 last Friday) is trading at a trailing PER of 48 times (based on last 4 quarters' EPS of 22.21 sen). At this PER, Harta has surpassed Nestle in term of trailing PER. At RM103.20, Nestle's trailing PER is now at 42 times!

Technical Outlook

Harta broke above a upward "Cup with handle" formation at RM7.80. Assuming a 1-to-1 extension, Harta should reach a high of RM10.20. Well it did better than that. It overshot the RM11.00 before correction set in. How long will correction last? Only time will tell.


Chart: Harta's weekly chart as at Dec 29, 2017 (Source: Malaysiastock.biz)

Conclusion

Based on improved operating performance, strong leadership in the glove sector and capable management team, Harta is considered a good stock for long-term investment. Its rating is kept at HOLD due to its demanding valuation.

Note:
I hereby confirm that I do not have any direct interest in the security or securities mentioned in this post. However, I could have an indirect interest in the security or securities mentioned as some of my clients may have an interest in the acquisition or disposal of the aforementioned security or securities. As investor, you should fully research any security before making an investment decision.

Saturday, December 23, 2017

Merry Christmas

I like to wish everyone Merry Christmas and Happy New Year. I will be on leave for the next few days, and I won't be posting anything for the rest of the week.


via 123rf.com


D&O: Bullish Breakout

Background

D&O Green Technologies Bhd ("D&O") is involved in the semiconductor industry in various capacity such as provision of full trunkey contract manufacturing, manufacturing of semiconductor components and machinery, investing in semiconductor business in China and merchandising of semiconductors components.

Historical Financial Performance

D&O's profits have been rising steadily for the past 3 years.


Graph 1: D&O's last 10 yearly results

Recent Financial Results

In QE30/9/2017, net profit rose 81% q-o-q or 167% y-o-y to RM6.7 million while revenue rose 8% q-o-q or 7% y-o-y to RM111 million.


Graph 2: D&O's last 10 quarterly results

Latest Financial Position

As at 30/9/2017, Financial position is deemed satisfactory with current ratio at 1.77 times and gearing ratio at 0.81 times.

Valuattion

D&O (closed at RM0.745 as at Dec 22) is now trading at a trailing PER of 38 ttimes (based on last 4 quarters' EPS of 1.94 sen). At this PER, D&O is deemed fully valued.

Technical Outlook

 D&O broke above its ascending triangle at RM0.71 as well as its recent high of RM0.73. With this double breakout today, the stock is expected to continue with its prior uptrend.


Chart 1: D&O's daily chart as at Dec 22, 2017 (Source: Malaysiastock.biz)


Chart 2: D&O's weekly chart as at Dec 22, 2017 (Source: Malaysiastock.biz)

Conclusion

Despite fully valued, D&O is a good stock to long-term investment. In the short to medium-term, the stock may benefit from the strong global demand for semi-conductor. I believe the technical outlook is bullish and it is now a good trading BUY.

Note:

I hereby confirm that I do not have any direct interest in the security or securities mentioned in this post. However, I could have an indirect interest in the security or securities mentioned as some of my clients may have an interest in the acquisition or disposal of the aforementioned security or securities. As investor, you should fully research any security before making an investment decision.

Wednesday, December 20, 2017

Topglov: Revenue & Profits soared

Results Update

For QE30/11/2017, Topglov's net profit rose 7% q-o-q or 44% y-o-y to RM105 million while revenue rose 4% q-o-q or 19% y-o-y to RM938 million. Topglov attributed its outstanding performance to a 8%-growth in Sales Volume (due to strong demand growth); improvements in production efficiency & quality, and the coming on-stream of new capacity. It is a very exciting time for Topglov as its revenue closes in on the RM1 billion mark for quarterly revenue just as it surpasses the RM100 million mark for quarterly net profit.

 
Table: Topglov's last 8 quarterly results


Graph: Topglov's last 46 quarterly results

Valuation

Topglov (closed at RM7.48 yesterday) is now trading at a trailing PE of 26X (based on last 4 quarters' EPS of 29 sen). At this PER, Topglov is deemed fairly valued.

Technical Outlook

Yesterday, Topglov rallied past its recent high of RM7.05 and rose to RM7.48. The breakout of the RM7.05 level is also significant in another level because that level was close to the all-time high recorded in late 2016. Thus, Topglov is now entering blue-sky territory. It is possible to go to RM9.00.


Chart 1: Topglov's daily chart as at Dec 19, 2017 (Source: Malaysiastock.biz)


Chart 2: Topglov's weekly chart as at Dec 19, 2017 (Source: Malaysiastock.biz)

Conclusion

Based on improved financial performance and positive technical outlook, I think Topglov is poised to go higher. 

Note:

I hereby confirm that I do not have any direct interest in the security or securities mentioned in this post. However, I could have an indirect interest in the security or securities mentioned as some of my clients may have an interest in the acquisition or disposal of the aforementioned security or securities. As investor, you should fully research any security before making an investment decision.