Sunday, June 30, 2019

Astino: Earnings Improved Sequentially

Result Update

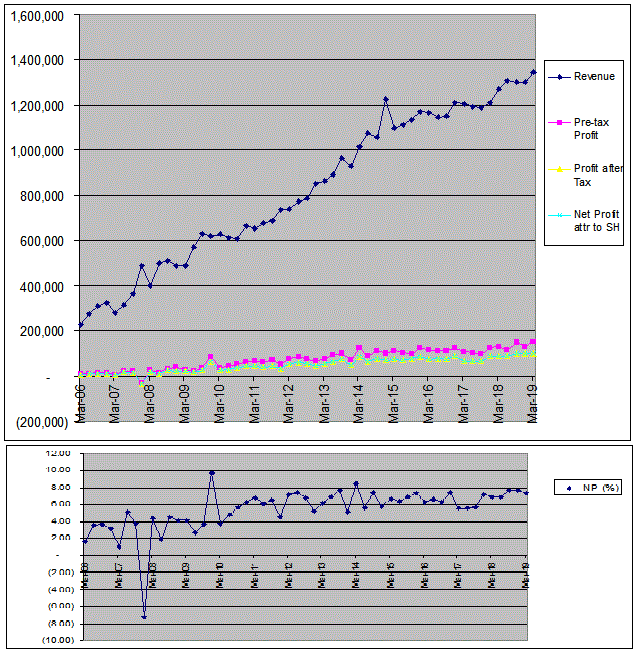
In QE30/4/2019, Astino's net profit rose 35% q-o-q but dropped 2% y-o-y to RM8.6 million while its revenue dropped 6% q-o-q but rose 4% y-o-y to RM141 million. Revenue dropped q-o-q primarily due to decrease in local demand from RM130.1 million in preceding quarter to this quarter RM120.8 million. The Group’s profit before taxation rose to RM10.9million from RM9.6 million recorded in the preceding quarter- mainly due to decrease of allowance for diminution in value of inventories.


Table: Astino's last 8 quarters' results


Graph: Astino's last 48 quarters' results

Financial Position

Astino's financial position as at 30/4/2019 is deemed healthy with current ratio at 2.3x and gearing ratio at 0.4x.

Valuation

Astino (closed at RM0.685 last Friday) is now trading at a trailing PER of 9.1x (based on last 4 quarters' EPS of 7.55 sen). At this PER, Astino is deemed fairly valued.

Technical Outlook

Astino is still in a long-term uptrend (see Chart 1). It peaked at RM1.26 in July 2017 and thereafter the share prices have been in a slow decline due to poorer financial performance. An upswing can only begin if Astino can surpass its intermediate downtrend line, RR at RM0.70 (see Chart 2).


Chart 1: Astino's weekly chart as at Jun 28, 2018 (Source: Malaysiastock.biz)


Chart 2: Astino's daily chart as at Jun 28, 2018 (Source: Malaysiastock.biz)

Conclusion

Based on improved financial performance, satisfactory financial position, fair valuation and mildly bullish technical outlook, Astino could be a good stock for long-term investment.

Note:

I hereby confirm that I do not have any direct interest in the security or securities mentioned in this post. However, I could have an indirect interest in the security or securities mentioned as some of my clients may have an interest in the acquisition or disposal of the aforementioned security or securities. As investor, you should fully research any security before making an investment decision.

Market Outlook as at July 1, 2019

Following the "successful G20 meeting" where Trump behaved rationally, global stock markets will likely put in a strong rally next week. As for our market, we will likely to participate in this rally as FBMKLCI has consolidated for the whole of last week after it broke above its downtrend line, RR at 1665 on June 20. Good luck to your trading or investing next week!!   

Chart: FBMKLCI's daily chart as at Jun 28, 2019 (Source: Malaysiastock.biz)


Thursday, June 27, 2019

Scientx: Earnings Grew Due to Contribution from Newly-Acquired Daibochi

Result Update

For QE30/4/2019, Scientx's net profit dropped 1% q-o-q but rose 19% y-o-y to RM73 million while revenue was rose 8% q-o-q or 38% y-o-y to RM828 million. The Group’s revenue rose q-o-q mainly due to contribution from the newly acquired subsidiary, Daibochi. Profit before tax for the current financial quarter was RM101.4 million, a marginal increase of 1.4% compared to RM100.0 million recorded in the preceding financial quarter.


Table: Scientex's last 8 quarterly results


Graph: Scientex's last 53 quarterly results

Financial Position

As at 30/4/2019, Scientex's financial position is deemed satisfactory with current ratio at 1.2 times and gearing ratio at 0.72 time.

Valuation

Scientex (closed at RM8.56 yesterday) is now trading at a trailing PE of 14.7 times (based on last 4 quarters' EPS of 58.43 sen). At this PER, Scientex is deemed fairly attractive.

Technical Outlook

Scientx was in an uptrend line, SS which accelerated in a steep uptrend lien, S1-S1 in 2016 & 2017. The share price then broke this steep uptrend line, S1-S1 and tentatively established a more gradual uptrend line, S1-test the uptrend line, S1-S2 at RM7.50.


Chart 1: Scientex's weekly chart as at Jun 26, 2019 (Source: Malaysiastock.biz)


Chart 2: Scientex's monthly chart as at Jun 26, 2019 (Source: Malaysiastock.biz)

Conclusion

Based on good financial performance, strong financial position, fairly attractive valuation and mildly positive technical outlook, Scientex remains a good stock for medium to long-term investment.

Note:
I hereby confirm that I do not have any direct interest in the security or securities mentioned in this post. However, I could have an indirect interest in the security or securities mentioned as some of my clients may have an interest in the acquisition or disposal of the aforementioned security or securities. As investor, you should fully research any security before making an investment decision.

Wednesday, June 26, 2019

Redtone: Revenue and PBT Continued to Rise

Result Update

For QE310/4/2019, Redtone's net profit dropped 11% q-o-q but rose 53% y-o-y to RM4.8 million while revenue rose 62% q-o-q or 132% y-o-y to RM73 million. Revenue rose q-o-q mainly due to higher revenue from Managed Telecommunication Network Services ("MTNS") segment.


Table: Redtone's last 8 quarterly results


Graph: Redtone's last 33 quarterly results

Financial Position

As at 30/4/2019, Redtone's financial position is healthy with current ratio at 2.5 times and gearing ratio at 0.5 time.

Valuation

Redtone (closed at RM0.305 yesterday) is now trading at a trailing PE of 15 times (based on last 4 quarters' EPS of 2.01 sen).  At this PE, Redtone is still deemed attractive for a turnaround stock with room for further growth.

Technical Outlook

Redtone is trying to stay above its long-term downtrend line, RR as well as its intermediate uptrend line, RR- both at RM0.29.


Chart 1: Redtone's weekly chart as at Jun 25, 2019 (Source: Malaysiastock.biz)


Chart 2: Redtone's daily chart as at Jun 25, 2019 (Source: Malaysiastock.biz)

Conclusion

Based on improved financial performance, healthy financial position and mildly bullish technical outlook, Redtone could be a good stock for long-term investment.

Note:

I hereby confirm that I do not have any direct interest in the security or securities mentioned in this post. However, I could have an indirect interest in the security or securities mentioned as some of my clients may have an interest in the acquisition or disposal of the aforementioned security or securities. As investor, you should fully research any security before making an investment decision.

Thursday, June 20, 2019

Market Outlook as at June 19, 2019

Yesterday FBMKLCI rose 13.78 points (or 0.83%) to close at 1666.54. Gainers out-numbered losers 474 to 330, with 405 counters traded unchanged.

FBMKLCI has gone marginally above the intermediate downtrend line, RR at 1665. Though unconvincing, this upside breakout could signal the end of the past 1 year downtrend. What comes next will either be a sideways market or an uptrend. With the Malaysian economy in doldrums and our political scene in a state of confusion, it is hard to believe a bullish market will emerge. 

Let's wait and see.

Chart: FBMKLCI's daily chart as at June 19, 2019 (Source: Malaysiastock,.biz)

Wednesday, June 19, 2019

Topglov: Bottom-line plunged

Results Update

For QE31/5/2019, Topglov's net profit dropped 29.4% q-o-q or 36.5% y-o-y to RM74.7 million while revenue rose 2.6% q-o-q or 8.1% y-o-y to RM1.190 billion. Revenue increased due to 2%-increase in Sales Volume plus increase in ASPs.

Meanwhile, Profit Before Tax and Profit After Tax eased by 34.5% and 29.5% respectively. This was attributed to a 22% surge in the price of natural rubber latex compared with QE28/2/2019, coupled with strong competition as well as the time lag in passing on cost to customers, which affected the natural rubber glove profit contribution. However, the situation has improved from May 2019 onwards due to the effect of selling price revision. The nitrile latex price decreased slightly by 3.1% to USD1.05/kg, which mitigated the impact from competition in nitrile glove segment.

 
Table: Topglov's last 8 quarterly results


Graph: Topglov's last 50 quarterly results

Valuation

Topglov (closed at RM4.87 yesterday) is now trading at a trailing PE of 32 times (based on last 4 quarters' EPS of 15.35 sen). At this PER, Topglov is deemed overvalued.

Technical Outlook

Topglov dropped sharply yesterday after the release of its poor result during the mid-day break. The price tested the medium-term uptrend line, S1-S1 at RM4.65 before it recovered to close at RM4.87. It is possible that Topglov may re-test the medium-term uptrend line again given the sharp decline in earnings last quarter. If the medium-term uptrend line, S1-S1 cannot hold, the next support will be the horizontal line at RM4.20.


Chart 1: Topglov's daily chart as at June 18, 2019 (Source: Malaysiastock.biz)


Chart 2: Topglov's weekly chart as at June 18, 2019 (Source: Malaysiastock.biz)

Conclusion

Based on weaker financial performance and high valuation, I revise my rating for Topglov to a Trading Sell. A good sale would be closer to RM5.00 and a good re-entry price would be below RM4.50.

Note:

I hereby confirm that I do not have any direct interest in the security or securities mentioned in this post. However, I could have an indirect interest in the security or securities mentioned as some of my clients may have an interest in the acquisition or disposal of the aforementioned security or securities. As investor, you should fully research any security before making an investment decision.

Tuesday, June 04, 2019

Selamat Hari Raya Aidilfitri

I wish all my readers a joyous and blessed Hari Raya Aidilfitri.


via KuchingOnline.com

Sunday, June 02, 2019

Market Outlook as at June 3, 2019

Our market had 4 good days last week. FBMKLCI rose ~50 points from 1601 on Tuesday to 1650 on Friday. The gain was brought on by selective buying of blue chip stocks, especially Tenaga, PBBank, Axiata and Digi. However, we saw limited participation by retail players, which explains why the scoreboard remained unimpressive.

Looking at the weekly chart, we can see FBMKLCI has yet to cross the 2 lines connecting the troughs/lows from 2010 till today. The lower line connects the extreme troughs/lows while the upper line connect closing index. 

Chart 1: FBMKLCI's weekly chart as at May 31, 2019 (Source: Malaysiastock.biz)

The immediate resistance for FBMKLCI will be the lower of the 2 lines connecting the last 9 years' troughs/lows, at 1665. The next resistance will be the upper line of the downward wedge, ABCD at 1675. For FBMKLCI to break above these 2 resistance levels, we need market participation to broaden out next week. Since it will be a short trading week - with Tuesday being a half-day and Wednesday & Thursday being holidays - I believe the market will be very quiet.


Chart 2: FBMKLCI's daily chart as at May 31, 2019 (Source: Malaysiastock.biz)

As noted in the previous market outlook, a correction in the U.S. markets could help to channel funds to emerging markets, such as ours. You may use the quiet market to do some bargain hunting. Good luck!

Crude Oil Prices Have Room to Fall

Brent crude oil prices broke below the 200-day SMA line at USD70 on May 24. The rebound on Monday & Tuesday failed to push the price above the 200-day SMA line. In the last 3 days, Brent dropped from ~USD68 to ~USD62.

Chart 1: Brent's daily chart as at May 31, 2019 (Source: Stockcharts.com)

Looking at the 2-year daily chart (below), we can see that Brent is poised to go lower. MACD has gone below the zero line and -DMI has crossed above +DMI (with ADX trending higher). 

Chart 2: Brent's daily chart as at May 31, 2019 (Source: Stockcharts.com)

While Brent may find support at horizontal lines at USD61.00 and USD58.00, the strong support will likely be at the line connecting the past 3 years low, AB at USD52.00.

 
Chart 3: Brent's weekly chart as at May 31, 2019 (Source: Stockcharts.com)

According to various report, the decline in crude oil was driven by surging U.S. stockpile and economic concerns which are brought on by the reckless behavior of the current U.S. administration (here).

Thursday, May 30, 2019

TM & BAT: Different Strokes for Different Stocks

During the lunch break, TM announced its results for QE31/3/2019. Its net profit rose 342% q-o-q or 96% y-o-y to RM308 million. Revenue dropped 10% q-o-q or 2% y-o-y to RM2.779 billion. As at 3.30 pm, TM share price rose 61 sen (or 22%) to RM3.33.

Table 1: TM's 8 quarters' P&L

Looking at the slightly weaker revenue and the big jump in profits which came after a big drop 2 quarters ago, the excitement about TM's performance looks unjustified.


Graph 1: TM's 45 quarterly P&L

On the other hand, BAT has undergone the opposite treatment when it announced its result for QE31/3/2019 after market close on May 28. On opening the next day (May 29), BAT (closed at RM33.44 the day before) started dropping. As at 3.30 pm today, BAT was trading at RM28.94. In total, BAT lost 13.5%.


Table 12; BAT's 8 quarters' P&L


Graph 2: BAT's 45 quarterly P&L

In my opinion, TM is over-rewarded for the "good" result while BAT is over-punished for the "bad" result.

Tuesday, May 28, 2019

Market Outlook as at May 28, 2019

FBMKLCI has managed to stay above the 1600 psychological level in the past 2 weeks. With each passing day, it looks more likely that this psychological level can withstand the selling. Thus the index and market may have a decent chance of recovery from here.

Chart 1: FBMKLCI's weekly chart as at May 28, 2019_9.20am (Source: Malaysiastock.biz)

When we compare FBMKLCI with S&P500, we can see that when S&P500 rallied strongly and FBMKLCI went the opposite direction (in September to November 2017), the subsequent pullback in S&P500 coincided with a strong rally in FBMKLCI. If this were to repeat, a possible pullback in S&P500 in the weeks ahead could be followed by a decent recovery rally in FBMKLCI.


Chart 2: S&P500 and FBMKLCI's weekly chart as at May 27, 2019 (Source: Stockcharts.com & Malaysiastock.biz) 
Update: I have subsequently added in the arrows to highlight the above comment.

Let's wait & see how our market will perform in this tumultuous time of trade war between the US and China.

US Market Outlook as at May 24, 2019

DJIA has made a temporary top and turned mildly bearish based on the following:
1) 20-day SMA line has crossed below the 50-day SMA line,
2) MACD has gone below the zero line, and
3) -DMI is above the +DMI coupled with ADX above the 20-mark. 

 
Chart 1: DJIA's daily chart as at May 24, 2019 (Source: Stockcharts.com)

Nasdaq & S&P500 indices are also turning bearish though their 20-day SMA lines have yet to cut below the 50-day SMA lines.

Chart 2: Nasdaq's daily chart as at May 24, 2019 (Source: Stockcharts.com)


Chart 3: S&P500's daily chart as at May 24, 2019 (Source: Stockcharts.com)

Watch out for US markets this week!

Sunday, May 26, 2019

Kossan: Earnings Improved y-o-y

Result Update

For QE31/3/2019, Kossan's net profit declined 1% q-o-q but rose 30% to RM59 million while revenue dropped 5% q-o-q but rose 16% y-o-y to RM561 million.

Group’s revenue dropped 5% q-o-q to RM561 million while profit before tax (PBT) rose 5% q-o-q to RM75.08 million. The higher PBT was attributable to the improved earnings of the Gloves division. The Gloves division recorded a 4.3%-decline in revenue q-o-q to RM497 million but its PBT rose 8.7% to RM68 million due to continued strong demand for the Group’s glove products, with higher volume sold (+4.68%) as compared with 4Q18.

The TRPs division recorded a 7%-decline in revenue to RM47 million, while PBT decreased 19%  to RM7 million mainly due to lower deliveries and increase in raw material prices (SMR10 +8.16%). The Cleanroom division recorded lower revenue and lower PBT of RM17 million and RM0.6 million respectively in 1Q19, as compared with RM19 million and RM1.1 million in 4Q18.


Table: Kossan's last 8 quarterly results


Graph: Kossan's last 51 quarterly results

Financial Position

Kossan's financial position as at 31/3/2019 is deemed healthy with current ratio at 1.7 times while gearing ratio was at 0.6 time.

Valuation

Kossan (closed at RM3.82 last Friday) is now trading at a PE of 22.6 times (based on last 4 quarters' EPS of 16.9 sen). At this PER, Kossan is deemed fairly valued.

Technical Outlook

Kossan is in a long-term uptrend line, SS with support at RM3.65. In addition, it is trading very close to its 40-month SMA line (about equivalent to the 200-day SMA line). Its immediate resistance is the psychological RM4.00 mark.


Chart: Kossan's monthly chart as at May 24, 2019 (Source: Malaysiastock.biz)

Conclusion

Based on good financial performance and financial position, fair valuation & positive technical outlook, Kossan is a good stock for long-term investment.

Note: 

I hereby confirm that I do not have any direct interest in the security or securities mentioned in this post. However, I could have an indirect interest in the security or securities mentioned as some of my clients may have an interest in the acquisition or disposal of the aforementioned security or securities. As investor, you should fully research any security before making an investment decision.

MPI: Earnings plummeted

Result Update

For QE31/3/2019, MPI's net profit dropped 57% q-o-q or 35% y-o-y to RM17 million while revenue dropped 17% q-o-q or 10% y-o-y to RM330 million. PBT dropped 58% q-o-q due to lower overall revenue which dropped across the board as follows: 11% in Europe segment, 19% in Asia segment and 22% in the America segment.


Table: MPI's last 8 quarterly results


Graph: MPI's last 44 quarterly results 

Financial Position

As at 31/3/2019, MPI's financial position is deemed healthy with current ratio at 4.2 times and gearing ratio at only 0.2 time.

Valuation

MPI (closed at RM8.80 last Friday) is now trading at a trailing PER of 12 times (based on last 4 quarters' EPS of 72 sen). At this PER, MPI is deemed fairly valued.

Technical Outlook

MPI is in a long-term uptrend line, SS at RM8.80. If this uptrend line is broken, MPI's next support will be at the horizontal line at RM8.30.


Chart: MPI's weekly chart as at May 24, 2019 (Source: Malaysiastock.biz)  

Conclusion

Despite the weaker financial performance, I would rate MPI as a HOLD based on healthy financial position, fairly attractive valuation & still positive technical outlook. However, if the share price were to breach the uptrend line, my rating will be revised from HOLD to REDUCE.

Note:

I hereby confirm that I do not have any direct interest in the security or securities mentioned in this post. However, I could have an indirect interest in the security or securities mentioned as some of my clients may have an interest in the acquisition or disposal of the aforementioned security or securities. As investor, you should fully research any security before making an investment decision.

Friday, May 24, 2019

MBMR: Earnings rose y-o-y

Results Update

For QE31/3/2019, MBMR's net profit dropped 17% q-o-q but rose 51% y-o-y to RM50 million while revenue rose 7% q-o-q or 15% y-o-y to RM532 million. Revenue increased mainly due to better performance from both the Motor Trading and Auto Parts Manufacturing Divisions, as well as better results for both the joint venture and the associates. The Group's share of results in its joint venture increased by RM0.5 million or 16.3% to close at RM3.9 million mainly due to higher demand. The Group's share of associates' results increased by RM6.0 million or 16.4% against the corresponding quarter to close at RM42.8 million.


Table: MBMR's last 8 quarterly results


Graph: MBMR's 52 quarterly results

Financial Position

As at 31/3/2019, MBMR's financial position is healthy with current ratio at 2.4 times and gearing ratio at 0.15 time.

Valuation

MBMR (closed at RM2.80 yesterday) is now trading at a PER of 6 times (based on EPS of 46.7 sen). At this PER, MBMR is fairly attractive.

Technical Outlook

MBMR broke above its downtrend line, RR at RM2.30 in January 2019. It rallied all the way to test the horizontal line at RM3.00 before pulling back. Now it is resting on the horizontal line at RM2.80.


Chart 2: MBMR's weekly chart as at May 23, 2019 (Source: Malaysiastock.biz)

Conclusion

Based on satisfactory financial performance & healthy financial position and positive technical outlook, MBMR is a good stock for long-term investment.

Note:
I hereby confirm that I do not have any direct interest in the security or securities mentioned in this post. However, I could have an indirect interest in the security or securities mentioned as some of my clients may have an interest in the acquisition or disposal of the aforementioned security or securities. As investor, you should fully research any security before making an investment decision.

Allianz: Earnings rose y-o-y

Result Update

For QE31/3/2019, Allianz's net profit dropped 1% q-o-q but rose 13% y-o-y to RM99 million while revenue rose 3% q-o-q or 6% y-o-y to RM1.344 billion. The Group's operating revenue rose q-o-q  due to a 7%-increase in operating revenue from life insurance segment brought on by higher premiums generated from bancassurance and employee benefits channel. This offset the 1.5%-drop in operating revenue from the general insurance segment mainly due to lower gross earned premiums. The Group’s profit before tax rose 18.3% q-o-q due mainly to higher profit contribution from life insurance segment.


Table: Allianz's last 8 quarterly results


Graph: Allianz's last 53 quarterly results

Valuation

Allianz (closed RM13.18 yesterday) is now trading at a PE of 11.8 times (based on last 4 quarters' EPS of 112 sen). At this PE, Allianz is deemed fairly attractive.

Technical Outlook

Allianz is in a long-term uptrend line, SS with support at RM11.80. Its immediate resistance is at the horizontal line at RM14.70.


Chart: Allianz's weekly chart as at May 23, 2019 (Source: Malaysiastock.biz)

Conclusion

Based on satisfactory financial performance, fairly attractive valuation and positive technical outlook, Allianz remains a good stock for long-term investment.

Note:
I hereby confirm that I do not have any direct interest in the security or securities mentioned in this post. However, I could have an indirect interest in the security or securities mentioned as some of my clients may have an interest in the acquisition or disposal of the aforementioned security or securities. As investor, you should fully research any security before making an investment decision.

Sunday, May 19, 2019

N2N: Earnings Rebounded on Lower Provision for Trade Debts

Result Update

In QE313/2019, N2N's net profit rose 99% q-o-q but dropped 16% y-o-y to RM5.6 million while its revenue dropped 2% q-o-q but rose 6% y-o-y to RM27 million. The Group’s revenue dropped marginally q-o-q due to a one-time implementation fees recorded in the previous quarter. Compared to the immediate preceding quarter, the Group’s core profits improved by 53.72% to RM4.45 million (Q4 2018: RM2.89 million) mainly due to lower provisions for trade receivables and other non-recurring administration costs.


Table: N2N's last 8 quarters' P&L


Graph: N2N's last 22 quarters' P&L

Latest Financial Position

As at 31/3/20198, N2N's financial position is very healthy, with current ratio of 6.4x and gearing ratio of 0.19x.

Valuation

N2N (closed at RM0.745 last Friday) is now trading at a PER of 34x (based on annualized core EPS 2.18 sen). At this PER, N2N is deemed fully valued.

Technical Outlook

N2N is in a long-term uptrend line (SS) with support of RM0.73 (previously stated at RM0.80).


Chart: N2N's weekly chart as at May 17, 2019 (Source: Malaysiastock.biz)

Conclusion

Based on satisfactory, albeit weaker, financial performance, healthy financial position and positive technical outlook, N2N could be a good stock for long-term investment. It may benefit from a pick-up in equities trading in the region this year.

Note:
I hereby confirm that I do not have any direct interest in the security or securities mentioned in this post. However, I could have an indirect interest in the security or securities mentioned as some of my clients may have an interest in the acquisition or disposal of the aforementioned security or securities. As investor, you should fully research any security before making an investment decision.
Kotra: Earnings Improved on Better Cost Control

Result Update

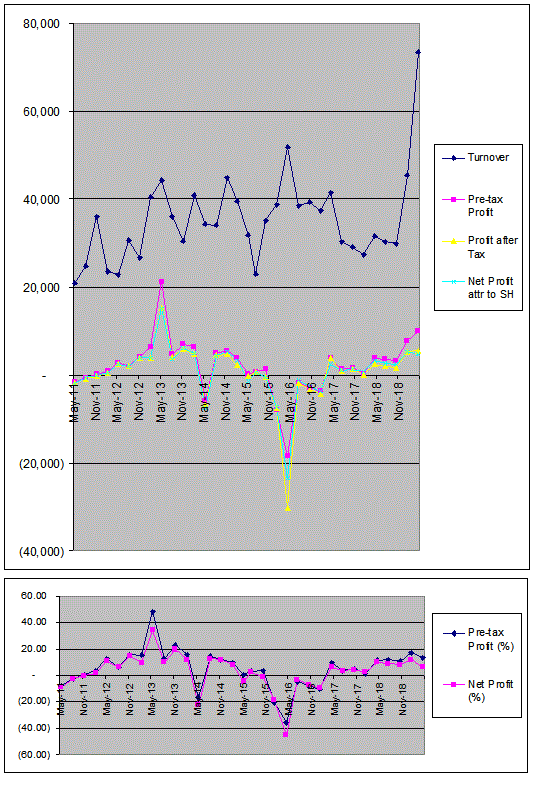
In QE31/3/2019, Kotra's net profit rose 7% q-o-q or 41% y-o-y to RM5.2 million while its revenue dropped 10% q-o-q or 9% y-o-y to RM41 million. The Group's revenue dropped q-o-q mainly due to lower sales of health supplement products to both the local and export markets and decrease in tender supply to local markets in current quarter. The Group's profit before tax rose q-o-q mainly due to rationalization of selling and administration expenses and lower advertisement & promotional expenses incurred in current quarter.


Table: Kotra's last 8 quarters' P&L


Graph: Kotra's last 49 quarters' P&L

Latest Financial Position

As at 31/3/2019, N2N's financial position is satisfactory, with current ratio of 2.4x and gearing ratio of 0.48x.

Background

Kotra is involved in manufacturing & trading of pharmaceutical and healthcare products. 


Kotra's MD, Jimmy Piong Teck Onn & the group's range of products

You can read about this group 's plan in 2018 (here). I post about Kotra once in October 2006 (here).

Valuation

Kotra (closed at RM1.71 last Friday) is now trading at a PER of 11x (based on last 4 quarterly EPS of 15.62 sen). At this PER, Kotra is deemed fairly attractive.

Technical Outlook

Kotra has been range-bound between RM1.60 & RM1.80 for the past 2 years. An upside breakout of the range at RM1.80 could set the stage for an upswing in the share price. Alas, there is no sign yet that this is about to happen.


Chart: Kotra's monthly chart as at May 17, 2019 (Source: Malaysiastock.biz)

Conclusion

Based on satisfactory financial performance, satisfactory financial position and fairly attractive valuation, Kotra could be a good stock for long-term investment.

Note:
I hereby confirm that I do not have any direct interest in the security or securities mentioned in this post. However, I could have an indirect interest in the security or securities mentioned as some of my clients may have an interest in the acquisition or disposal of the aforementioned security or securities. As investor, you should fully research any security before making an investment decision.