Tuesday, September 29, 2020

SCGM: Earnings Grew Strongly

Results Update

In QE31/7/2020 (1Q2021), SCGM's net profit rose 20% q-o-q or 276% y-o-y to RM8.3 million while revenue increased 15% q-o-q or 3% y-o-y to RM57 million. The group revenue rose q-o-q due to increase its manpower to 100% from May 2020 onwards under the Conditional Movement Control Order (CMCO), compared to 50% manpower during the Movement Control Order (MCO) from March to April2020. Also, the Group commenced production of face masks in May 2020, which contributed positively to 1Q2021 revenue. The Group recorded 47.8% q-o-q increase in PBT, which is attributable to improved sales mix, lower resin costs and lower interest expense. In line with the increased revenue, the Group noted 20% q-o-q increase in NP, due to the partial utilization of unutilized reinvestment allowance brought forward from prior year, and partial recognition of deferred tax asset on unabsorbed reinvestment allowance previously not recognized.

 
Table: SCGM's last 8 quarterly results

 
Graph: SCGM's last 45 quarterly results

Financial Position

SCGM's financial position is deemed healthy with current ratio at 1.45 times while gearing ratio is elevated at 0.71 time.

Valuation

SCGM (closed at RM3.59 yesterday) is now trading at a PE of 30X (based on the last 4 quarters' EPS of 12.11 sen).  At this PE, SCGM is deemed fully valued.

Technical Outlook

Recently, SCGM broke above its high of RM3.35-3.40 recorded in 2017, and went to a high of RM3.95. 


Chart: SCGM's weekly chart as at Sep 28, 2020 (Source: Malaysiastock.biz)

Conclusion

Based on improved financial performance, healthy financial position & bullish technical outlook, SCGM is a good stock for long-term investment. However its upside potential may be limited due to its demanding valuation.

Note:

I hereby confirm that I do not have any direct interest in the security or securities mentioned in this post. However, I could have an indirect interest in the security or securities mentioned as some of my clients may have an interest in the acquisition or disposal of the aforementioned security or securities. As investor, you should fully research any security before making an investment decision.
 

Tuesday, September 22, 2020

Topglov: Exceptional Earnings in an Extraordinary Time


Result Update

On 17 September 2020 (last Thursday), Topglove announced a fantastic set of result for QE31/8/2020, where its revenue increased 161% due to "tremendous growth stemmed from a global surge in demand for gloves on the back of the COVID-19 pandemic". At the same time, its "Profit Before Tax and Profit After Tax surged by 2,095% to RM1.62 billion and 1,692% to RM1.33 billion respectively. Meanwhile, Sales Volume grew by 43% versus 4QFY2019".  

"Reflecting market demand, average selling prices (ASPs) were also adjusted upwards. The Group’s improved profit was also attributed to productivity enhancements which it continued to embark on, while the Group’s utilization levels which remained at close to 100% amplified production efficiency and reaped superior economies of scale. High utilization helped lower overheads significantly, notably the cost of labor and natural gas. Further contributing to the phenomenal results was Aspion with a Profit Before Tax of RM139.9 million, as the Group started to reap the fruits of its acquisition. The additional capacity provided also helped position Top Glove to meet the upturn in glove demand".

 
Table: Topglov's last 8 quarterly results

Like Supermx's result for QE30/6/2020 (here), Topglov's profit margins soared 3-4 folds. This extraordinarily high profit margins is not something that the company would want to trumpet about, probably because it would cause concern among its investors about profit normalization! 


Graph: Topglov's last 72 quarterly results

Business Outlook

Topglov's press release provides some guidance on its bullish outlook in the months ahead. To wit:

The outlook for the company and glove industry remains very promising. With COVID-19, Top Glove estimates that glove demand will grow by 20% per annum in 2020, 25% in 2021 and 15% post-COVID.

The Group’s monthly order book has seen a significant rise of about 150% from pre-COVID days while lead time (delivery) has gone up from about 40 days to as much as about 400 days presently. The exceptionally strong demand coupled with higher ASPs bodes well for the Group’s results in the coming quarters.

Valuation

Topglov (closed at RM8.00 yesterday) is now trading at a trailing PE of 34 times (based on last 4 quarters' EPS of 23.44 sen). At this PE ratio - which is comparable to the multiple assigned by the market in 2019 - investors' perception on Topglov's future earnings is finely balanced between the anticipation for continued sales growth and the concern for the impending sales price (and profit margin) normalization. One of the reason for the scale-down of bullishness in the glove sector is undoubtedly the much-anticipated availability of vaccines for Covid-19 as early as the end of the year.

Technical Outlook

Topglov has peaked at RM9.76 in early August, and then it dropped below its intermediate uptrend line (SS) at RM8.70. A downtrend line (RR) can be drawn on the chart, which will provide resistance to cap any strong rally in weeks or months ahead.


Chart 1: Topglov's weekly chart as at Sep 22, 2020_12.30 (Source: Malaysiastock.biz)


Chart 2: Topglov's semi-log weekly chart as at Sep 22, 2020_11.30 (Source: Malaysiastock.biz)

As noted at the start, Topglov announced its result for QE31/8/2020 on 17 September 2020 (during the lunch break). What happened after the fantastic result was announced was something unexpected- the share price dropped sharply! It should be noted that after Supermx announced its equally fantastic result for QE30/6/2020 on 10 August 2020 (after the market close), its share price opened at higher at RM12.18 the following day and immediately corrected for the next 5 business days to close at RM8.34 on 17 August 2020. We have also observed immediate correction after the announcement of bonus issues for both Supermx and Topglov. These corrections, which followed after the announcement of good news, seem to suggest that there are big sellers waiting to sell into strength for both stocks. Until these sellers have cleared their position, the near term outlook for these stocks is likely to be mildly bearish.


Chart 3: Topglov's 15-min chart as at Sep 22, 2020_11.30 (Source: Malaysiastock.biz)


Conclusion

Based on outstanding financial performance, fairly attractive valuation (on a historical basis) and continued strong demand for its products (due to the persistent rise in Covid-19 cases), Topglov reminds a good stock for medium-term investment. The negative factors to be considered are the big sellers who may cap further rally in the share price and the anticipated arrival of vaccines for Covid-19.

Note:

I hereby confirm that I do not have any direct interest in the security or securities mentioned in this post. However, I could have an indirect interest in the security or securities mentioned as some of my clients may have an interest in the acquisition or disposal of the aforementioned security or securities. As investor, you should fully research any security before making an investment decision.

Thursday, August 20, 2020

MFCB: Earnings Continued to Rise

Result Update

For QE30/6/2020 (2Q2020). MFCB's net profit rose 41.7% q-o-q or 266.1% y-o-y to RM81.3 million while revenue rose 12.8% q-o-q or 14.0% y-o-y to RM181.3 million. Revenue rose 14.0% y-o-y mainly due to RM130.4 million energy sales revenue (2Q2019: Nil) and higher contribution from Packaging & Labels Division (up 31.0% to RM21.6 million), partially offset by the absence of construction revenue (2Q2019: RM100.2 million) and lower sales reported by the Resources Division on Covid-19 impact (down 30.4% to RM26.6 million). 

Pre-tax profit jumped 224% y-o-y underpinned by a RM93.7 million pre-tax profit from energy sales (2Q2019: RM0.6 million loss) and RM1.7 million contribution from the Packaging & Labels Division (2Q2019: RM0.3 million loss), which more than offset the absence of construction profit in the current quarter (2Q2019: RM26.9 million) and lower profit contribution from the Resources Division.

Profit after tax surged 289% to RM95.3 million (2Q2019: RM24.0 million) on 224% increase in pre-tax profit and lower effective income tax rate. Income from energy sale in Laos is exempted from income tax in its first five years of commercial operations, whereas in 2Q2019, a 20% deferred tax was provided for construction profit during the construction period of the Don Sahong.

  
Table: MFCB's last 8 quarterly results

 
Graph: MFCB's last 28 quarters' P&L  

Financial Position

As at 30 June 2020, MFCB's financial position is weak with current ratio at 0.40 time and total liabilities to total equity at 0.54 time. The extremely low current ratio is a serious concern as the group used short-term borrowings to finance its non-current assets- the bulk of which is likely to be the cost of constructing the 260 MW Don Sahong hydropower project in Laos. 

Valuation

MFCB (closed at RM7.04 yesterday) is now trading at a trailing PER of 12.4x (based on last 4 quarters' EPS of 56.75 sen). At this PER, the stock is deemed fairly valued.

Technical Outlook

MFCB has fully recovered from its sharp selldown in March, which saw the share price plunged to RM3.10. It made an all-time high of RM7.18 in early May and another all-time high of RM7.35 in early August.

 
 Chart: MFCB's weekly chart as at August 19, 2020 (Source: Malaysiastock.biz) 

Conclusion

Albeit its weak financial position, MFCB is a good stock for long-term investment based on good financial performance, fair valuation and positive technical outlook.

Note:

I hereby confirm that I do not have any direct interest in the security or securities mentioned in this post. However, I could have an indirect interest in the security or securities mentioned as some of my clients may have an interest in the acquisition or disposal of the aforementioned security or securities. As investor, you should fully research any security before making an investment decision.

Wednesday, August 19, 2020

PMETAL: BENEFITING FROM ALUMINUM PRICE RECOVERY

Results Update

For QE30/6/2020, PMetal's net profit declined by 12% q-o-q or 12% y-o-y to RM90 million while revenue declined by 5% q-o-q or 19% y-o-y to RM1.73 billion.  Profits dropped y-o-y mainly due to the weakening of aluminium price during the current year quarter under review as Covid-19 became a pandemic. In addition, operations at our extrusion and wire rods plants were halted from 18 March 2020 following the nationwide Movement Control Order (MCO). Both plants have since resumed operations by stages from mid-May 2020.


Table: PMetal's last 8 quarterly results


Graph: PMetal's 51 quarterly results

Financial Position

As at 30/6/2020, PMetal's financial position is deemed manageable with current ratio at 1.45 times and total liabilities to total equity at 1.53 times.

Business Expansion

PMetal's new Samalaju Phase 3 is expected to begin operation in early 2021. This will increase PMetals' installed capacity by 42% to 1.08 million MT. 

Aluminum Outlook

Aluminum prices have recovered substantially from its low of USD1450 in May to the current price of USD1780. Aluminum prices have shown a tendency to move in steady trend more than 1 year, and the trend has in the past begun with 10-week SMA line cut above/below the 40-week SMA line as well as the MACD going above/below the zero line. In the last 1-2 weeks, we saw aluminum price exhibiting positive signals, which could be the start of a bullish price trend. 


Chart 1: Aluminium's weekly chart from 2014 to 18 Aug 2020 (Source: Investing.com)

Valuation

PMetal (closed at RM5.04 at end of morning session today) is now trading at a PER of 46 times (based on last 4 quarters' EPS of 11.04 sen). Based on this PER, PMetal is deemed fully valued.

Technical Outlook

PMetal has been drifting lower for the past 2.5 years. A downtrend line, SS can be drawn which has capped the upward movement of the share price. If PMetal can break above the downtrend line at RM5.05-5.10, the share price may go into an uptrend. 


Chart 2: PMetal's weekly chart as at Aug 19, 2020 (Source: Malaysiastock.biz)

I've appended below PMetal share price chart above the aluminum price chart to show the close correlation below the 2 price charts.


Chart 3: PMetal and aluminum's weekly chart from 2014 to August 2020 

Conclusion

Despite the weaker financial performance, full valuation and mildly bearish technical outlook, PMetal is a stock worth considering for long-term investment if aluminum prices were to continue to go higher.  

Note:

I hereby confirm that I do not have any direct interest in the security or securities mentioned in this post. However, I could have an indirect interest in the security or securities mentioned as some of my clients may have an interest in the acquisition or disposal of the aforementioned security or securities. As investor, you should fully research any security before making an investment decision.

Monday, August 17, 2020

Market Outlook as at 17 August 2020

FBMKLCI has been consolidating since the beginning of August. If we drew a line connecting the low from end March (not mid-March) to date, we can see that this line, SS should provide support to the index at 1545. With both MACD and Directional Movement indicators showing negative reading, the index is not expected to stage a strong rebound from the "uptrend" line, SS in the near term. 

Chart 1: FBMKLCI's daily chart as at 14 Aug 2020 (Source: Malaysiastock.biz)

As noted in the recent market outlook post, our market is driven by 3 big theme plays. The first one is the play or rally on health care stocks (or, more specifically, glove stocks). From Chart 2 below, we can see that this index is likely to correct for a while since its MACD has hooked down.

Chart 2: Health Care Index's daily chart as at 14 Aug 2020 (Source: Malaysiastock.biz)

The second driver is technology stocks. This sector has also hooked down- even attempted to test its "uptrend line" on 12 August. Like health care index, the technology index is expected to remain weak after its MACD has hooked down.

Chart 3: Technology Index's daily chart as at 14 Aug 2020 (Source: Malaysiastock.biz)

The third driver is the droves of retail players getting into the market, probably driven by FOMO or fear of missing out. Many of the latecomers tend to zero in on the cheap stocks, and if we were to extract the total volume from the Top 35 Volume Stocks from 6 August to date, we would get an indication of how much of an impact this buying had on the market. I have tabulated and also plotted a graph of this below. 

Table: Volume of Top 35 Volume Stocks compared to Overall Market Volume from Aug 6 to 14

Graph: Volume of Top 35 Volume Stocks compared to Overall Market Volume from Aug 6 to 14

Since the high volume stocks are generally 3rd liner and fledgling stocks (trading at less than 10 sen each), we can assume that the volume traded represents retail participation. They accounted for a whopping 60-64% of overall market volume on the 2 biggest volume dates in our market to date, i.e. 7 & 11 August. Since then, the volume of the top 35 highest volume stocks had receded. If retail participation stays low, then the market will likely to remain weak for a while.

Based on the above, we should remain cautious and wait out the market correction before taking more aggressive action. Good luck.

Tuesday, August 11, 2020

Supermx: Soaring like an Eagle


Result Update

For QE30/6/2020, Supermx's net profit rose more than 3-fold q-o-q or more than 24 times y-o-y to RM400 million while revenue rose 108% q-o-q or 147% y-o-y to RM929 million. In the notes to the Financial Statement, the company explained its spectacular y-o-y performance in these words:

Supermax achieved its best ever quarterly financial performance in its history. Revenue soared to RM929.1 million, which was 147.1% or RM553.2 million higher compared to the corresponding Quarter a year ago. Profitability rose sharply with EBITDA, PBT and PAT margins at its highest ever and industry leading levels of 60.4%, 55.9% and 43.9% respectively. The Group‟s performance was mainly due to: 
a) An exponential rise in demand for Medical Gloves & other PPEs on the back of the Covid19 pandemic. 
b) Increase in additional production capacity from the newly commissioned lines at plant # 12 block A lines. 
c) Increase in average selling prices (ASPs) each month started in March, 2020 for both its Manufacturing and Distribution divisions. 
d) Increase in percentage of the Group‟s capacity & Global Sales to end-users; including sales to governments and government agencies of various countries where Supermax Group operates and in over 165 countries.
e) Proven business model through Own Brand Manufacturing (OBM) with 2-streams of income via Manufacturing & Distribution.

Amen!

Table : Supermx's last 8 quarters' P&L

Graph: Supermx's last 55 quarters' P&L

Financial Position

Supermx's financial position as at 30/6/2020 is very healthy with current ratio at 1.3 times while gearing ratio was at 1.0 time. The company commented generously about its improved financial position as follows:

Supermax‟s already sound financial position has strengthened dramatically, most notably to a net cash position with cash & bank balances amounting to RM1.18 billion as of 30 June 2020 compared to RM173.8 million a year before. The increase is mainly due to customers paying 30%, 40% and 50% deposits in advance to secure supply.

Thanks to the deposits collected to the tune of RM892 million, Supermx was sitting on a huge cashpile of more than a billion ringgit! But bearing in mind, this is customers' money paid upfront.

Outstanding Corporate Exercise

Supermx has declared a 1-for-1 bonus which is pending shareholders' approval at its upcoming EGM on 18 August 2020 (here). Meanwhile the company has proposed a dividend-in-specie of 1 Treasury share for every 45 shares owned after the implementation of the said bonus issue (here).

Valuation

Supermx (closed at RM21.20 yesterday) is now trading at a PER of 53x (based on last 4 quarters' adjusted EPS of 40.20 sen). If we annualized the latest quarterly EPS of 30.58 sen to arrive at a full-year EPS of 122.32 sen, then its PER will be lowered to 17 times. However, I believe to compute PER based on the annualized EPS of 122.32 sen may be too generous if we looked ahead to the normalization of profit due to increased supply of gloves (as a result of increased capacity) as well as lower demand if Covid-19 pandemic were to subside. This will be a tough judgement call for analysts and investors.

Technical Outlook

Supermx share price had rallied sharply from RM2.00 in April to a high of RM23.00 just 3 days ago. Technical speaking, the share price may still go higher in the near term.

Chart: Supermx's daily chart as at Aug 10, 2020 (Source: Malaysiastock.biz)

Conclusion

Based on excellent financial performance & satisfactory financial position, fairly attractive valuation, generous bonus issue ahead and still positive technical outlook, I think Supermx deserved to be rated as a HOLD.

Note:

I hereby confirm that I do not have any direct interest in the security or securities mentioned in this post. However, I could have an indirect interest in the security or securities mentioned as some of my clients may have an interest in the acquisition or disposal of the aforementioned security or securities. As investor, you should fully research any security before making an investment decision.

BPPLAS: Earnings Rose Sharply

Result Update

For QE30/6/2020, BPPLAS's net profit rose 36% q-o-q or 87% y-o-y to RM8.5 million while revenue was mixed- up 3.5% q-o-q but down 7.4% y-o-y to RM80.3 million. 

Operating revenue rose q-o-q due to improved sales demand in 2Q20. A subsidiary of the Group received approval since the beginning of Movement Control Order (MCO), thus able to operate to deliver stronger sales performance because food packaging film, stretch film and customised film products produced by the Group are part of the critically required packaging for Food and other Essential Goods.

The Group recorded a historical high for the unaudited PBT and PAT for the quarter under review of RM11.3 million and RM8.5 million respectively, representing an increase of 36% and 36% compared to unaudited PBT and PAT of RM8.3 million and RM6.2 million respectively in 1Q20. The increase in the unaudited PBT and PAT for the quarter under review were mainly due to better product mix and production efficiencies.

Table: BPPLAS's last 8 quarterly P&L

Graph: BPPLAS's last 26 quarters' P&L

Financial Position

As at 30/6/2020, BPPLAS's financial position is deemed healthy with current ratio and gearing ratio at 4.6 times and 0.2 times. Cash in hand amounted to RM78.8 million or RM0.42 per share.

Valuation

BPPLAS (closed at RM1.40 yesterday) is now trading at a PER of 10 times (based on last 4 quarters' EPS of 14.36 sen). If the cash in hand is deducted from the share price, then BPPLAS's PER will be lowered to 7 times. BPPAS also paid a decent dividend totaling 8 sen last 4 quarters- giving it a dividend yield of 5.7%. Overall, BPPLAS is deemed fairly attractive.

Technical Analysis

BPPLAS has broken above the Downtrend line, RR at RM1.00 in early May. Its immediate support is at the horizontal line at RM1.35 while immediate resistance is at the horizontal line at RM1.60.

Chart: BPPLAS's mweekly chart as at Aug 11, 2020 (Source: Malaysiastock.biz)  

Conclusion

Based on good financial performance & position, attractive valuation and bullish technical outlook, BPPLAS could be a good stock for long-term investment. 

Note:

I hereby confirm that I do not have any direct interest in the security or securities mentioned in this post. However, I could have an indirect interest in the security or securities mentioned as some of my clients may have an interest in the acquisition or disposal of the aforementioned security or securities. As investor, you should fully research any security before making an investment decision.

Monday, August 10, 2020

Market Outlook as at 10 August 2020

Last week we witnessed spectacular volume in the market that's reminiscent of the Super Bull Run of 1993. This is especially true on Friday when volume touched an all-time record of 26.65 billion units- a staggering volume which caused the trading to stall on Bursa Malaysia in the last hour of trading (see Chart 1). It will be interesting to see how the market will absorb the volume over the next 2 days.

Chart 1: FBMKLCI's daily chart as at August 7, 2020 (Source: Malaysiastock.biz)

At the same time, the market saw fearless buying which led to multibagger stocks born in a matters of 2-3 months- truly a sight to behold. Few will surpass the spectacular rallies achieved by Topglov and Supermx (see Chart 2). 

Chart 2: Topglov and Supermx's daily chart as at August 7, 2020 (Source: Malaysiastock.biz)

Many may recall the bull market that followed the aftermath of a crisis - AFC 1998 and GFC 2008 (see Chart 3). We are again at the cusp of a bull market as the crisis from Covid-19 pandemic subsides.

Chart 3: FBMKLCI's monthly chart as at August 7, 2020 (Source: Yahoo Finance)

Those who had experienced the Super Bull Run 1993 will remember what it's like to be in the vortex of a market mania. Last few weeks of market activities has all the hallmarks of a Super Bull Run. Away from the charts and the trading volume, you will find punters placing huge buy orders on contra basis which breached trading limits again and again. These players would easily humble the fearless men from the British SAS unit whose motto is: Who Dares Wins!

A quick glance at the major indices revealed that the bull market is still very selective. Blue chip stocks are hardly charging (see Chart 4) while small-cap stocks are only getting into the act of going up. (See Chart 5). The medium-cap stocks and fledgling stocks have extended their gain last week (see Chart 6 & 7) but the real action can be seen among tech-laden ACE Market stocks (see Chart 8). As mentioned in previous posts, the rallies in our market started with tech stocks in early April and blown apart by the pandemic stocks in early May. Now it is spreading out to the low priced fledgling stocks. 

Chart 5: FBMKLCI's weekly chart as at August 10, 2020 (Source: Malaysiastock.biz)

Chart 5: FBMSCAP's weekly chart as at August 10, 2020 (Source: Malaysiastock.biz)

Chart 6: FBM70's weekly chart as at August 10, 2020 (Source: Malaysiastock.biz)

Chart 7: FBMFLEDGLING's weekly chart as at August 10, 2020 (Source: Malaysiastock.biz)

Chart 8: FBMACE's weekly chart as at August 10, 2020 (Source: Malaysiastock.biz)

In this extremely bullish environment, a remisier can only say so much. To preach about investing in stocks with good fundamentals and reasonable valuation will be like casting pearls before swine. So the only thing to do is to stand back and let the party continues....

Monday, August 03, 2020

HLT-WA: Trading at a Big Discount

Another warrant is going down the road less traveled. In this case, it is HLT-WA- another warrant that's trading at a huge discount to the share price. As at last Thursday (July 30, 2020), HLT closed at RM1.46 while the warrant closed at RM1.03.  

Since HLT-WA has an exercise price of RM0.20 and still a long way to expiry (876 days to 27 December 2022) [here], it is hard to justify the discount of RM0.23 or 16%. As I had mentioned before (here), a warrant trading at a discount is a warning sign that the rally for both the share price and the warrant price are not sustainable.

Be careful!


Chart 1: HLT's daily chart as at July 30, 2020 (Source: Malaysiastock.biz)


Chart 2: HLT-WA's daily chart as at July 30, 2020 (Source: Malaysiastock.biz)

Thursday, July 23, 2020

Pharma & DPharma: Some Inconvenient Questions

In the past 2 days, we have been witnessing spectacular rallies for 2 pharmaceutical stocks, Pharma and DPharma. What prompted the rally was an announcement on July 14 by the Science, Technology & Innovation Minister, Khairy that Pharma and DPharma will do the "fill-and-finish" process for the re-packing the Covid-19 vaccine when it becomes available (here).

We know that the market is getting wary of glove stocks after the spectacular rally, and many players are now looking for something else to play. So the above story seems like just the right catalyst to shift to new stocks that are (1) relatively inexpensive vis-a-vis the glove stocks and (2) they can still be counted as pandemic stocks. 

However, there are a few inconvenient questions which we must answer if and when we want to get into Pharma and DPharma. They are:

1) When will the vaccine be available? Despite promising progress made, the first vaccine will be at least 18 months from now. That's the optimistic case!

2) Will the vaccine be produced in sufficient quantity to reach our shore? This is a tough one. The answer is probably not for a few years as demand will continue to outstrip supply, and America- the epicenter of the pandemic- has shown that it is willing to use its enormous muscle to buy up everything.

3) Can Pharma and DPharma handle the fill-and-finish process? While they may have done similar process for other drugs or vaccines, the new vaccine for Covid-19 will be novel and involve complex chemistry. They may need special pharmaceutical-grade glass to be bottled in. This is taken from an interview given by Bill Gates in the Vox magazine back in April (here). When asked by the interviewer, Ezra Klein about how much of a limiting factor will the manufacturing supply chain capacity be, Bill Gates replied:
For some of these vaccine constructs, it’s hard to scale up the manufacturing, partly because they are novel or just because the chemistry is very complex. And you’re in a new regime when you talk about making billions of a vaccine. We don’t make billions of any vaccine. We make hundreds of millions, but for those, we’ve had decades to work on their efficiency.
Even the fill finish at the very end where you put it in a glass bottle, that’s a special pharmaceutical-grade glass — the world doesn’t have enough of that. So we’re working to get that underway because all the vaccine approaches need to be put into a bottle at some point in time. I hope we get to the point where it’s the manufacturing piece because those investments are at most billions to save trillions.
4) Where is the market for the end-product, the re-bottled vaccine? If it is for the local market, then that market is too small for the time and effort required to get into the business. I presume it would include overseas market, such as Indonesia etc. I remember our pharmaceutical companies needed a long time to apply for licenses to distribute individual drugs in Indonesia. I think the same should continue now and this will delay the business.  


Chart 1: Pharma's weekly chart as at July 23, 2020_9.30am (Source: Malaysiastock.biz)


Chart 2: DPharma's weekly chart as at July 23, 2020_9.30am (Source: Malaysiastock.biz)

All in all, I think we have to temper our enthusiasm to get into Pharma and DPharma as well as other pharmaceutical stocks which have gone up substantially. The investment basis may be comparable in some way to glove stocks, since they are deemed to be pandemic stocks, but the case for pharmaceutical stocks is very weak, unlike glove stocks. Be careful!

Tuesday, July 14, 2020

Glove Put Warrants Rally: Just Ignorance?!

Yesterday we saw a massive rally for the 2 put warrants for the high-flying glove stock Topglov and Supermx. Given the big rally enjoyed by all glove stocks, it makes sense to contemplate buying into these put warrants for a high risk, high reward play. Alternatively, some may consider buying them as a hedge or an insurance policy to protect their portfolio of glove stocks since the prices of put warrants would move higher when the prices of the underlying stocks dropped.


Chart 1: Supermx-HB's daily chart as at 14 July 2020_10.45am (Source: Malaysiastock.biz)


Chart 2: Topglov-HA's daily chart as at 14 July 2020_10.45am (Source: Malaysiastock.biz)

However, the trading for these put warrants yesterday was way beyond expectation, to say the least. Topglov-HA rose from 6.5 sen to 20 sen while Supermx-HB rose from 6 sen to 23.5 sen. Normally when you see a put warrant price going higher, you would expect to see the underlying share price going down. Not for Supermx and Topglov share prices yesterday! Both share prices rose sharply, with Supermx increased by RM2.36 to RM15.98 and Topglov increased by RM2.08 to RM24.00! What's going on here! This reminded me of the screen from the movie "Cats in the Hat" where we should all drive (here).

There is only one logical explanation for this: Ignorance! But the ignorance here also advertised the extreme euphoria in the glove stocks rally may be begin reaching an unsustainable level. But I could be very wrong. This fantastic rally has turned the famous phrase "irrational exuberance" by former Fed chairman, Alan Greenspan on its head.


I have reproduced here the table of valuation of the 2 put warrants, below. It was extracted from KL Warrant Screener (here).

Table: Topglov-HA and Supermx-HB valuation table 

This may be just numbers to some punters. If you really want to see how extreme these numbers are, check out the article entitled "The Glove Put Warrants Poser" in the Edge CEO Morning Brief today (July 14, 2020). I will paste here a snippet that might just do the job.


Notwithstanding your outlook on glove stocks, which I assume is bearish otherwise you should not get into the put warrant, the present premium for the 2 put warrants is simply unjustifiable. Be very careful what you are buying. Good luck!!

Sunday, July 05, 2020

Market Outlook as at 6 July 2020

Last week, FBMKLCI rallied and re-established its position just above its previously violated uptrend line, SS. The recovery was fairly broad-based though the big gainers were concentrated in the glove stocks and the technology stocks.


Chart 1: FBMKLCI's daily chart as at July 3, 2020 (Source: Malaysiastock.biz)

The rally among the glove stocks, which is part of the health care sector, helped to push the health care index to a new high.

 Chart 2: BM Health Care index's daily chart as at July 3, 2020 (Source: Malaysiastock.biz)

Similarly, the rally in the tech stocks has pushed the Technology index to a new high in the current rally! At a close of 43020, Technology index is not far from its all-time high of 44610 recorded in January 2018.


Chart 3: BM Technology's daily chart as at July 3, 2020 (Source: Malaysiastock.biz)

The rally in tech stocks had earlier shown its potential when it helped FBMACE to make a new high in the current rally (see Chart). If you looked at the monthly chart (Chart 5), you will see that FBMACE has just surpassed the line connecting the high recorded its April 2015 & January 2018. This could mean that FBMACE may continue to trend higher. However, we should be careful to avoid a bull trap since the FBMACE stocks have rallied substantially over the past 4 months after it came off a deep selldown in March which was a bear trap.


Chart 4: FBMACE's daily chart as at July 3, 2020 (Source: Malaysiastock.biz)

Chart 5: FBMACE's monthly chart as at July 3, 2020 (Source: Malaysiastock.biz)

In the current market, where winners keep getting pricier and non-performers remain dull (if not down), it is hard to recommend stocks with strong conviction. If the market is too confusing for you, then you should stick to cash or those stocks that you are comfortable investing in. Just tell yourself, you have good companies if you are sitting on cash or staying on the sideline (here and here).

Technology Play: Which Sub-sectors or Stocks to Buy?

Last week, tech stocks have chalked up significant gain. If you wondering how to identify laggard tech stocks to add to your portfolio or watch list, this is one way you can consider.

Firstly, you need to identify which sub-sectors have shown out-performance. The Technology sector is divided into 4 sub-sectors: Digital Services, Semiconductors, Software and Technology Equipment. Below I have shown the steps to look at one of the sub-sectors, Digital Services. Then you choose "Price Change" and sort it by "Descending" order to filter out the out-performers.  


Diagram 1: How to pick out stocks in a sub-sector within the Technology sector

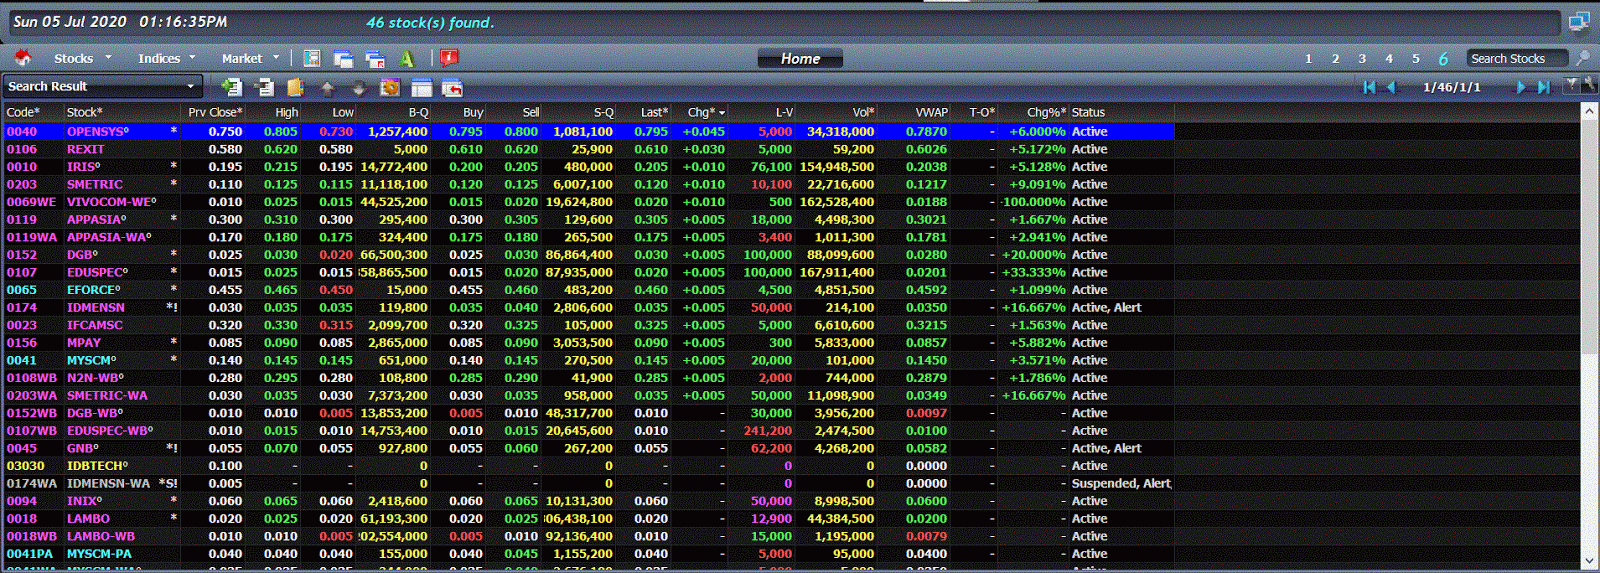
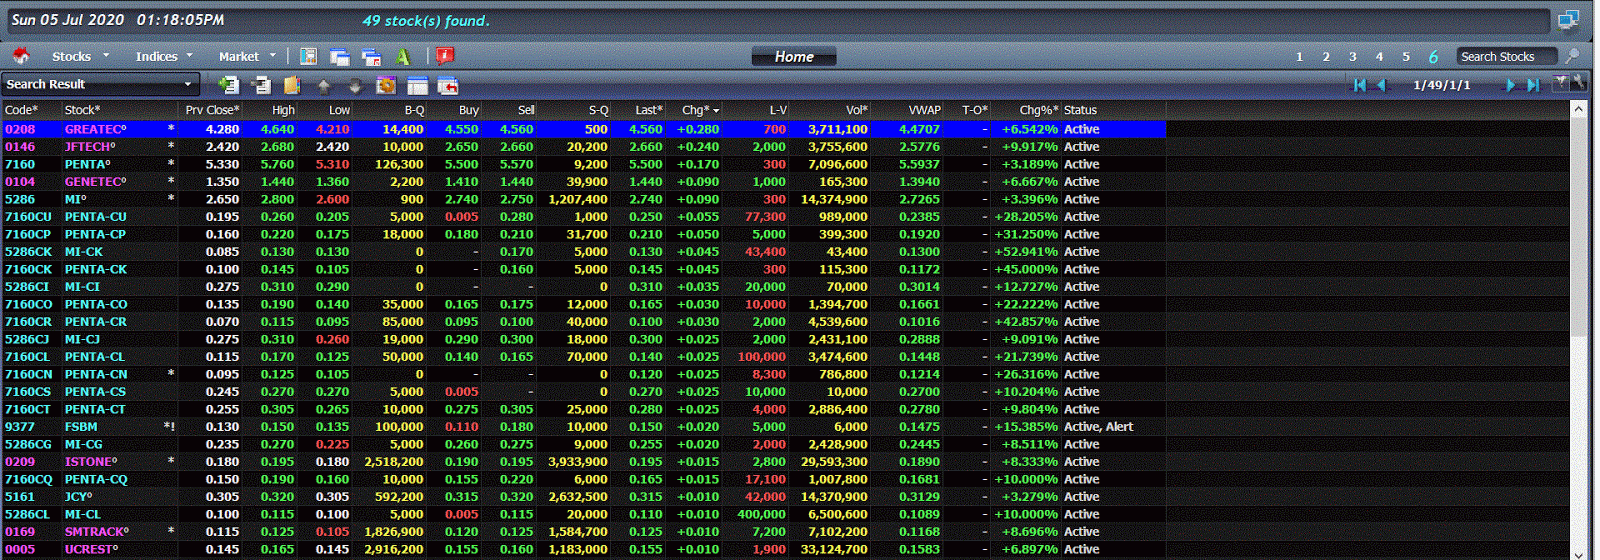
Below are the tables of out-performers for all the 4 sub-sectors of the Technology sector. You would notice that there are more gainers among the "Semiconductor" and "Technology Equipment" sub-sectors. This is not surprising as Malaysia is stronger in manufacturing than software or services.


Table 1: Top performers in the Digital Services sub-sector within the Technology sector


Table 2: Top performers in the Semiconductor sub-sector within the Technology sector


Table 3: Top performers in the Software sub-sector within the Technology sector


Table 4: Top performers in the Technology Equipment sub-sector within the Technology sector

After you have narrowed down the out-performing sub-sectors, you can choose the stocks to track or to buy. Assuming you want to buy the laggards; you should study their financial performance and the reason for their poorer financial performance. If you feel that the poorer financial performance may change, and the company's financial position is fairly sound, then you may position yourself in these laggards and wait for their turn to go higher.

You may try the same approach for Health Care sector. You will soon get the confirmation that this sector is pretty much all about glove stocks.

Diagram 2: How to pick out stocks in a sub-sector within the Health Care sector


Table 5: Top performers in the Health Care Equipment & Services sub-sector within the Healthcare sector

Look at the long list of out-performing glove stocks & related CWs above. The laggards among the glove stocks are not really laggards nor are they cheap. In my opinion, the whole glove stocks universe has gone up so much that you have to accept them not as value stocks, but as growth stocks which come with a high premium. The high premium can be justified if the earnings growth continues. If it stopped - or the market perceived that it may stop - the rollback can be very sharp.

That's what happened in late June when the market learned that glove prices have softened (here). Since then, the share prices rallied again, which could only mean that the report of the softening of glove prices was wrong or exaggerated. Anyway, that's the risk that you have to take if you get into glove stocks now.

The above are the steps that you can use to identify the out-performing sub-sectors in the Technology and Health Care sectors, and then you can pick up certain stocks to buy or track according to your investing or trading strategy. Good luck!