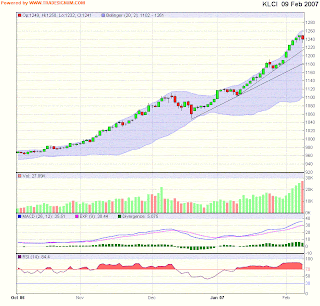
From Table 1 below, we can see that the immediate uptrend line support is at 1215-1220, while the next uptrend line support is at 1185. Given the strong bullish undertone in the market, I do not foresee a break of the 1185 uptrend line support at this moment.

Chart 1: CI's daily chart overlaid with uptrend lines
In the preceding rally from October to December 2006, the 8-day SMA has acted as a good support for the CI. A break below the 8-day SMA in mid-December 2006 was followed by a sharp correction which brought the CI down to its 30-day SMA (before recovery). This 8-day SMA may again act as a support for any potential correction in the market in the coming days. From Table 2 below, we can see that the 8-day SMA is at 1220. A break below this level could lead to a more pro-longed market consolidation.

Chart 2: CI's daily chart overlaid with 8-, 20- & 30-day SMA
No comments:
Post a Comment