Table 1: Gamuda's past 5 years' result
From the past 5 quarters' result, we can see that the decline in its net profit & turnover has been arrested (see table 2 below).

Table 2: Gamuda's last 5 quarterly results.
The long-term technical picture may start to improve in line with recovery in earning going forward as well as more contracts expected to be secured under the 9MP. From Chart 1 below, we can see that the downtrend in Gamuda's share price since Oct 2003 until today (with share price dropping from a high of RM8.00 to a low of RM3.00) is very similar to its downtrend during the Asian crisis (from Jan 1997 to Sep 1998), where the share price dropped from a high of RM5.60 to a low of only RM0.59. The share price recovery from the Asian crisis began after the followings were observed:
1. share price has broken above its then prevailing downtrend line;
2. share price has recovered above the 20-month MA; and
3. the monthly MACD has hooked up.
Today, we can see that Gamuda share price is in an advance stage of completing its bottoming process. It has broken above its recent downtrend line (which has commenced in Oct 2003) but it has yet to break above its 20-month MA. The monthly MACD has also not done a positive crossover.
Interestingly, the current bottoming process is likely to yield a double bottom reversal near the RM3.00 level (Note: This is not a done deal!). If so, this will be similar to the bottoming process of Sep 1998, which finished off with a double bottom reversal at the RM0.60 level.
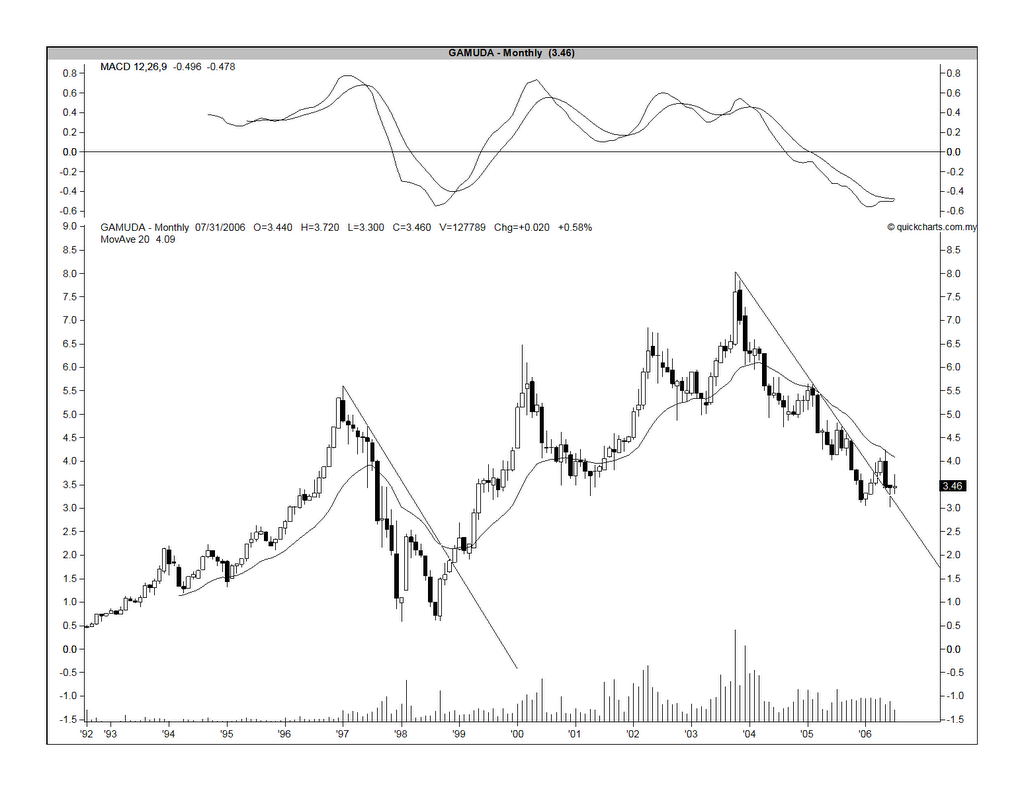
Chart1: Gamuda's monthly chart as at July 24
To get a clearer indication of Gamuda's possible reversal, we shall now look at the weekly chart. The chart shows a downtrend that has yet to be broken. Breakout is at RM4.00. We can see a bullish divergence between the weekly MACD & the share price, hinting of exhaustion in the second selldown to the RM3.00 level. The weekly MACD is also about to do a positive crossover. At the current price of about RM3.50, Gamuda share price has just broken above the 20-week MA. I expect the stock to hold around this level before rallying upward to test the RM4.00 level.
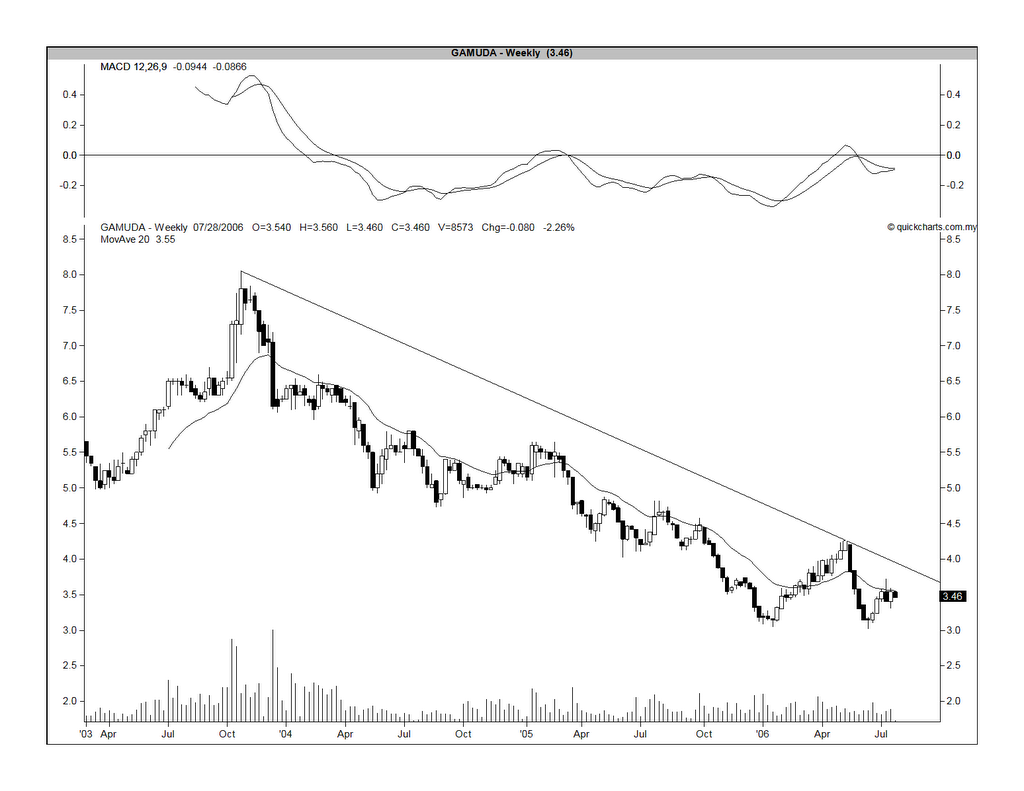
Chart2: Gamuda's weekly chart as at July 24
Based on the foregoing, Gamuda looks like a good stock to invest in. You may like to accumulate the stock in stages; buy half between RM3.50 to 4.00 and the remaining above the RM4.00 level, if the stock is rising. If the stock cannot hold above the RM3.50 level, it may slide back to RM3.00 again (possibly, to do a triple bottom). In this event, you may want to accumulate half between RM3.50 to 3.00 and accumulate the remaining if the stock re-bounce strongly off the RM3.00 level. With the positive news flow from the 9MP, I view the second scenario as not likely.
Updated on 7/27/2006
I am unhappy with my comments regarding the breakout of the recent downtrend line on the monthly chart and the failure to do so on the weekly chart. On second look, the inconsistency was caused by the way the downtrend line was drawn on the weekly chart. I have re-drawn the downtrend line & posted it as Chart 3 below. From Chart 3, we can see that the share did a breakout of its downtrend line at the RM3.75 in the week ending Mar 17. After achieving a high of RM4.26 in the week ending May 12, the stock dropped sharply to a low of RM3.02 during the recent share selldown. The drop was so severe that the share price went below the downtrend line for 2 weeks before recovery.
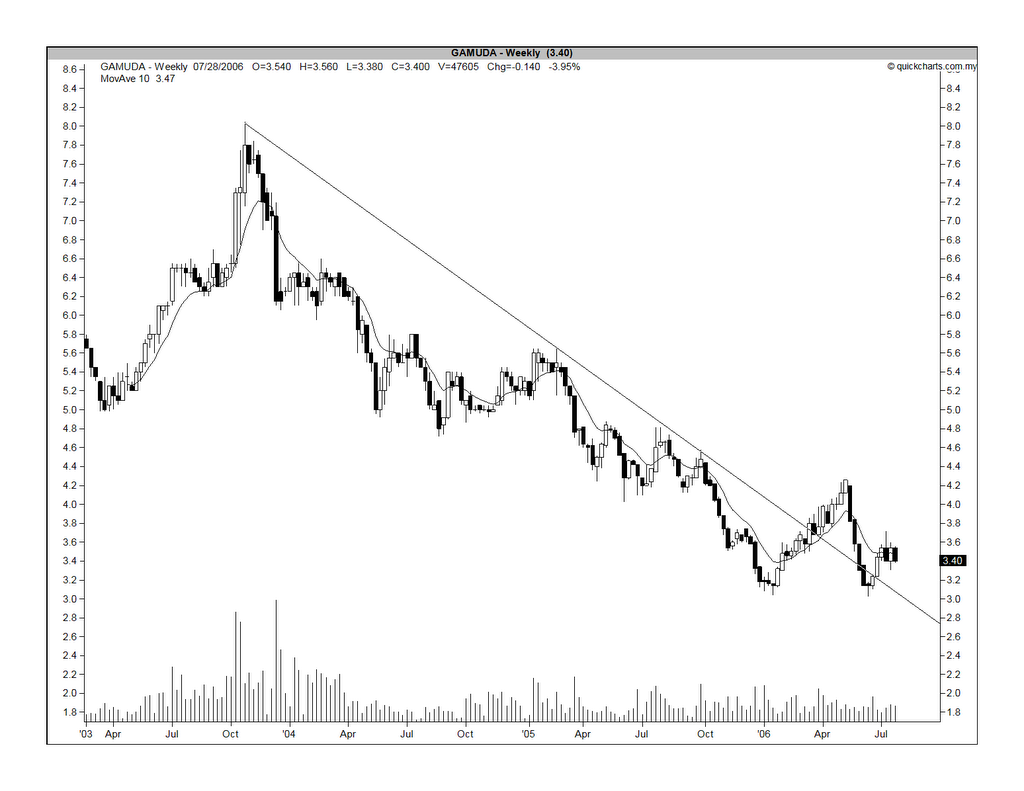
Chart 3: Gamuda's weekly chart as at July 26
No comments:
Post a Comment