Looking to the Asian stock markets since 1998 up to today, one would be struck by the steep gradient of the current market rally & the ground gained. Of course, this rally was preceded by an extreme market sell-off in 2008. I have appended below the charts for all the Asian markets, except Shanghai (because Yahoo Finance's data stretched back to only 2000). Look through these charts and ask yourself this questions: Can this steep rally sustain? If not, when will the correction come? How much will it pullback? The current rally & previous sharp rallies are highlighted in pink boxes. I believe that the market's upside potential is less than the downside risk and, consistent with my earlier view (
here), I believe we should reduce our position accordingly when the price moved in our favor.
 Chart 1: TWII's daily chart as at June 8, 2009 (Source: Yahoo Finance)
 Chart 2: BSE's daily chart as at June 8, 2009 (Source: Yahoo Finance)
 Chart 3: KOSPI's daily chart as at June 8, 2009 (Source: Yahoo Finance)
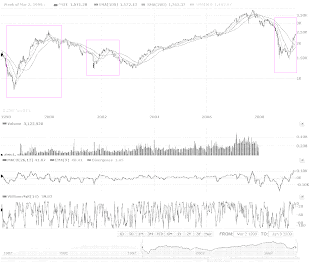 Chart 4: STI's daily chart as at June 8, 2009 (Source: Yahoo Finance)
 Chart 5: N225's daily chart as at June 8, 2009 (Source: Yahoo Finance)


1 comment:
For investors taking a longer position, I think they are more interested in looking at the indicators for USD recovery before making the necessary moves.
Yes, I agree the small cap rally is risky at this stage.
Post a Comment