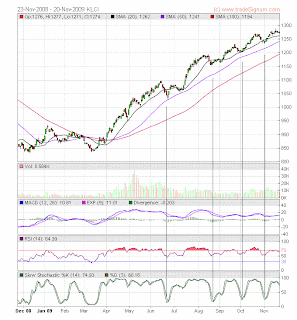
Chart 1: KLCI's daily chart as at Nov 20, 2009 (Source: Tradesignum)
We have been fortunate that all the corrections in the current rally have been fairly mild. If you look at the monthly chart below, you will see that the absence of sharp correction in the current rally almost mirrored the condition in the super bull run of 1993. This is quite unlike the bull rallies of 1998-99 & 2006-7, where sharp corrections or significant consolidation took place during the rally. The lack of any significant correction or consolidation can lead to complacency in the market. In the US market, analysts are concerned with the low reading in the VIX chart (of about 20-30) which signals the significant complacency in the market. During the Global Financial Crisis of 2008, the VIX chart rose to a high of 80-90 in October-November 2008. Prolonged period of complacency could quickly changed if fresh problems arose. This may lead to sharp sell-off or even a v-shape reversal.

Chart 2: KLCI's monthly chart as at Nov 20, 2009 (Source: Tradesignum)
I believe that our market has reached a level where the risk-to-reward proposition may no longer favor those who take long positions in the market. This conclusion is based on the following:
1) The market is nearing a fairly strong horizontal resistance level of 1280-1300, which happens to be the peak for the market in January 1994 & February 1997 (see Chart 2);
2) FBM-KLCI dropped from a high of about 1520 to a low of about 800- a loss of 720 points- from January to October 2008. Based on last Friday close of 1274, the FBM-KLCI has recovered 65% of the ground ceded in the bear market of 2008. Compared this with the bull market of 1998-99 where the point recovered was 780 points from a low of 260 in September 1998 to the January 2000 high of 1020. This represents a recovery of about 75% of the 1040-point lost in the preceding bear market of 1997-98 (from a 1997 high of 1280 to a low of 260). Would the current recovery match the 1998-99 recovery in term of retracement? If so, we may see a further 10% gain in the FBM-KLCI; and
3) The bull market of 1998-99 lasted about 18 months (from October 1998 to January 2000). This matches the duration of the preceding bear market of 1997-98 which also lasted 18 months (from February 1997 to September 1998). The current bull market started in March 2009 and it's now about 8 months old. The preceding bear market of 2008 started in January 2008 & hit a low in October 2008. If we take the October 2008 low as the end of the bear market of 2008, then the 2008 bear market lasted 10 months. If the duration of the current bull market is similar to the duration of the preceding bear market (like in 1998-99 bull market & the preceding 1997-98 bear market), then the current bull market may still continue for another 2 months.
The above observations may lead the optimists to conclude that the current bull market may still have an upside of 10% & may last another 2 months. That would be a wrong conclusion to draw. We must bear in mind that charting is an art, not a precise science. I would conclude that the market is in a highly elevated position & that correction may be imminent. However, we have yet to see a top or a sell signal. When we have a confirmed sell signal, the prices could be much lower than the current prices. If you share my conclusion, then you should take some precaution to reduce your position in the market.
6 comments:
What do you think about Picorp ? Worth to buy?
Hi Mr. Alex,
Would switching to high value stocks ie strong dividends and consistent growth provide protection from the imminent correction or better to wait for prices to drop lower?
Apperciate your feedback.
BR.
Hi David,
Picorp is trading at a PE of 15 times, which means it's fully valued.
It is drifting lower & would soon test its long-term uptrend at RM0.27-28. I think it will take a while to recover after the strong rally in 2007-8, where the stock made a high of RM0.80.
Hi JR,
Switching to blue chips is a sound tactical move but that won't safe you from suffering some drawdowns or losses in the event of a bear market. Of course, this comes with the territory- to make some money, you have to run the risk of losing some. In the scenario that I have envisaged, it is advisable not to place large bets in the market as the risk undertaken may outweigh the reward to be gained.
Thanks for the feedback.
Post a Comment