Gtronic may have broken above its long-term downtrend line resistance at RM1.12-13. Its next resistance is at RM1.25 & thereafter at RM1.50.

Chart 1: Gtronic's monthly chart as at Mar 11, 2010 (Source: Tradesignum)
Recent Financial Results
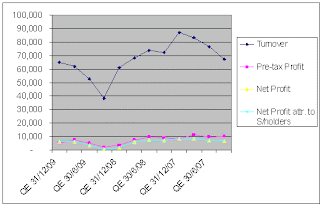
Gtronic had recently announced its results for FYE31/12/2009, which shows a drop in net profit of 26.7% from RM21.8 million to RM15.9 million. Turnover had similarly declined by 21.1% from RM275 million to RM217 million. The decline is mainly due to the global economy slowdown in 2009 & losses incurred due to the shutdown of its China operations (approximately RM8 million as of to-date) further eroded the net profit of the group.
Financial Position
Gtronic's financial position is very satisfactory with little borrowings and a current ratio of 3 times as at 31/12/2009.

Table: Gtronic's last 8 quarterly results

Chart 2: Gtronic's last 27 quarterly results
Conclusion
Based on technical breakout, Gtronic could be a trading BUY.
2 comments:
Hi Alex, many thanks again for your inputs.
Is it possible for you to update the last 8 QE of Gtronics? You havent been touching the semiconductor sector for a while and i believe an upswing is imminent with the recovery of US market.
many thanks again for your efforts. you deserve a pat or two at the back! :)
Hi Political Crow's Nest
Gtronics is still in a downtrend line with resistance at RM1.11-1.12. This means that it is very close to a potential test & a breakout.
SOX, the Philadelphia Semiconductor index is rather toppish. It is at 432-433 now and looks set for a pullback towards its uptrend line, with support at 365-370.
Good luck!
Post a Comment