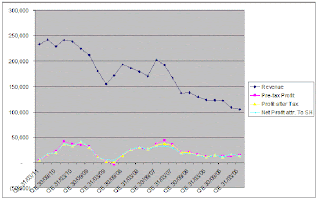
Evergreen has just announced its results for QE31/3/2011, where its net profit dropped by 68% q-o-q or 83% y-o-y to RM5.8 million while turnover dropped by 3.5% q-o-q or 2.2% y-o-y to RM234 million. The company attributed the sharp drop in its bottom-line to "the higher cost of raw materials and the impact from the weakening US dollar". The players in this sector have difficulty in passing on the increased cost due to overcapacity & intense competition.

Table: Evergreen's last 8 quarterly results

Chart 1: Evergreen's past 26 quarterly results
Valuation
Evergreen (closed at RM1.22 yesterday) is bow trading at a PE of 27 times (based on annualized EPS of 4.48 sen). If Evergreen's bottom-line can recover back to the level of profit achieved in QE31/12/2010, then its full-year EPS would be about 14.5 sen. In that case, the stock would have a PE of about 8.4 times. Can its earning recover? We will have to wait & see.
Technical Outlook
In November 2010, I have pointed out that Evergreen had broken its uptrend line (go here). Since then, the stock has been sliding lower, with a downtrend line (RR) drawn in the chart. The stock may see some support at the horizontal lines at RM1.20 & then at RM1.00.

Chart 2: Evergreen's weekly chart as at May 23, 2011_plotted on log scale (Source: Tradesignum)
Conclusion
Based on poor financial performance & bearish technical outlook, I think it is best to avoid Evergreen.
No comments:
Post a Comment