Friday, August 20, 2010

MISC- better results but still unattractive

Results Update

MISC has just announced its results for QE30/6/2010. Its net profit increased by 118% q-o-q or 83% y-o-y to RM428 million while turnover dropped 1% q-o-q or 16% y-o-y to RM3.27 billion. The improved performance is attributed to better results from the restructured Liner business as well as increased profitability from the Heavy Engineering business.


Table: MISC's last 8 quarterly results

From Chart 1 below, we can see that MISC's turnover has stabilized after a sharp drop in 2008. Bottom-line has shown signs of recovery in the past 3 quarters.


Chart 1: MISC's last 17 quarterly results

Valuation

MISC (closed at RM8.86 yesterday) is now trading at a trailing PER of 42 times. At this multiple, MISC is deemed overvalued.

Technical Outlook

Like a giant oil tanker, MISC moved very slowly. Over the past 18 years, MISC had only rallied twice. Its first rally came at the end of the 1993 bull run and the next bull rally came in 2003-2006. The periods in between are marked by long sideway movement or consolidation (in the form of triangle or double-triangle). I believe MISC is now in such a formation, with prices trapped between RM8.00 & RM10.00.
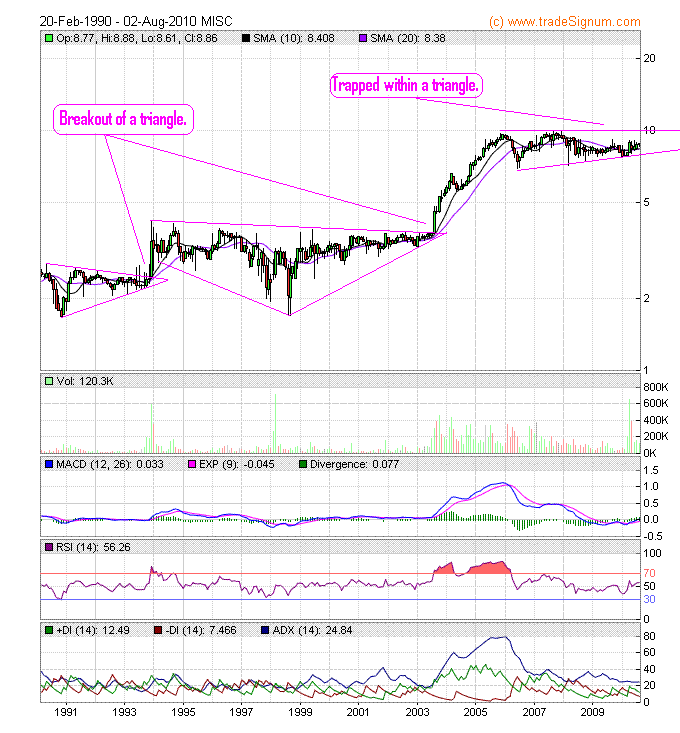

Chart 2: MISC's monthly chart as at Aug 19, 2010 (Source: Tradesignum)

Conclusion

Based on high valuation & unattractive technical outlook, MISC is a stock to be avoided.

Uchitec- good results & possible technical breakout

Results Update

Uchitec has just announced its results for QE30/6/2010. Its net profit increased by 40% q-o-q or 198% y-o-y to RM13.9 million while turnover increased by 4% q-o-q or 12% y-o-y to RM25 million. The company attributed the improved performance to increased demand for its products as well as increase in R&D projects.


Table: Uchitec's last 8 quarterly results

From Chart 1 below, we can see that Uchitec is slowly recovering after the steep drop in sales in 2007 & 2008.


Chart 1: Uchitec's last 18 quarterly results

Valuation

Uchitec (closed at RM1.41) is now trading at a trailing PER of 12 times (based on last 4 quarters' ESP of 11.69 sen). Uchitec, known for its high dividend payout, has seen its dividend yield sliding in the past 2 years. Today, its dividend yield stood at 4.3% only.

Technical Outlook

Uchitec may have broken to the upside of its symmetrical triangle at RM1.38-1.40. If it can recruit sufficient buying interest, it may test its horizontal resistance at RM1.60 & then at RM1.90.


Chart 2: Uchitec's weekly chart as at Aug 19, 2010 (Source: Quickcharts)

Conclusion

Based on steady improvement in financial performance & possible technical breakout, Uchitec could be a trading BUY or even a medium-term investment.

Thursday, August 19, 2010

SPSetia-WB may have a bullish breakout

SPSetia-WB broke above its downtrend line at RM0.44 in early August. The breakout was followed by a correction back to the downtrend line. In the past few days, it rose slowly & timidly. Yesterday, it rallied strong in the afternoon session (see Chart 1). Is this the start of a rally for this warrant & the mother share?


Chart 1: SPSetia-WB's daily chart as at Aug 18, 2010 (Source: Quickcharts)

The last time SPSetia-WB broke above the 40-week SMA line in w/e April 17, 2009, it coincided with a similar breakout in the mother share. SPSetia then rose from RM3.00 to RM4.60 over a period of 8-9 weeks. See Chart 2 & 3.


Chart 2: SPSetia-WB's weekly chart as at Aug 18, 2010 (Source: Quickcharts)


Chart 3: SPSetia's weekly chart as at Aug 18, 2010 (Source: Quickcharts)

Based on the bullish breakout, SPSetia-WB could be a trading BUY. A better alternative trading BUY could be the mother share, SPSetia.

Note: Based on yesterday's prices, SPSetia-WB is now trading at a premium of about 15%. Its main terms are exercise price of RM4.48; exercise ratio of 1-for-1; and, expiry date in Jan 2013.

SEG- watch out for the unadjusted earning

Results Update

SEG has just announced its results for QE30/6/2010. The announced results in Bursa was presented without adjusting for the 1-for-2 split & 2-for -5 bonus. See Table 1 below.


Table 1: SEG's results for QE30/6/2010 (Source: Bursa)

The adjustment was not made to the financial statement because the entitlement date was on July 27, which was after the closing date for QE30/6/2010. However, investors looking at the announced results would immediately compute the PER for SEG and unknowingly arrive at a much lower & incorrect PER. I have appended below the adjusted EPS, Dividend per share & NTA per share for SEG (see Table 2). You will see that SEG's adjusted EPS for QE30/6/2010 is about 4.33 sen. Based on its close of RM2.73 yesterday & the last 4 quarters' EPS totaling 9.49 sen, SEG's trailing PER is about 29 times.


Table 2: SEG's last 8 quarterly results

Technical Outlook

SEG is still in a strong uptrend with bearish divergence in the MACD & RSI.


Chart: SEG's daily chart as at Aug 18, 2010 (Source: Tradesignum)

Conclusion

Albeit the still bullish technical outlook, SEG is to be avoided due to its excessively high valuation.

Wednesday, August 18, 2010

Ogawa- gearing up for a bullish breakout?

Ogawa is involved in designing, marketing, retailing, distributing, and servicing of health care equipment and supplementary appliances. It provides a range of health and wellness equipment comprising various relaxation, therapeutic, fitness, diagnostic, and hygiene products.

Listed in June 2007, Ogawa has been in a downtrend until last month when the stock broke above its downtrend line at RM0.35. The stock is now attempting to break above the horizontal resistance at RM0.45-46. If successful, it may challenge its next resistance at the horizontal line of RM0.51-52. A break above this latter resistance could see the stock sailing up to the horizontal line at RM0.85-90.


Chart 1: Ogawa's weekly chart as at August 18, 2010_9.05am (Source: Quickcharts)

Ogawa's financial performance has turned around this year. For the 9-month ended 31/3/2010, Ogawa recorded a net profit of RM2.2 million on turnover of RM108 million. This compared favorably with last year's 9-month results where it incurred a net loss of RM15.7 million on turnover of RM87 million. Oqawa (closed at RM0.45 yesterday) is now trading at a trailing PER of 19 times or at a Price to Book of 0.9 time (based on NTA per share of RM0.49 as at 31/3/2010). At these multiples, Ogawa is deemed very demanding.

Can Ogawa duplicate the success of its close competitor from Singapore, OSIM? For QE30/6/2010, OSIM reported a net profit of S$12.1 million (a y-o-y increase of 142%) and a turnover of S$131 million (a y-o-y increase of 12%). For more, see the table below.


Table: OSIM's 2Q2010 & 1H2010 results

Due to its strong recovery, OSIM rose from a low of S$0.10 in April 2009 to a recent high of S$1.10. See Chart 2 below.


Chart 2: SIM's daily chart as at August 17, 2010 (Source: SGX)

Conclusion

Ogawa may rally if it can break above the horizontal resistance at RM0.45-46 convincingly. The catalyst for a rally could be a good set of number for QE30/6/2010 (expected any day now).

Tuesday, August 17, 2010

GenM may have a bullish breakout... finally

Gentimg Malaysia Bhd ('GenM') has finally broken above its strong horizontal resistance at RM2.90 as well as the next resistance at RM3.00. Based on this, I believe GenM may rise further. The stock is doing catch-up with its parent, Genting Bhd as well asGenting Singapore- both stocks have a huge rally in the past few days.


Chart: GenM's weekly chart as at August 17, 2010_9.20am (Sourece: Quickcharts)

GenM could be a good trading BUY.

Monday, August 16, 2010

Maybank may have a bullish breakout

Maybank finally broke above its horizontal resistance of RM7.77-78 this afternoon. This upside breakout may mirror the February/March 2010 breakout where Maybank rose about RM1.00, from below RM7.00 to RM7.70.


Chart: Maybank's daily chart as at August 16, 2010_2.45pm (Source: Quickcharts)

Based on this upside breakout, Maybank could be a good trading BUY.

Friday, August 13, 2010

Century's bottom-line jumped

Results Update

Century has just announced its results for QE30/6/2010. Its net profit jumped 14% q-o-q or 79% y-o-y to RM7.5 million while its turnover increased by 26% q-o-q or 60 % y-o-y RM75 million. The better performance is simply attributed to increased business from new & existing customers.


Table: Century's last 8 quarters' results


Chart 1: Century's last 17 quarters' results

Valuation

Century (closed at RM1.66 yesterday) is now trading at a PER of 4.3 times based on last 4 quarters' EPS of 38 sen. Before we get too excited about this low PER, we must remember that the stock has traded at equally low trailing PER in the past (such as 3-4 times in the middle of 2008). Notwithstanding this, I believe that Century is very attractive.

Technical Outlook

The stock is trapped between a long term downtrend line and an intermediate term uptrend line; forming a triangle (ABC). The upside breakout level is at RM1.65-67. A few indicators seem to point towards that possibility.


Chart 2: Century's daily chart as at August 12, 2010 (Source: Quickcharts)

Conclusion

Based on good financial performance and attractive valuation, Century could be a good stock for long-term investment. However, those who are technical inclined would like to wait for an upside breakout at RM1.65-67 before venturing in for a trade.

Thursday, August 12, 2010

Kianjoo & Canone- closure at last?

On July 19, I posted on Kianjoo testing its horizontal resistance at RM1.32-33, after an upside breakout of its triangle formation (go here). Since then, Kianjoo has broken above the RM1.32-33 resistance and it may challenge higher resistance level at RM1.50 & RM1.60. See Chart 1 below.


Chart 1: Kianjoo's weekly chart as at August 12, 2010_10.20am (Source: Quickcharts)

Interestingly, Canone has also broken above its strong horizontal resistance at RM1.12 yesterday. Canone could potentially revisit its April 2006 high of RM1.60-62. Is there a connection between these 2 stocks? You may recall that Can-One, through its wholly-owned subsidiary Can-One International Sdn Bhd, entered into a share sale agreement with Kian Joo Holdings to buy a 32.9% stake in KJCF for RM241.12mil or RM1.65 per share in April 2009 (go here). Subsequently, Kianjoo's managing director Datuk See Teow Chuan and 13 others filed a legal suit against Canone, claiming that the transaction was ‘’illegal’’. Is the Court about to rule in favor of Canone?


Chart 2: Canone's weekly chart as at August 12, 2010_10.20am (Source: Quickcharts)

Based on technical consideration only, Kianjoo & Canone could be good trading BUYs.

Market Outlook as at August 12, 2010

The last few days of correction may cause some investors to raise the question of how sustainable in the current rally. Looking at Chart 1, we can see that the 50-day SMA line has already hooked up and this is an indication that the market is likely to go higher in the near term. The current correction is not unexpected since the market has staged a powerful rally off the low of 1243 (on May 27) to hit a high of 1370 (on August 3).


Chart 1: FBM-KLCI's daily chart as at August 11, 2010 (Source: Tradesignum)

Looking closely at the daily chart of FBM-KLCI, we can see that the index has very strong support at the 50-day SMA line (at 1336). In the past 1 year, FBM-KLCI broke below the 50-day SMA line only twice- in January & May this year. I think the 1336 level would like to hold up FBM-KLCI and represent a good entry level into the market. However, if the level failed, then the market may correct further.


Chart 1: FBM-KLCI's daily chart as at August 12, 2010_12.30pm (Source: Quickcharts)

Based on the above, we need to watch the FBM-KLCI closely as it comes close to the 50-day SMA line at 1336.

The DOW may test the 10000 mark

A 265-point drop in the DJIA is never something to sneeze about. Yesterday, DJIA broke to the downside of its rising or bearish wedge ('ABC') at 10600. It also broke below the 100 & 200-day SMA lines at 10521 & 10435. DJIA may find support at the 50-day SMA line at 10263 as well as the horizontal lines of 10200 & 9900.


Chart 1: DJIA's daily chart as at August 11, 2010 (Source: Stockcharts)

The market correction is partly due to renewed concern that the US economy is heading towards a double dip. A good article to bring you up to speed on this on-and-off debate was given by Planet Yeltnick entitled "Double Dip Countdown: T-5 after Fed Punts". This part of the article accurately captured the market fear:
Already GDP, which was reported at 2.4%, was downgraded (by JP Morgan) a couple of days later due to a poor durables report, and now has been downgraded by them again to 1.3% due to a poor wholesale inventory report. Tomorrow international trade comes out, and JP will be at it again. They note that the GDP gets reported at the end of the month, with estimates for items that come in a week or two after. They think the estimate of international trade was "extreme", setting up another downwards revision tomorrow.

The other disturbing news is more leading indicators heading south. The US LEI is heading down, although not yet signaling a second recession. The Global OECD indicators are turning over and in some cases in negative territory. ...Albert Edwards, reports that the Conference Board indicator (excluding a yield curve input) is now in negative territory. He pulls out the yield curve since the short-end is artificially low due to ZIRP (zero interest rate policy). He concludes that market participants will soon realize that the US is Japan of ten years ago, and will follow a similar path of deflation and zero growth.

From Chart 2 below, we can see that the yield of the 10-year Treasury Note has been declining since April. The drop is gathering momentum after breaking below the horizontal support of 29.


Chart 2: TNX's daily chart as at August 11, 2010 (Source: Stockcharts)

Based on the bearish technical signals from DJIA & TNX, we can expect US equity markets to be weak in the near term. This weakness may drag down our stock market.

Wednesday, August 11, 2010

Mudajaya's rebound fizzling out?

What a ride? Mudajaya shot up to test its short-term downtrend line resistance at RM4.70. Though it failed to break to the upside of that downtrend line (RR), it kept trying until the start of the afternoon session today. The bears took over & pushed the bulls back into the barn. Tomorrow will be a critical day for this stock. Can it stage a rebound off the short-term uptrend line (SS) at RM4.20? A break below that level would send this stock back to RM4.00 or the horizontal line of RM3.90.


Chart: Mudajaya's 30-min chart as at August 11, 2010_5.00pm (Source: Quickcharts)

I will not be posting further update on this stock. I must stir players away from risky trades such as this one.

Harta- a break in the sequential rise in net profit

Results Update

Harta announced its results for QE30/6/2010. Its net profit dropped 10.7% q-o-q to RM41.5 million on the back of a 4%-increase in turnover to RM170 million. Compared to the previous corresponding quarter, Harta's net profit was up by 57% while turnover was up by 36%. Our concern however is on the break in the sequential rise in the bottom-line which is indicative of the rubber glove sector entering into a more difficult operating environment.


Table: Harta's last 8 quarterly results


Chart 1: Harta's last 11 quarterly results

Technical Outlook

Harta broke below its uptrend line support at RM8.00 on Monday. Unless a quick recovery happened, the technical outlook for Harta has turned bearish. (Note: As at 9.13 am, Harta was trading at RM8.01. A possible recovery?)


Chart 2: Harta's daily chart as at August 10, 2010 (Source: Quickcharts)

Conclusion

Based on the break in the sequential rise in the company's bottom-line- which was also witnessed in the recent quarterly results for Topglove & Adventa- as well as the bearish breakdown of its uptrend line, I believe Harta is likely to have peaked. As such, it is advisable to take profit on this stock.

Monday, August 09, 2010

Notion- after a sharp rise...

Results Update

Notion announced its results for QE30/6/2010 recently. Its net profit dropped by 76% q-o-q or 73% y-o-y to RM3.0 million while turnover increased by 7% q-o-q or 36% y-o-y to RM61 million. The poor performance was attributable to 3 factors:
1) initial start-up cost of new projects;
2) quality issue in relation to the 2.5" baseplate (HDD component) project; &
3) weaker USD & EURO

Besides the quality issue in relation to the 2.5" baseplate project, Notion may face some problem of declining demand for HDD which was in turn due to a slump in the demand for netbooks. The latter was attributable to a shift in demand from netbooks to iPad. Notion does not expect its net margin to improve in the next quarter.


Table: Notion's last 8 quarterly results


Chart 1: Notion's last 8 quarterly results


Technical Outlook


Notion, which closed at RM1.87 at the end of today, tested its horizontal support at RM1.85 earlier. The horizontal line of RM1.85 is a strong support and it may hold steady for a while. If this level failed, then the stock may test the next two horizontal support at RM1.70 & RM1.50.


Chart 2: Notion's weekly chart as at August 9, 2010 (Source: Quickcharts)

Conclusion

Based on the drastic change of fortune in Notion, one may be better served by being more cautious & wait for the dust to settle before venturing into this stock. The two issues to look out for is the quality issue for the 2.5" baseplate project & the state of demand for HDD.

Mudajaya- flashing a possible high risk trading BUY

Mudajaya was heavily sold down over the past few days, due to allegation of improprieties in relation to its India power plant project. Go here.

Looking at the 30-min intraday chart, it looks like Mudajaya may have formed a bottom and is poised to stage a recovery. We can see the formation of a higher 'low' & a higher 'high'.

Based on this, Mudajaya could be a trading BUY. However, this is a high rick trade & you are strongly advised to set tight protective stop if you choose to venture into this stock.


Chart: Mudajaya's 30-min chart as at August 9, 2010_11.43 am (Cource: Quickcharts)

Latexx's good results- a breather for glove makers?

Results Comment

Investors are waiting anxiously for the results for QE30/6/2010 for either Latexx or Supermx or Harta or Kossan. The reason for the anxious wait was due to poor showing by Topglov & Adventa in their last quarterly results where we saw a break in the sequential rise in bottom-line for these glove makers, with Topglov's net profit down 10% q-o-q for QE31/5/2010 while Adventa's net profit down a whooping 31% q-o-q for QE30/4/2010.

Last Friday, Latexx announced the results for QE30/6/2010, where its net profit increased 4% q-o-q or 89% y-o-y to RM21.6 million while turnover increased by 7% q-o-q or 81% y-o-y to RM134 million. The sequential increase in the bottom-line is comforting. The company explained the better performance was due to increased sales volume & improved overall efficiency. However, it admitted that it still faces strong challenges from the increase in average latex price and the weakening of US dollar.


Table: Latexx's last 8 quarterly results


Chart 1: Latexx's last 8 quarterly results

High latex price and weak USD to drag down glove makers

From Chart 2 below, rubber price (a proxy to the cost of rubber latex) may rise again after a correction lasting about 4 months from April to July this year. Similarly, USD is poised to go lower after breaking the horizontal support at 3.16-3.18 (see Chart 3).


Chart 2: SOCOM's rubber price chart on y-o-y (Source: Rubbernet)


Chart 3: USD-RM's daily chart as at August 6, 2010 (Source: Yahoo Finance)

Technical Outlook

Latexx has been trading sideway after making a high of RM4.91 in January. The trading range is between RM3.30 & RM4.20.


Chart 4: Latexx's weekly chart as at August 6, 2010 (Source: Quickcharts)

Conclusion

Based on Latexx's good results for QE30/6/2010, the rubber glove makers may enjoy a respite from the sell-off in the past few days. However, the fall in the price of rubber latex appears to be over. This coupled with the renewed weakness in the USD will continue to affect the performance of rubber glove makers for the next few quarters.

Friday, August 06, 2010

Plantation stocks- good for a trade

The sharp rally in CPO is beginning to stir up interest in plantation stocks. Among the stocks which may have bullish breakout are IJMPlant & IOICorp.


Chart 1: CPO's daily chart as at August 5, 2010 (Source: ifs.marketcenter.com)

IJMPlant has broken above its descending triangle at RM2.45-2.50. The breakout is however lacking in volume. If it can recruit sufficient buying support, it may rally & possibly test the horizontal line at RM2.93-95. See Chart 2 & 3 below.


Chart 2: IJMPlant's daily chart as at August 6, 2010_3.30pm (Source: Quickcharts)


Chart 3: IJMPlant's weekly chart as at August 6, 2010_3.30pm (Source: Quickcharts)

IOICorp has broken above its medium-term downtrend line at RM2.14 as well as to the upside of its triangle at RM2.15. Like IJMPlant, this breakout is also short on volume. If the buying picks up, it may test its long-term downtrend line at RM2.18-2.20. If the latter can be overcome, IOICorp may rally to test its horizontal resistance at RM6.20.


Chart 4: IOICorp's daily chart as at August 6, 2010_3.30pm (Source: Quickcharts)


Chart 5: IOICorp's weekly chart as at August 6, 2010_3.30pm (Source: Quickcharts)

Based on the above technical breakout for IJMPlant, one may consider taking some position in this stock. For IOICorp, you should watch out for the upside breakout above the long-term downtrend line at RM5.18-20 before venturing in.

Thursday, August 05, 2010

Weida may have a bullish breakout

Weida has broken above its strong horizontal line at RM0.82 today. This was preceding by an upside breakout above its long-term downtrend line at RM0.80 at the end of July. With this breakout, Weida could potentially rally to test the psychological level of RM1.00 & then the horizontal line at RM1.07-1.10.


Chart: Weida's weekly chart as at August 2, 2010 (Source: Tradesignum)

I have appended the recent financial results for Weida. A quick glance will show that Weida's performance is very erratic due to the sharp swing in its Work division. In the last 4 quarters, it achieved an EPS of 13 sen as compared to 11 sen in the preceding 4 quarters. Based on its current price of RM0.845 & an average EPS of 12 sen, Weida is trading at PER of 7 times. For a small-cap, Weida is deemed fairly priced. It may trade up to a PER of 8 times; thus giving the stock an upside of 14-15%.


Table: Weida's last 8 quarterly results.

Based on technical breakout, Weida could be a good trading BUY.

Tuesday, August 03, 2010

HDD sector takes a hard knock

The second thing that I have learned from the Edge this week is the impact of Apple's iPad on HDD sector. Like many, I was quite surprised by the sharp fall in the share price of JCY & Notion. Now, we learned that iPad tablet computer from Apple has caused a sharp dent in the sale of netbooks, which use hard disk drives (HDD). On the other hand, iPad does not use HDD but uses flash memory. The impact was so severe that Seagate & Western Digital have cautioned investors that they faced pricing pressure as HDD manufacturers increased production.

From Chart 1, we can see that JCY broke below its horizontal support at RM1.41 on July 23 & took a sharp dive to a low of RM1.23 yesterday.


Chart 1: JCY's daily chart as at Aug 3, 2010 (Source: Quickcharts)

Notion's selldown continued. It broke the horizontal support of RM2.25 today. Its next strong horizontal support is at RM1.85.


Chart 2: Notion's daily chart as at Aug 3, 2010 (Source: Quickcharts)

Due to this game-changing event, the HDD sector may take some time to sort itself out. It would be prudent not to take an aggressive position in any of the HDD players until the dust has fully settled.

CBLC- an interesting instrument re-examined

This week, I learned two things from the Edge. The first thing is a good article entitled Callable Bull & Bear Certificates- the evolution of exotic options. If you have read my earlier post (here), you would have gotten a wrong impression that Callable Bull & Bear Certificates ('CBLCs & CBBCs') are CWs with a serious disadvantage to the holders. After reading Ms Jasvin Josen's article, I think I need to retract my earlier assertion.

CBLCs (the only Callable Certificates issued so far) are CWs with a safeguard. The safeguard is the Mandatory Call Event ('MCE') which automatically forces the issuer to recall the CBLC when it hit a Minimum Trading Price ('MTP'). We saw how this happened in the case of the BJCorp-JA which was recalled on July 22- 5 days after its listing on July 16. The reason for the recall was that BJCorp-JA hit the MTP of RM1.05. Go here.

The function of the MTP is similar to setting of protective stop for any trading position. Fortunately or otherwise, this MTP is very rigid and once it is hit, the issuer would call back the CBLC. We are out of the game and hopefully preserving our capital for another day.

USD-RM may weaken further

Our Ringgit ('RM') looks set to strengthen further against the USD. From Chart 1 below, we can see that the 50-day SMA line has just knocked against the 100-day SMA line and looks set to go lower. This would happen if the RM breaks below the horizontal support of 3.15-16. This same set-up was witnessed in September 2009 & March 2010 when the 50-day SMA line knocked against the 100-day SMA line & went down. At each occasion, the RM strengthened against the USD by about 20 sen. If the same thing were to recur, the USD-RM exchange rate may drop to 3.00.


Chart 1: USD-RM's daily chart as at August 2, 2010 (Source: Yahoo Finance)

You would notice that FBM-KLCI had rallied each time the RM strengthened against the USD (in September 2009 & March 2010). If the same were to recur, we can expect FBM-KLCI to rally, possibly to test the upside of the expanding triangle at 1400-1420. See Chart 2.


Chart 2: FBM-KLCI & USD-RM's daily chart as at August 2, 2010(Source: Yahoo Finance & Tradesignum)

The above technical set-up is awaiting a downside breakout in USD-RM below the horizontal support of 3.15-16.