Monday, June 22, 2015

Penta: Breaking out of a 5-year Saucer Bottom

Background

Pentamaster Bhd ("Penta") is involved in production of automated equipment & provision of automated manufacturing solution. Its areas of expertise include semiconductor, vision inspection, IT, LED test solution, material handling & packaging solution.

The group has worked fora few years in developing the Glove Unique Reprocessing Unit ("GURU") which allows rubber gloves to be reused up to 7 times. This game-changing product has not caught on in a big way. If it succeeds in penetrating the healthcare sector, its revenue & earning could increase significantly.

Recent Financial Results

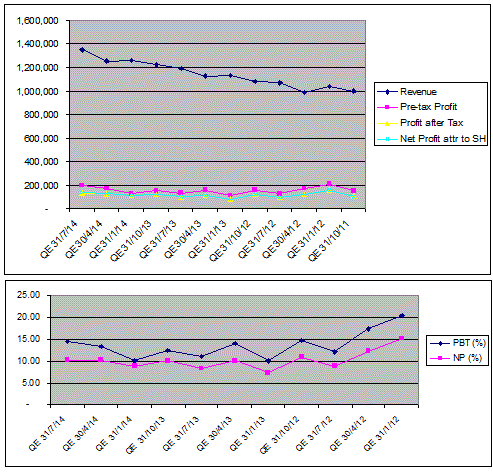
For the past 10 quarters, Penta's financial performance has slowly improved albeit with some volatility. The latter is probably due to the nature of its business which is likely to be project-based.


Chart 1: Penta's last 10 quarterly results

When you look at Penta's financial performance over a 10-year period, you will see a drop in revenue and a period of losses in FY2008-2010. This was due to business slowdown that accompanied the global financial crisis of 2008. 


Chart 2: Penta's last 10 annual results

In 2010, Penta carried out a strategic move to dispose off 2 factories and certain machineries for RM50 million in order to reduce its gearing as well as to re-focus its business on its core technological areas.


Chart 3: Penta's Shareholder's Fund, Gearing & Total Assets for last 10 annual results

This strategic move helped to push up its profit margin as well as elevating its assets turnover over the past 3 years. With lowered gearing (the opposite of T.Assets/T.Equity), the group is poised to expand its Balance Sheet when the business volume comes in. Alas, business volume has been tepid at best.


Chart 4: Penta's Profit Margin, Assets Turnover & T.Assets to T. Equity for last 10 annual results

Financial Position

As at 31/3/2015, Penta's financial position is deemed satisfactory with current ratio at 2.2 times and gearing ratio at 0.3 time.

Valuation

Penta (traded at RM0.77 as at 12.00pm) commands a trailing PE of 13.8 times. At this PER, Penta is deemed fully valued. 

Technical Outlook

Penta has just broken above its symmetrical triangle at RM0.72 (see Chart 4). Its immediate target is RM0.80. This breakout also coincides with the breakout of a 5-year sauce formation. It may potentially g as high as RM1.20.


Chart 1:Penta's daily chart as at Jun 19, 2015 (Source: ShareInvestor)


Chart 2: Penta's monthly chart as at Jun 19, 2015 (Source: ShareInvestor)


Conclusion

Based on technical consideration, Penta could be a good stock for a trading BUY. Its unexciting financial performance and full valuation would rule out the stock for long-term investment for now.

Note:
In addition to the disclaimer in the preamble to my blog, I hereby confirm that I do not have any relevant interest in, or any interest in the acquisition or disposal of, Penta. 

Friday, June 19, 2015

MISC: Uptrend Under Threat

MISC dropped RM00.41 to close at RM7.89 yesterday. That pushed the share price just below the "uptrend line" at about RM8.00. See Chart 1 below.


Chart 1: MISC's weekly chart as at Jun 18, 2015 (Source: ShareInvestor.com)

From the monthly chart (Chart 2), we can see that MISC has been rising with the 10-month SMA line acting as its uptrend line. The RM8.00 support is very critical for the continued uptrend of this stock.


Chart 2: MISC's monthly chart as at Jun 18, 2015 (Source: ShareInvestor.com)

MISC is at an inflection point. It must recover back above the RM8.00 mark. As at 11.15am this morning, it is trading at RM8.03-8.04. Hopefully, MISC will stage a decent rebound from here. For the brave heart, you might consider a trading BUY with a stop loss just below RM8.00. My longer term rating remains unchanged: SELL INTO STRENGTH.

Note:
In addition to the disclaimer in the preamble to my blog, I hereby confirm that I do not have any relevant interest in, or any interest in the acquisition or disposal of, MISC.

Thursday, June 18, 2015

Gasmsia: IBR coming

Gasmsia has revealed that incentive-based regulation (IBR) for the gas sector is well under way. It is expected to be implemented by as soon as Jan 2016. This has prompted CIMB to lower our target price to RM2.25 as we change our valuation method to SOP from 22x CY16 P/E to better reflect its earnings composition. We also downgrade to Reduce from Hold as IBR could lead to a sharp earnings erosion.For more, check out the report in the Star newspaper.

Chartwise, we can see that Gasmsia has broken below its strong horizontal support at RM2.60. While it may find support at RM2.50 or even RM2.40, these support levels are relatively weak. In line with the negative development on both the fundamental & technical fronts, I would recommend a SELL on Gasmsia.


Chart: Gasmsia's weekly chart as at Jun 17, 2015 (Source: ShareInvestor.com)

Note: 
In addition to the disclaimer in the preamble to my blog, I hereby confirm that I do not have any relevant interest in, or any interest in the acquisition or disposal of, Gasmsia.

Tenaga: Buying 1MDB's stake in Project 3B

The Cabinet has just approved the move by Tenaga Nasional Berhad (TNB) to buy over 1Malaysia Development Berhad (1MDB)'s stake in the Project 3B coal power plant for an undisclosed sum. For more, go here.

From Chart 1, we can see the sharp plunge in Tenaga's share price. At the time of writing, the share price has stabilized at RM12.56.

Chart 1: Tenaga's 5-min chart as at Tenaga 18, 2015_2.45pm (Source: ShareInvestor.com)

The monthly chart below shows that Tenaga's long-term uptrend has halted in the past few weeks- probably due to reports that it has to come in to help out in Project 3B. Tenaga's share prices were moving in a large expanding triangle, with immediate support at RM12.00. If the share price falls below this mark, the downtrend should begin in earnest. 

With the new cost pass through regime in place, Tenaga's share price weakness may be a temporary phenomenon due to the perceived bailout of 1MDB's Project 3B.

Until the details of the purchase of Project 3B are announced, we are not sure how it would benefit or impact Tenaga. For now, I believe that Tenaga could be a good BUY if it tests the RM12.00 mark.


Chart 2: Tenaga's monthly chart as at Tenaga 18, 2015_2.45pm (Source: ShareInvestor.com)

Note:
In addition to the disclaimer in the preamble to my blog, I hereby confirm that I do not have any relevant interest in, or any interest in the acquisition or disposal of, Tenaga.

SCGM: Earnings rose due to MYR weakness

Results Update
 
For QE30/4/2015, SCGM's net profit rose 34% q-o-q or 104% y-o-y to RM5.1 million while revenue was mixed- down 5% q-o-q but rose 9% y-o-y - to RM26 million. Revenue dropped q-o-q in line with slight slowdown demand from the general Asian and Australian markets. The big festival like Chinese New Year in February 2015 had boosted sales in the previous quarter to January 2015. Profits rose q-o-q due to foreign exchange gains as a result of a stronger U.S. dollar had an impact on export sales

 
Table: SCGM's last 8 quarterly results

 
Chart 1: SCGM's last 25 quarterly results

Valuation

SCGM (closed at RM3.32 yesterday) is now trading at a PE of 17 times (based on last 4 quarters' EPS of 19.46 sen). At this PE, SCGM is fully valued.

Technical Outlook

SCGM is in a long-term uptrend line. Price weakness has been arrested by the 10-month SMA line, currently at RM2.40-2.50. MACD & Slow Stochastic indicators are still positive.


Chart 2: SCGM's monthly chart as at Jun 17, 2015 (Source: ShareInvestor.com)

Conclusion

Based on good financial performance & positive technical outlook, SCGM is still a good stock for long-term investment. However, its upside may be limited given its current high PER. 

Note:
In addition to the disclaimer in the preamble to my blog, I hereby confirm that I do not have any relevant interest in, or any interest in the acquisition or disposal of, SCGM.

Topglov: Earnings Soared

Results Update

For QE31/5/2015, Topglov's net profit rose by 29% q-o-q or 71% y-o-y to RM72 million while revenue rose by 16% q-o-q or 15% y-o-y at RM661 million. Profit Before Tax rose sequentially due to higher sales volume, ongoing efficiency and quality enhancement initiatives, low raw material prices and a stronger US Dollar.

 
Table: Topglov's last 8 quarterly results


Chart 1: Topglov's last 36 quarterly results

Valuation

Topglov (closed at RM5.87 yesterday) is now trading at a PE of 16.3 14 times (based on last 4 quarters' EPS of 36.1 41 sen). At this PE multiple, Topglov is attractively valued.

Technical Outlook

From Chart 2 below, we can see that Topglov share price broke above the 3-month trading range of RM5.40-5.60. It is likely to test the large triangle (ABC) at RM6.40. See Chart 3 below.
 

Chart 2: Topglov's daily chart as at Jun 17, 2015 (Source: ShareInvestor.com)
 

Chart 3: Topglov's monthly chart as at Jun 17, 2015(Source: ShareInvestor.com)

Conclusion

Based on better financial performance, attractive valuation & mildly positive technical outlook, Topglov is rated a BUY. While the RM6.40 resistance may cap the stock's upside for a while, a breakout is very likely as the stock is trading at lower PE multiple than its peers.

Note:
In addition to the disclaimer in the preamble to my blog, I hereby confirm that I do not have any relevant interest in, or any interest in the acquisition or disposal of, Topglov.

Airasia: When fear reins supreme...

On the morning of June 11, I highlighted that Airasia had broken the RM2.00 psychological support and that it might test the RM1.80 support soon. The RM1.80 is a confluence of horizontal support, uptrend line support as well we the lower line of a downward channel. I believe that the stock should find its support at this level.

Of course, we now know that the RM1.80 support was not enough to hold back the rampaging bears spook by a report from a Hong Kong-based accounting research group GMT Research which questioned Airasia's accounting, profit generation, cash flow issues, leverage and group structure. I do not have the benefit of reading that report but I believe the gist of it has probably found its way into the AllianceDBS Research report, which was reported by Bloomberg TV (here).

In essence, the GMT Research report highlighted the following issues:
1. Aggressive depreciation policy which assumes a 25-year useful life and 10% residual value for its aircraft. This implies an annual depreciation rate of 3.6% vs its peers’ range of 4.5%-6.3% and it is likely to distort its earnings.
2. The collectability of the amounts owing by Indonesia AirAsia (IAA) and Philippines AirAsia (PAA), which rose from RM438.0 million in 1Q FY2010 (3.8% of total assets) to about RM2.8 billion in 1Q FY2015 (12.8% of total assets).
3.  Since the bulk of the amounts owing by IAA & PAA came from lease rental payable to Airasia, the eventual settlement of the amounts owing would deprive Airasia of a source of income, namely interest income from lease rental.

After adjusting for the above, AirAsia’s net profit would be 30%-35% lower than AllianceDBS Research’s current core net profit forecasts for FY2015-FY2017 (which is premised on AirAsia’s current accounting policies). Because of concerns about the recoverability of the amounts owing by IAA and PAA as well as Airasia's earnings quality, AllianceDBS Research trimmed its target price to RM1.80 after raising its sum-of-parts (SOP)-discount to 50%. It however maintains its HOLD rating on the stock.

Since Airasia broke its strong support of RM1.80 with such ease, one would be inclined to believe that the support from the horizontal lines at RM1.40 & RM1.20 would also likely to fail. While this thought may seem reasonable, we must remember that when the share price of a stock is sufficiently low, its underlying value would become obvious. Bargain hunting or greed would surface and the share price would recover. Would it happen at RM1.40 or RM1.20 or, even lower prices like RM0.80? Who knows? One thing is for sure: If you hang in there or bought into the stock today, and if the stock recovers in the future to, say RM1.80, the target price set by AllianceDBS Research, you deserve the profit. Of course, the grim alternative may also happen. The share price may continue to slide - remember AAX - and if you had exited earlier, your capital would be well-preserved for another investment. This is investing at its most basic -with guts and commitment.

Good luck! 


Chart: Airasia's monthly chart as at Jun 17, 2015 (Source: ShareInvestor)

Note:
In addition to the disclaimer in the preamble to my blog, I hereby confirm that I do not have any relevant interest in, or any interest in the acquisition or disposal of, Airasia.

Wednesday, June 17, 2015

Astro: Earnings improved

Results Update

For QE30/4/2015, Astro's net profit increased by 20% q-o-q or 31% y-o-y to RM168 million while revenue mixed; declined by 1% q-o-q but rose 6% y-o-y to RM1.33 billion.


Table 1: Astro's last 8 quarterly results

The improved bottom-line y-o-y was due to higher revenue & lower depreciation & interest expense. For more, go here.


Table 2: Astro's Segmental Reporting for 1QFY16 & 1QFY15

If we look at the first quarter's segmental results for the last 4 financial years, we can see that revenue has been on an uptrend. Along with that, we have rising depreciation charges which weighed down its profits until now. Depreciation charge has begun to ease back and I believe this is the inflection point for the company as its earning should start to rise.


Table 3: Astro's Segmental Reporting for 1QFY16, 1QFY15, 1QFY14 & 1QFY13

From the diagram below, we can see that bottom-line has risen for the past 2 quarters despite a flattening out of revenue. This is due to an upswing in profit margin.


Chart 1: Astro's last 15 quarterly results

Valuation

Astro (closed at RM3.01 yesterday) is now trading at a trailing PE of 28 times (based on last 4 quarters' EPS of 10.75 sen). Astro remains over-valued with PEG ratio at 1.4 times (based on last year's earnings growth of 20%). With dividend yield of 3.8%, Astro may be viewed as an income stock

Technical Outlook

Astro is now resting on its 2nd tentative uptrend line (S-S1) at RM2.90-2.95. In addition we can draw a line connecting the recent low, A-B. That line could provide support at RM2.90. With the MACD indicator hooked down as well as entering into the negative territory, there is a higher probability that the RM2.90 support may be violated.  If this happens, the next support is at RM2.70.


Chart 2: Astro's daily chart as at June 17, 2015_10.30am (Source: ShareInvestor.com)

Conclusion

Based on improved financial performance, Astro could be a good stock for long-term investment. However, with its demanding valuation and negative technical outlook, Astro is not likely to charge up any time soon.

Note:
In addition to the disclaimer in the preamble to my blog, I hereby confirm that I do not have any relevant interest in, or any interest in the acquisition or disposal of, Astro.

Tuesday, June 16, 2015

FGV: A Big Spender!!


"A billion here, a billion there, pretty soon, you're talking real money" by Everett Dirksen (He was actually misquoted


Last week, I posted about the possible acquisition of a 30%-stake in PT Eagle High for RM1 billion. PT Eagle High is reported to own a total Indonesian land bank of 419,006ha, of which 147,000ha are planted. The acquisition will go a long way to address the problem of old trees in FGV's estates. 

That stake was initially expected to cost about RM1 billion. It turned out that the newspaper was off the mark by a wide margin. Yesterday, we learned that FGV will be buying a 37%-stake in PT Eagle High for USD679 million (or, RM2.512 billion) plus a 98%-stake in a 47,745 ha of sugar  plantation land in Papua, Indonesia for USD67 million (or, RM248 million). 

Many analysts are not too happy with the acquisition due to its high pricing, unusual payment term and negative impact on earnings and gearing. The acquisition priced PT Eagle High at 770 rupiah per share; a 71%-premium above the last done price of  450 rupiah per share. And, before signing the S&P agreement, FGV has paid a deposit equivalent to 23% of the transaction price (as compared to the usual 10% deposit on signing the S&P agreement). 

If we look at the chart below, FGV - a great Malaysian story -  has now turned into a nightmare for those are holding onto this stock. In a span of less than 1 year, the share price has dropped from above RM4.00 to below RM2.00. Will it go to RM1.00? Who knows?

Chart: FGV's weekly chart as at Jun 16, 2015_3.00pm (Source: ShareInvestor.com)
 
The latest acquisition highlights the nagging problem in FGV: You have very limited time to address the problem of old trees by investing your IPO cash wisely. The best way to do that is to acquire controlling stake in large estates, which will come at a hefty premium.

It did  not serve the group well if this strategy is not pursued with a clear focus. Thus, its decision to invest in a London property was a serious & unnecessary diversion. Now, it suddenly announced two large acquisitions in one week! One of the deals is so far off the mark that you should organize a good briefing for analysts in order to convince them and, through them, the market. None was organized. 

The management of FGV has shown themselves to be uninterested in Investor Relation. Without good IR, you won't get a good price for your shares. Thus, you are failing to look after the interest of your shareholders- your ultimate bosses!

Notwithstanding the above, I maintain my stand on this stock as per my earlier post: FGV is a stock to be avoided but if you have already invested in it, you might as well hold it since the share price has been beaten down substantially.

Note:
In addition to the disclaimer in the preamble to my blog, I hereby confirm that I do not have any relevant interest in, or any interest in the acquisition or disposal of, FGV.


GDEX: An expensive stock had a fall!

Technical Outlook

In April, I posted about the bullish breakout for GDEX (go here). Shortly GDEX announced that its Executive Director, Wong Eng Su had resigned from the company. From then on, the stock began its steady decline from a high of RM1.84 to the current price of just under RM1.30. GDEX has a rebound in the morning session after coming close to the horizontal line at RM1.20.


Chart 1: GDEX's daily chart as at Jun 16, 2015_10.30am (Source: ShareInvestor.com)


Chart 2: GDEX's monthly chart as at Jun 16, 2015_10.30am (Source: ShareInvestor.com)
 
Recent Financial Results

From the table & diagram below, we can see that GDEX's financial performance is satisfactory.


Table 1: GDEX's last 8 quarterly results

 
Diagram 1: GDEX's last 25 quarterly results

Valuation

GDEX (closed at RM1.27 at the end of the morning session) commands a PE of 59 times (based on last 4 quarters' EPS of 2.15 sen). At this PE, GDEX is very expensive.

Conclusion

Despite the good financial performance, GDEX is hard to recommend as an investment as it is an expensive stock. It may find a support at RM1.20 and trades sideways for now.. Any strong rebound to the RM1.50 mark should be used as an opportunity to exit the stock for those who are holding it.

Note:
In addition to the disclaimer in the preamble to my blog, I hereby confirm that I do not have any relevant interest in, or any interest in the acquisition or disposal of, GDEX.

Friday, June 12, 2015

BJAuto: Earnings continued to impress

Results Update

For QE30/4/2015, BJAuto's net profit rose 19% q-o-q or 15% y-o-y to RM55 million while revenue rose 9% q-o-q or 7% y-o-y to RM424 million. the sequentially higher revenue was attributed to higher sales volume of Mazda vehicles in Malaysia with the new Mazda2 spearheading the growth. The Group's pre-tax profit for the current quarter increased by RM11.0 million or 16.6% largely due to higher revenue and better profit contribution from associated companies. 


Table: BJAuto's last 8 quarters' financial performance

From the diagram below, we can see that BJAuto's profits are in a steady uptrend. Despite the sharp swing in top-line, BJAuto's bottom-line keeps trending higher because of its rising profit margin. 


Chart 1: BJAuto's last 12 quarters' financial performance 

Valuation

BJAuto (closed at RM3.75 at the end of the morning session) has a PER of 14 times (based on last 4 quarters' EPS of 26.6 sen). With earnings growth of 62%, BJAuto's PEG ratio is at a low of 0.2 time. Thus, its valuation is deemed acceptable.

Technical Outlook

Just 2 days ago, I made a TAKE PROFIT call on BJAuto (here) as the share price has broken its long-term uptrend line. The rating call remains as the stock is pennant formation , abcd. If it can overcome this formation, BJAuto may chart a new uptrend line. t is more likely to trade sideways, guided by either one of the two horizontal lines, RM3.50 or RM3.10.


Chart 2: BJAuto's weekly chart as at Jun 12, 2015_11.30am (Source: Share Investors)

Conclusion

Based on good financial performance and attractive valuation for a growth stock, BJAuto is a good stock for long-term investment. However, its negative technical outlook means that the stock is likely to underperform in the near term. Thus, it is advisable to TAKE PROFIT on the stock.

Note: 
In addition to the disclaimer in the preamble to my blog, I hereby confirm that I do not have any relevant interest in, or any interest in the acquisition or disposal of, BJAuto.

FGV: Two deals in one week!

Recent Corporate Development

It is reported in Malaysian Insider (here) that FGV has been in talks with PT Eagle High's controlling shareholder Tan Sri Peter Sondakh to acquire a 30%-stake in PT Eagle High for RM1 billion. PT Eagle High is reported to own a total Indonesian land bank of 419,006ha, of which 147,000ha are planted.

This is a surprise after it announced on Monday, June 8 that it would be acquiring 4 companies and an oil palm estate from Golden Land Bhd at RM655 million. This acquisition effectively represents the purchase of oil palm estates of 24218 acres plus an palm oil mill. For more, go here.

The Sabah acquisition & the proposed Indonesian acquisition represent FGV's concerted effort to expand its oil palm land as well as to lower the average age of its tree profile. At the same time, the group is reported to be seeking buyer(s) for its crushing and refining businesses in the US and Canada, the people said. The asking price is reported to about US$150 million (RM559.74 million).

Recent Financial Results

FGV, which has suffered from 3 quarters of mediocre financial performance, will see its shares removed as a component stock of FBMKLCI soon. At its last traded price fo RM1.86, FGV has a PER of 40.8 times (based on last 4 quarters' EPS of 4.56 sen) or a PBR of 1.07 times (based on NTA of RM1.75 as at 31/3/2015). It paid out dividend totaling 10 sen or commanding a DY of 5.4%.


Table: FGV's last 10 quarters' financial performance (Source: ShareInvestor)


Diagram: FGV's last 10 quarters' financial performance (Source: ShareInvestor)

Technical Outlook

The multitude of negative factors has caused the stock to drop steadily in the past 1 year from RM4.60 to below RM2.00 today. It is in a clear downtrend line, with resistance at RM2.30. Until that downtrend line is taken out, the stock's outlook remains negative.


Chart: FGV's weekly chart as at Jun 11, 2015 (Source: ShareInvestor.com)
 
Conclusion

Based on poor financial performance, unattractive valuation & bearish technical outlook, FGV is a stock to be avoided. Nevertheless, the share price has taken such a heavy beating that those who have the stock, might as well hold onto it.

Note:
In addition to the disclaimer in the preamble to my blog, I hereby confirm that I do not have any relevant interest in, or any interest in the acquisition or disposal of, FGV.

Thursday, June 11, 2015

3A: The Start of the Upleg?

Technical Outlook

3A broke to the upside of its flag formation at RM1.04 & closed the morning session at RM1.11 (see Chart 1). This breakout could herald the start of an upleg for this stock which has declined from a high of RM2.30 in early 2010 and further consolidated for 18 months at RM0.85-1.05. Its next resistance levels are RM1.10-1.15, RM1.40 & RM1.60. For more, see Chart 2.


Chart 1: 3A's monthly chart as at Jun 11, 2015_12.30pm (Source: ShareInvestor)


Chart 23A's monthly chart as at Jun 11, 2015_12.30pm (Source: ShareInvestor)

Financial Results & Valuation

At this moment, it is hard to envision 3A going beyond RM1.40 as its financial performance is really nothing to shout about. With last 4 quarters' EPS of 4.6 sen, 3A is now trading at an elevated PE of 24 times.


Diagram: 3A's last 10 quarterly results

Conclusion

Based on technical consideration, 3A could be a good trading BUY. However, you need to exercise careful discretion in the current market.

Note:
In addition to the disclaimer in the preamble to my blog, I hereby confirm that I do not have any relevant interest in, or any interest in the acquisition or disposal of, 3A.

Airasia: It broke the RM2.00 mark!!!

Airasia broke the RM2.00 psychological support! It closed at RM1.86 at the end of the morning session. It may test the RM1.80 support soon.

The RM1.80 is a confluence of horizontal support, uptrend line support as well we the lower line of a downward channel. I believe that the stock should find its support at this level.

As such, it could be a good entry level for a long-term investment as well as trading BUY for a technical rebound.


Chart: Airasia's monthly chart as at Jun 11, 2015_12.30pm (Source: ShareInvestor)

Note:
In addition to the disclaimer in the preamble to my blog, I hereby confirm that I do not have any relevant interest in, or any interest in the acquisition or disposal of, Airasia.

Tuesday, June 09, 2015

IFCAMSC: A Bird In Hand...

The story for IFCAMSC has always been very compelling. It may explain why & how this stock managed to rally from a low of RM0.10 in January 2014 to a high of RM1.85 just last month.

IFCAMSC took a tumble in the past 3-4 weeks as investors were spooked by the sudden resignation of its new CFO- just 5 months into his new job. This unfortunate development may not be the main reason for the sell-down in the stock. Whenever a stock is priced richly - and to perfection, in the opinion of some - then any doubt could cause a sudden reprisal of a previously held opinion. Such is the reason why the over-reaction to the CFO's resignation.

Chartwise, I see weakness in this stock with bearish reading in the MACD & Slow Stochastic indicators. The share price is now struggling to hang onto the 21-week SMA line at RM1.30. If this support fails, its uptrend would be over. It could then transition to a sideways trend or even a downtrend.

Based on technical consideration, I think it may be a good idea to REDUCE one's position in this stock.


Chart: IFCAMSC's weekly chart as at Jun 9, 2015_11.30am (Source: Share Investors) 

Note: 
In addition to the disclaimer in the preamble to my blog, I hereby confirm that I do not have any relevant interest in, or any interest in the acquisition or disposal of, IFCAMSC.

BJAuto: Broke its long-term uptrend line

BJAuto broke its long-term uptrend line, SS at RM3.90 in early May. Since the stock has had a fine rally from a low of RM1.50 in late 2013 to a high of RM4.10 just last month, any correction could be quite severe.

Based on technical consideration, I am in favor TAKING PROFIT for BJAuto now.


Chart: BJAuto's weekly chart as at Jun 9, 2015_11.30am (Source: Share Investors) 

Note: 
In addition to the disclaimer in the preamble to my blog, I hereby confirm that I do not have any relevant interest in, or any interest in the acquisition or disposal of, BJAuto.

Harbour: Time to Harvest

When the stars are aligned, a stock can fly. Such is the case of Harbour which has a bullish breakout in April while its earnings were in an upswing. For more, go here.

In just a short 2 months, the stock rallied from RM1.70 to the current price of RM2.47 (as at 10:30am). At this price, Harbour is trading at a trailing PER of 9.3X - which is fairly attractive.

From the monthly chart below, we can see that Harbour was listed in early 2004. It started trading at RM2.50 and made a high of RM2.80 in the first month of trading. We are now seeing the stock revisiting this high.

Based on attractive valuation & strong momentum, I believe Harbour could still see further upside. However, I feel that we should consider taking profit on Harbour if the share price were to exceed the RM2.70 mark.


Chart: Harbour's monthly chart as at Jun 9, 2015_10.15am (Source: Share Investors) 

Note: 
In addition to the disclaimer in the preamble to my blog, I hereby confirm that I do not have any relevant interest in, or any interest in the acquisition or disposal of, Harbour.

USD-MYR: Surpassed its March high

USD-MYR rose sharply in the past 3 weeks to climb back above its "lost" uptrend line. This is probably a sign of investors' concern for the possible fallout from 1MDB default.


Chart 1: USD/MYR's daily chart as at June 8, 2015 (Source: XE.com)

If we looked at the long-term chart, we can see that BNM has in the past come in to support MYR if the rise of USD-MYR is excessive or overdone. We saw that in 2009, when USD-MYR broke above the then long-term downtrend line, R1-R1. I personally believe that the current breakout of RR would elicit similar BNM's intervention. The most likely level will the 3.75-3.80 mark.


 Chart 2: USD/MYR's monthly chart as at June 8, 2015 (Source: tradingeconomics.com)

A weak MYR will benefit exporters and impact importers. It would also impact those with large foreign denominated debts (example: Airasia & IOI Corp) while benefiting those who have investments overseas. However, if MYR weakness was brought on by a prolonged leadership problem that could easily morphed into a political crisis, then all of us will be the losers. We can only hope that our leaders would take the right action by putting the national interest above their personal interest.

Market Outlook as at June 8, 2015

FBMKLCI is struggling to avoid entering into a long-term downtrend. It needs a miracle- a strong rebound- to escape what looks like a losing battle. The signs are all there:
1) FBMKLCI is now below the 30-month EMA line. In the past 3 instances when this had happened (A, B & C), the market entered into a bear market.

2) 20 & 30-month EMA lines have both flattened. This is the precursor to both these EMA lines turning south. Again, these are present in the 3 instances mentioned above.

3) MACD has already cut below the MACD signal line. Again, these are present in the 3 instances mentioned above.

4) Slow Stochastic have gone below the 50 level. Again, these are present in the 3 instances mentioned above.

Chart 1: FBMKLCI's daily chart as at May 21, 2015 (Source: ShareInvestor.com)

What would trigger a sharp drop in the market? There are a number of possible triggers, such as a sharp fall in Wall Street or Shanghai, a nasty market reaction to Greece's highly likely exit from the European Union, a blow-up in Ukraine and, of course, a fallout from 1MDB.

If the bear market were to set in, there is no telling how low the index may go. While we can see support at 1700, 1670 & 1600, I believe that the bottom could well surpass these levels. If we use the upward channel as a guide, it is possible for the index to go as low as 1200.

In view of the above, I believe we should be very careful in this market.

Monday, June 08, 2015

Evergrn: Broke above its long-term downtrend line

Background

There was an article in the Star, where Yeoh Keat Seng recommended a BUY on Evergreen (here). According to him, the "MDF sector is turning around after suffering from over-capacity over the last five years, the consequence of massive capacity build-up following the Chinese government’s unprecedented 4 trillion yuan stimulus in 2008".

The sector-wide recovery is also reflected in the financials of 2 Asian MDF giants, "Vanachai of Thailand and Dongwha Enterprise of Korea, who had both have turned profitable since 1Q14. Their share prices have skyrocketed by 5x to 6x from their December 2013 low, while their FY15 valuations have rerated sharply to ~16x PE and 9x – 12 EV/EBITDA."

"As for Evergreen, it managed to turn around in 3Q14 onwards after seven consecutive quarters of red ink. We estimate that the company is currently trading on FY15 PE of only 8x".

Based on Yeoh Keat Seng's numbers, Evergrn could potentially double in value if its valuation matches those of its peers, like Vanachai of Thailand and Dongwha Enterprise of Korea.

Technical Outlook

Today, Evergrn broke above the recent high of RM1.28 (see Chart 1). This, coupled with the breakout above the long-term downtrend line at RM1.25 (see Chart 2), may that Evergrn's uptrend is likely to continue. Its next resistance levels are RM1.60, RM1.80 & RM2.00.

 
Chart 1: Evergrn's daily chart as at Jun 8, 2015 (Source: ShareInvestor.com)

 
Chart 2: Evergrn's monthly chart as at Jun 8, 2015 (Source: ShareInvestor.com)

Recent Financial Results

As mentioned earlier, Evergrn's bottom-line has returned to the black in 3Q14. In the past 3 quarters, we can see that net profit has risen steadily from RM10 million in 3Q14 to RM20 million in 1Q15.


Table: Evergrn's last 8 quarters' financial performance


Chart 3: Evergrn's last 41 quarters' financial performance

Conclusion

Based on satisfactory financial performance, attractive valuation & bullish technical outlook, Evergrn is a good stock for long-term investment.

Note:
In addition to the disclaimer in the preamble to my blog, I hereby confirm that I do not have any relevant interest in, or any interest in the acquisition or disposal of, Evergrn.

Thursday, June 04, 2015

CPO: A sudden surge

 CPO broke above its "horizontal line" at RM2230 two days ago. The sudden surge was brought on by reports of falling production, soaring export & El Nino fears. Falling output at this time of the year is not a surprise because of the wintering effect. A lot has been made about the impact of El Nino on FFB output but it often never panned out.

 
Chart 1: CPO's daily chart as at Jun 4, 2015 (Source: ifs.marketcenter.com)

Compared to the more sedate price rise in soyabean, the jump in CPO prices look excessive. However, the breakout above the RM2230 resistance is welcome. We hope that it will translate to better selling prices for CPO and better earnings for our plantation companies.


Chart 2: Soyabean's daily chart as at Jun 4, 2015 (Source: ino.com)