Saturday, July 15, 2006

US stock markets to face serious test next week

Like the rest of the global markets, the Malaysian stock market was severely battered yesterday (July 14). The CI dropped 12.92 points to close at 913.63. Losers outnumbered gainers 827 to 90. Volume stood at 1.16 billion shares traded.

Many would attribute the current round of equity market sell-off to the sharp rise in the price of crude oil and the big mess in the Middle East. But, the signs of a fresh sell-off has been there for the past 1 or 2 weeks and most technical analysts had been expecting the market to re-test its June low. Now, we know that this "test of the low" has claimed its first "casualty" i.e. Nasdaq. Nasdaq closed at a new recent low of 2054.11 on last Thursday (July 13). Yesterday, it dropped a further 16.76 points to 2037.35 (see Chart 1). Not only has Nasdaq failed its test of the low, it has also broken its then-prevailing uptrend line at the 2100 levels.
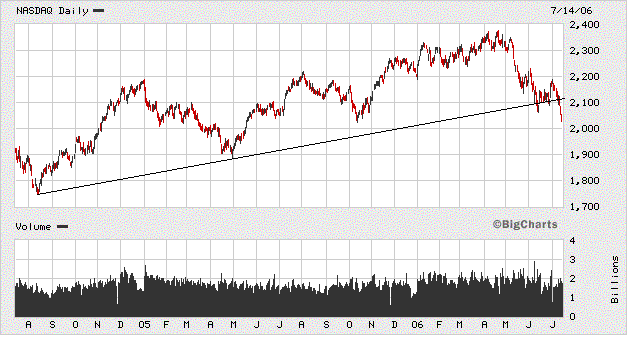


Chart 1: Nasdaq's daily chart as at July 14


The other 2 main indices in the US i.e. Dow Jones Industrial Average ("DJIA") & S&P500 are poised to do their respective test of the low (10650 for DJIA & 1220 for S&P500) as well as to test their uptrend line supports (10400 for DJIA & 1220 for the S&P500). On Friday (July 14), the DJIA and the S&P500 closed at 10739.35 & 1236.20, respectively. The outcome of these tests would signal the direction of the US equity markets as well as many global markets (see Chart 2 & 3 below).
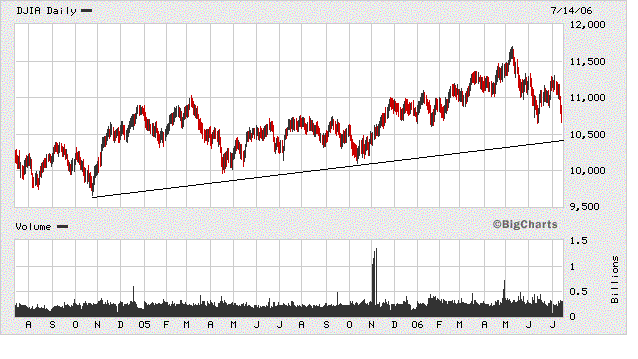


Chart 2: DJIA's daily chart as at July 14
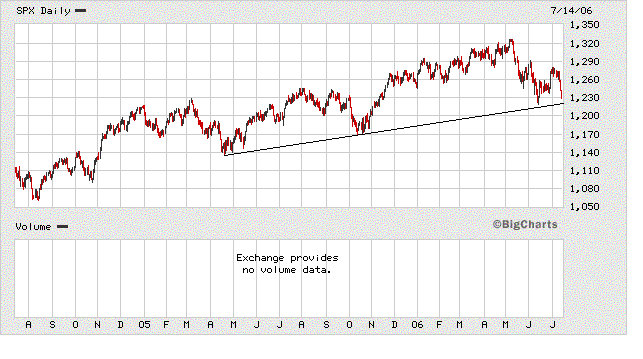


Chart 3: S&P500's daily chart as at July 14

Friday, July 14, 2006

Market Alert- CI broke 8-day MA & horizontal support

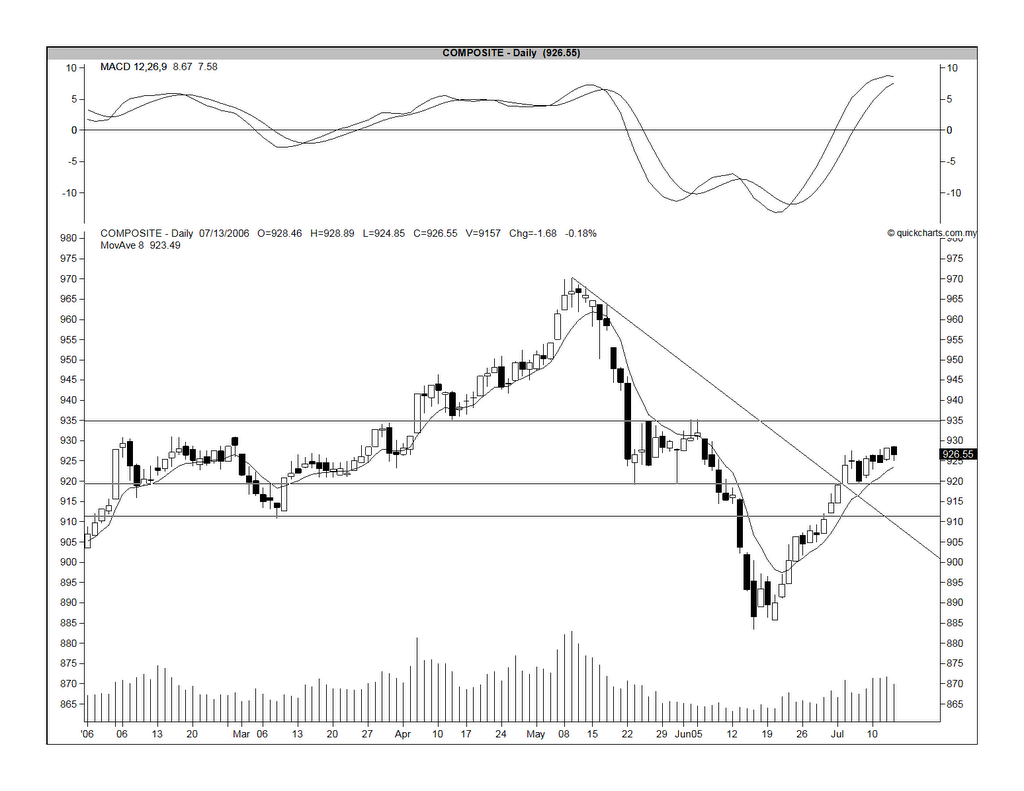
Due to external factors such as sharp rise in crude oil price and sharp drop in oversea stock markets, our CI has dropped substantially this morning. At 12.00 noon, CI has dropped 8.61 point to 917.94. As a result, the CI has broken its 8-day Moving Average ("MA") at the 923 mark as well as its strong horizontal support at the 919/920 levels (see Chart below). Unless a re-bounce happens later (or by Monday), the CI's current short-term uptrend appears to be over.


Chart: CI's daily chart as at July 13

Thursday, July 13, 2006

Suiwah Corporation Bhd

Business Activities

Suiwah Corporation Bhd ("Suiwah") is involved in 2 main lines of business i.e. retailing and manufacturing of Flexible Printed Circuit ("FPC") boards.

Past & Future Financial Performance


From the above, we can see that Suiwah's turnover has enjoyed a compounded growth rate of about 14% for 5 years from RM 221.9 mil in FYE 2000 to RM 416.8 mil in FYE 2005. During that period, its net profit had tripled from RM 8.3 mil to RM 25.7 mil. Based on S&P's research report dated April 28, Suiwah is expected to report a net profit of RM 26.2 mil for 2006 on the back of turnover of RM 478.4 mil. 2006 EPS is forecast to be about 43.0 sen.

Current Financial Performance


If you compared the last 4 quarterly results with the preceding 4 quarterly results, you can see that net profit has increased by 18.32% from RM 22.1 mil to RM 26.1 mil. This is achieved on the back of a 2.5%-incraese in turnover from RM 410.4 mil to RM 420.8 mil. As a result, EPS has increased by 11.3% from 38.46 sen to 42.82 sen.

Valuation

Based on the closing price as at July 12 of RM2.00, the stock is trading at a PE of 4.7 times or 0.8 times its book value. This is fairly cheap.

Technical Outlook

The chart below shows that the stock is in a gradual long-term uptrend. We can see that the RM2.00 levels should been a strong uptrend line support.


Suiwah's monthly chart as at July 12, 2006

Future Prospect

Suiwah has planned to divest its FPC boards manufacturing division, known as Qdos, to its shareholders. This exercise could be the catalyst for a re-rating of this stock.

Weakness noted

The main weakness is the stock has very low trading volume.

Recommendation

Based on cheap fundamental valuation & fairly good technical outlook, I would recommend a BUY for Suiwah at the current price of around RM2.00.

Stock Alert- KPJ breaks its resistance while JLand may test its soon

KPJ Healthcare ("KPJ"), the largest private medical services provider in Malaysia, has seen its share price enjoying a strong run-up this morning. The share jumped 19 sen to close at RM1.85 at the close of the morning session. Volume traded was very impressive at 18,515 lots. KPJ’s last 4 quarterly earning totaled 16.9 sen per share. At the closing price of RM1.85, the stock is trading at a PE of 10.9 times.

What is interesting is the stock has just broken above its long-term resistance of RM1.83 (see Chart 1). There are 2 other minor resistances at RM1.91 and RM1.96 before it may test the psychological level of RM2.00. I would recommend a trading buy at the current level with a stop loss of RM1.83.


Chart 1: KPJ's monthly chart as at July 12

Another counter whose share price has enjoyed a strong price run-up is Johor Land ("JLand"). Like KPJ, JLand is also a subsidiary of Johor Corporation. JLand is a property development company as well as being involved in metal door frame manufacturing; sale of ready-mix concrete; and trading in building material. Jland’s last 4 quarterly earning totaled 9.5 sen per share. At this morning session's closing price of RM1.11, the stock is trading at a PE of 11.7 times.

The stock, which closed at RM0.815 on July 7 (last Friday), has gained 23 sen in the past 2 days (see Chart 2). This morning it gained another 7 sen to close at RM1.11 at the close of the morning session. At this level, the stock is poised to test its long-term horizontal resistance of RM1.19 very soon. If it can successfully break above that mark, I would recommend a trading buy for JLand with a stop loss of RM1.19.


Chart 2: Jland's monthly chart as at July 12

Wednesday, July 12, 2006

Stock Alert- Airasia broke strong support

Airasia broke its horizontal strong at the RM1.44/1.45 levels. It is hard to see what's the next support level. It could be the low recorded immediately after its listing i.e. RM1.25. My recommendation for this stock is to sell or reduce your holding until the dust has settled. Buying at this moment is not adviseable.

The selldown is probably attributable to foreign funds who collectively may have too much exposure to this stock. They may have been disappointed with Airasia's recent poorer results.


Chart: Airasia's weekly as at June 11

What's up with Mesdaq?

Mesdaq has recovered almost all its losses since the May and June turmoil. During that peiod, Mesdaq dropped from a high of 128.40 on May 11 to a low of 104.04 on June 15. Since the low, Mesdaq has been going up & yesterday it gained 2.47 points to close at 126.68; just 1.72 points shy of its May high (see Chart 1). Yesterday's market action in the Mesdaq was particularly strong, with gainers leading losers 73 to 11. Volume of shares traded was very high at 363.6 million units.


Chart 1: Mesdaq's weekly chart as at June 11

If Mesdaq can can break through the 128-130 levels, it would be poised to test the 140-141 levels (see Chart 2). The latter is the downtrend line resistance for the Mesdaq since its inception in March 2002. A break above the 140-141 levels would be very bullish for Mesdaq. Some analysts are already preparing for that day and are hoping that the Mesdaq would do for the Malaysian stock market in 2006 what the Second Board did in 1996.


Chart 2: Mesdaq's monthly chart as at June 11

How to participate in the Mesdaq play?

My feeling is that the first attempt at the 128-130 levels, which may happen in the next 2 or 3 days, is unlikely to succeed. Why do I think so? I believe that Mesdaq's current rally at the present pace is unsustainable. The 128-130 levels would be a good point for Mesdaq to take a pause. The Mesdaq may pullback to the 120 horizontal support level or even to the 110 uptrend line support before re-testing the 128-130 levels later (see Chart 3).


Chart 3: Mesdaq's daily chart as at June 11

The really tricky situation would be if the Mesdaq break above 128-130 levels. Should we buy into the breakout or should we wait to see whether it is bull trap? That's the tough call and we shall cross it when we come to it. At this point, my recommendation is to sell into the 128-130 levels until a breakout happens.

Tuesday, July 11, 2006

Market Outlook as at July 11, 2006

My market outlook as at July 6, 2006 remains unchanged. I still expect trading to be range-bound between 920 to 935 levels, with greater volatility than what one has experienced in the past 2 to 3 weeks.

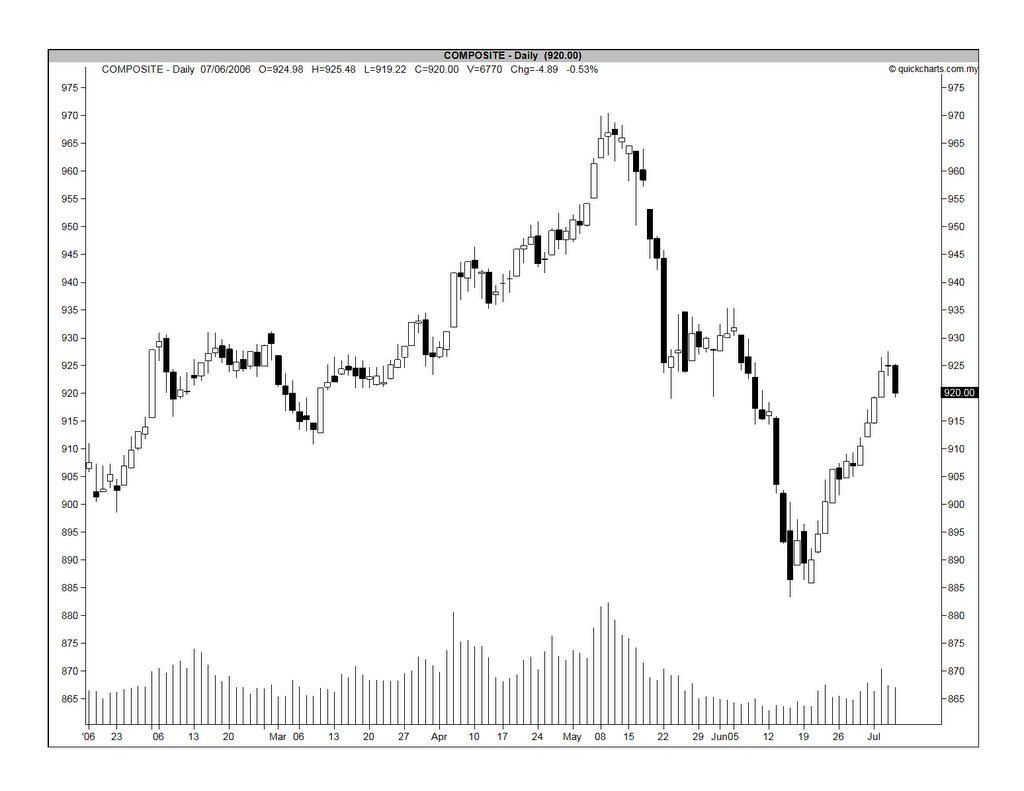
My market alert issued on Thursday (July 6) may now appear a bit alarming. To wit, I had issued the market alert to point out that the market’s short-term outlook might have turned negative as a sign of reversal in the form of a Japanese candlestick pattern known as an Evening Doji Star was sighted. On hindsight, we can attribute the sharp drop in the CI on Wednesday (July 5) to the market’s overreaction to two news items; firstly, the Tajudin Ramli’s revelation regarding his acquisition and subsequent disposal of MAS shares and, secondly, negative development in the Korean Peninsular. The subsequent recovery on Friday (July 7) was very convincing as reflected by the 5.56-point gain in the CI (which closed at 925.56). Gainers led losers 482 to 241. Volume increased to 794.4 million shares compared with 677.0 million on the previous day.

Yesterday’s trading was even heavier with 1.062 billion shares traded. Losers, however, outnumbered gainers 381 to 329. The CI dropped 0.70 point to close at 924.86. Heavy volume unaccompanied by gain in the CI after a sustained rally could be a sign of distribution. In the light of the earlier market alert, I would advise caution for any trading in the market for the days ahead.

Friday, July 07, 2006

Market Alert- Evening Doji Star sighted

The CI closed yesterday with a Candlestick Pattern known as an Evening Doji Star (go here to find out more about candlestick patterns). With the appearance of this pattern, I expect the market's current rally to turn choppy and then reverse downward.

Thursday, July 06, 2006

Juan Kuang (M) Industrial Bhd

Business Activities

Juan Kuang (M) Industrial Bhd (“Juan Kuang”) is a Second Board company that is involved in the manufacture & supply of wiring harness systems (for motor vehicles) and auto accessories as well as being an importer & wholesaler of electrical products & access.

Past Financial Performance


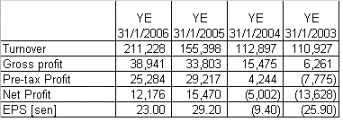
From the above, we can see that Juan Kuang has done a turnaround in FYE 31/1/2005. This is quite a change from a net loss of RM13.6 mil in FYE 31/1/2003 to a net profit of RM12.2 mil in FYE 31/1/2006. This was achieved on the back of a turnover that has increased at a compounded rate of about 25% per annum in the past 3 years.

Current Financial Performance


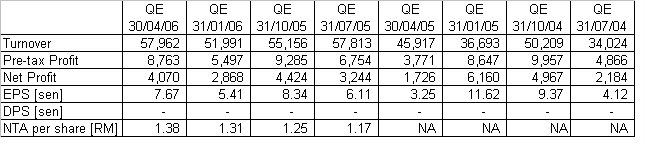
If you compared the last 4 quarterly results with the preceding 4 quarterly results, you can see that turnover has increased by 33.6% from RM 166.8 mil to RM 222.9 mil. Unfortunately, net profit declined 2.9% from RM 15.0 mil to RM 14.6 mil. EPS has similarly dropped marginally from 28.36 sen to 27.53 sen. The decline in profitability has been attributed to increased raw material cost which Juan Kuang has not been able to pass on to its customers.

Valuation

Based on the closing price as at July 5 of RM1.10, the stock is trading at a PE of 4 times or 0.8 times its book value. This is fairly cheap.


Technical Outlook

The chart below shows that the stock is in a gradual uptrend. An imperfect “uptrend line” has been drawn and, from it, we can see that the RM1.00 levels should been a strong support. [The uptrend line drawn has ignored the poor prices during the June to August 2004 period.]


Juan Kuang’s weekly chart as at July 5, 2006

Future Prospect

Juan Kuang has carried out a big expansion program in January this year which has doubled the size of its production floor area. This new factory, which has been leased from Tzel Assets Sdn bhd, has increased the production floor area by 137,072 sq. ft. from the existing area of 142,990 sq. ft. It is used for the production wire harness systems. With this expansion, the turnover should increase by about 20-30% this year.

Weaknesses noted

The main weaknesses noted are:
• Juan Kuang has not paid dividend in the past 4 years.
• The stock has very low trading volume.

Recommendation

Based on cheap fundamental valuation & fairly good technical outlook, I would recommend a BUY for Juan Kuang at a price between RM1.00-1.10 levels.

Market Outlook as at July 6, 2006

This is the first Market Outlook segment to be posted on this weblog. Ideally, this segment should be updated at the beginning of the week but the weblog was only set up yesterday.

As noted in my email dated July 4, the CI has broken above the downtrend line at the 920 levels [see Chart 1]. This breakout will confirm that the current downtrend has been reversed. After this, the market may go into an uptrend or it may go sideway. That has yet to be established.


Chart 1: CI’s daily chart as at 20060706

From Chart 1, you can see that the CI has also surpassed the horizontal resistance of 919. The next resistance is at 935. Since the May 9 high of 970.46, the CI has dropped to a low of 883.29 on June 15. A 50% retracement of this loss would move the CI to 926 while 68% retracement would move it to 948.

On longer term, the CI is still trapped within an upward sloping wedge (a.k.a. a bearish wedge). You may recall that I have commented in an earlier email that there was a breakdown of the wedge for the CI which has turned it into a reversal pattern. I have now redrawn the wedge to be consistent with the symmetrical triangle that appears in the Emas (now defunct). The Emas was discontinued with the introduction of the FTSE Bursa Malaysia Index series on June 6 (see Chart 3).

Based on the redrawn wedge, the CI would face strong resistance at the 975 levels. A break above 975 would be very bullish for the market. On the other hand, the CI would have strong support at the 890 levels. A break below 890 would be very bearish for the market (see Chart 2 below).


Chart 2: CI’s weekly chart as at 20060706


Chart 3: Emas’ weekly as at 20060622

Wednesday, July 05, 2006

Welcome to Nexttrade

Nexttrade is designed to advise the users of the general outlook of securities quoted on the Malaysian stock market, known as Bursa Malaysia. In addition, users will also be advised on the outlook of individual stock as well as sector, basing on fundamental or technical analysis.

To achieve these, the Weblog shall provide weekly technical outlook for the market as a whole. Occasionally, market alerts may be issued when the market did a breakout, whether bullish or bearish. Individual stock or sector recommendation will only be issued when an underweight or overweight recommendation is warranted.

Nexttrade is free and no subscription is required. If you find the information provided in this weblog to be useful, please share it with your friends.