As noted in my email dated July 4, the CI has broken above the downtrend line at the 920 levels [see Chart 1]. This breakout will confirm that the current downtrend has been reversed. After this, the market may go into an uptrend or it may go sideway. That has yet to be established.

Chart 1: CI’s daily chart as at 20060706
From Chart 1, you can see that the CI has also surpassed the horizontal resistance of 919. The next resistance is at 935. Since the May 9 high of 970.46, the CI has dropped to a low of 883.29 on June 15. A 50% retracement of this loss would move the CI to 926 while 68% retracement would move it to 948.
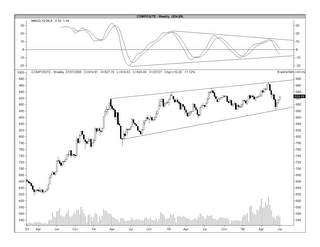
On longer term, the CI is still trapped within an upward sloping wedge (a.k.a. a bearish wedge). You may recall that I have commented in an earlier email that there was a breakdown of the wedge for the CI which has turned it into a reversal pattern. I have now redrawn the wedge to be consistent with the symmetrical triangle that appears in the Emas (now defunct). The Emas was discontinued with the introduction of the FTSE Bursa Malaysia Index series on June 6 (see Chart 3).
Based on the redrawn wedge, the CI would face strong resistance at the 975 levels. A break above 975 would be very bullish for the market. On the other hand, the CI would have strong support at the 890 levels. A break below 890 would be very bearish for the market (see Chart 2 below).

Chart 2: CI’s weekly chart as at 20060706

Chart 3: Emas’ weekly as at 20060622
No comments:
Post a Comment