Monday, November 23, 2015

QL: Earning continued to trend higher

Results Update

For QE30/9/2015, QL's net profit increased by 35% q-o-q or 15% y-o-y to RM55 million while revenue increased by 5% q-o-q & y-o-y to RM690 million.


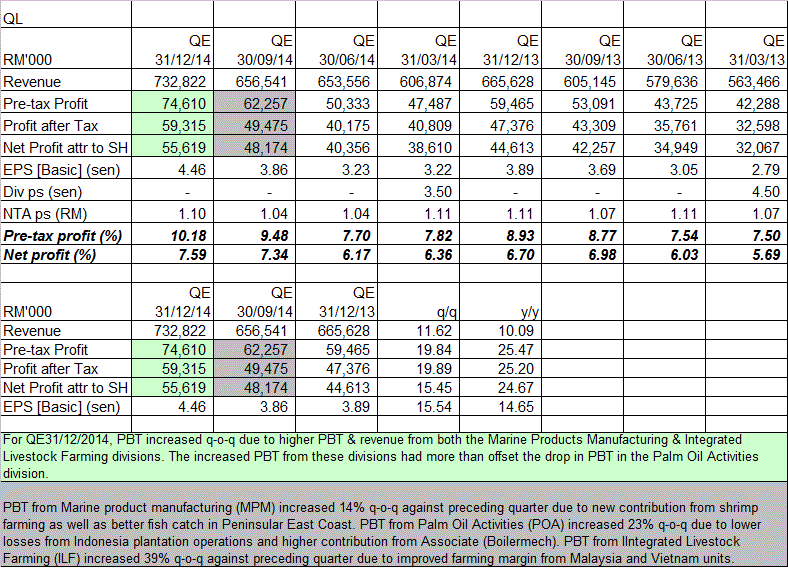
Table 1: QL's last 8 quarterly results

PBT increased q-o-q due to higher PBT & revenue from both the Marine Products Manufacturing & Integrated Livestock Farming divisions. The increased PBT from these divisions had more than offset the drop in PBT in the Palm Oil Activities division.


Table 2: QL's Segmental Results

It is good to note that the profit margin has inched up in the past 5 quarters. This, plus the rising revenue, would lead to higher bottom-line going forward.


Chart 1: QL's last 30 quarterly results

Valuation

QL (closed at RM4.20 last Friday) is now trading at a PE of 26 times (based on last 4 quarters' EPS of 15.90 sen). Based on the PE of 26 times & last year's earning growth of 12%, QL's PEG ratio stood at 2.2 times. This means that QL is overvalued.

Technical Outlook

QL continued its uptrend line with support at RM4.00. Immediate resistance is the recent high of RM4.20.


Chart 2: QL's weekly chart as at Nov 20, 2015(Source: ShareInvestor.com)

Conclusion

Based on satisfactory financial performance & positive technical outlook, QL is still a good stock for long-term investment. However, its upside is limited as it is fairly valued with signs of technical weakness emerging. 

Note: 
In addition to the disclaimer in the preamble to my blog, I hereby confirm that I do not have any relevant interest in, or any interest in the acquisition or disposal of, QL.

Evergrn: Earning continued to rise

Results Update

In QE30/9/2015, Evergrn's net profit rose 15% q-o-q or 174% y-o-y to RM27.6 million while revenue was mixed - down 2% q-o-q but up 9% y-o-y - at RM256 million. Profits increased q-o-q mainly contributed  by the lower cost of glue, higher operational efficiency and synergistic cost savings derived from the group's recent restructuring of certain operational facilities.


Table: Evergrn's last 8 quarters' financial performance


Chart 3: Evergrn's last 43 quarters' financial performance

Valuation

Evergrn (closed at RM2.14 last Friday) is now trading at a trailing PER of 12.8 times (based on last 4 quarters' EPS of 16.75 sen. At this PER, Evergrn is still deemed attractive.

Technical Outlook

Evergrn has tested its 2007 high of RM2.20. If it can surpass this level, it may continue its uptrend. Its immediate support levels are the psychological RM2.00 mark & the 2010 high of RM1.80.


Chart 2: Evergrn's monthly chart as at Nov 20, 2015 (Source: ShareInvestor.com)

Conclusion

Based on satisfactory financial performance, attractive valuation & bullish technical outlook, Evergrn is a good stock for long-term investment.

Note:
In addition to the disclaimer in the preamble to my blog, I hereby confirm that I do not have any relevant interest in, or any interest in the acquisition or disposal of, Evergrn.

Thursday, November 19, 2015

TChong: Earning recovery may have started

Result Update

For QE30/9/2015, TChong's net profit increased by 106% q-o-q or 15-fold y-o-y to RM29 million while revenue was up 9% q-o-q or 20% y-o-y to RM1.37 billion. Revenue increased for all 3 divisions; Automotive, Financial Services & Other Operations by 8.6% to RM1.355 billion, 8.7% to RM14.2 million & 78.3% to RM4.1 million, respectively. This resulted in increase in EBITDA by 43.0% to RM78.7 million, 1.6% to RM6.1 million & 11.0% to RM9.1 million respectively.


Table: TChong's last 8 quarterly results

TChong's revenue continued to rise and the small uptick in profits & profit margins continued to inch higher. We could have seen the worst in TChong's financial performance and recovery is now in progress.


Chart 1: TChong's last 36 quarterly results

Valuation

TChong (closed at RM2.88 yesterday) is now trading at a PER of 324 times (based on last 4 quarters' EPS of 12 sen). At this PER, TChong is deemed overvalued. However, with earnings on the rise, PER will continue to rollback and valuation will become more appealing in the next few quarters.

Technical Outlook

TChong has rebounded after testing the 'horizontal line', AB (see Chart 2). It will soon test its intermediate downtrend line, SS at RM3.00 (see Chart 3). If it succeeds in breaking thru the downtrend line and it will have a chance to test the horizontal line at RM4.00.


Chart 2: TChong's monthly chart as at Nov 18, 2015 (Source: ShareInvestor.com)


Chart 3: TChong's weekly chart as at Nov 18, 2015 (Source: ShareInvestor.com)

Conclusion

Based on improved financial performance, TChong could be a good stock for recovery play. However, it must be noted that the technical outlook is still far from bullish. If it can break above the RM3.00 downtrend line, the technical outlook would change and the upleg could then begin.

Note: 
In addition to the disclaimer in the preamble to my blog, I hereby confirm that I do not have any relevant interest in, or any interest in the acquisition or disposal of, TChong.

Kianjoo: Earning continued to rise

Result Update

For QE30/9/2015, Kianjoo's net profit increased by 25% q-o-q or 17% y-o-y to RM44 million while revenue increased by 3% q-o-q or 22% y-o-y to RM404 million. PBT increased q-o-q due to higher PBT from the cans division (from RM36.4 million to RM45.9 million) which more than offset the drop in PBT from the cartons division (from RM4.7 million to RM3.7 million resulting from a loss on USD loan). Revenue increased due mainly to higher revenue from the cartons division as a result of increased demand from Vietnamese customers preparing for the festive season.


Table 1: Kianjoo's last 8 quarterly results

Kianjoo's quarterly PBT managed to finally break above the RM50 million mark for the first time. This could herald a new exciting era for the company. Unfortunately, it is likely to be taken private by Aspire Insight Sdn Bhd at RM3.30 shortly. See below.


Chart 1: Kianjoo's last 36 quarterly results
 
Valuation

Kianjoo (closed at RM3.36 yesterday) is now trading at a PE of 10.4 times (based on last 4 quarters' EPS of 32.3 sen). At this multiple, Kianjoo is deemed attractively valued.

Outstanding Privatization Proposal

In 2013, Aspire Insight- a 60:40 JV between Kianjoo's former COO, Chee Kay Leong & EPF) made an offer to privatize Kianjoo at a price of RM3.30  per share. This offer faced legal challenges from substantial shareholders, such as Anthony See, which had since been resolved.

The offer made by Aspire Insight was based on FY2013 PER of 12.4 times & 1.4 times NTA. With potential renewed interest from a Japanese party and better financial results over the past 2 years, Aspire Insight might have to revise its offer price to induce more acceptance. The market seems to believe that this is likely as reflected by the share price trading at above the offer price of RM3.30 If the offeror were to revise the price, the new price is likely to be RM3.80-4.00.

Technical Outlook

Kianjoo is in an "uptrend" line with support at RM3.00. Resistance will be at RM3.60.


Chart 2: Kianjoo's monthly chart as at Aug 28, 2015 (Source: ShareInvestor.com)

Conclusion

Based on good financial performance, attractive valuation & positive technical outlook, Kianjoo is a good stock to consider for long-term investment. The only drawback is the outstanding privatization offer at RM3.30 which will force an exit on shareholder at below the current trading price.

Note:
In addition to the disclaimer in the preamble to my blog, I hereby confirm that I do not have any relevant interest in, or any interest in the acquisition or disposal of, Kianjoo.

Wednesday, November 18, 2015

FLBHD: Flying on the USD carpet!

Results Update

From the table & chart below, we can see that profits continued to rise despite a drop in turnover. This is a reflection of how much the company is benefiting from the weakening of our MYR. This may not be a good thing when the tide goes out.


Table: FLBHD's last 12 quarterly results


Chart 1: FLBHD's last 12 quarterly results

Valuation

FLBHD (closed at RM2.69 as at 9.20am today) has a trial PER of 10.8 times (based on last 4 quarters EPS of 25 sen). At this PER, FLBHD is no longer a cheap stock as posted earlier. I would rate it as fully valued at this point of time.

Techncial Outlook

FLBHD's uptrend kicked in after it broke above the RM1.80 neckline of the inverted head-and-shoulders formation (highlighted here). Its potential target is about RM2.90.


Chart 2: FLBHD's monthly chart as at Nov 17, 2015_9.20am (Source: ShareInvestor.com)

Conclusion

Based on substantial price run-up and full valuation, FLBHD is rated a SELL INTO STRENGTH as it comes near the RM2.90 mark.

Note: 
In addition to the disclaimer in the preamble to my blog, I hereby confirm that I do not have any relevant interest in, or any interest in the acquisition or disposal of, FLBHD.

Hevea: Weighed down by USD loan, earning still managed to grow

Results Update

For QE30/9/2015, Hevea's net profit increased by 17% q-o-q or 216% y-o-y to RM18 million while revenue grew by 11% q-o-q or 29% y-o-y to RM124 million.

Revenue increased y-o-y due to increased revenue from the particleboard sector (as a result of higher volume and higher average selling price from sales of higher grade, value added products and strengthening of USD) and the RTA manufacturing sector (due to higher productivity, efficiency and also the capability to produce higher value and wider range of products).

Profit before taxation increased y-o-y due mainly to better performance in the particleboard & RTA manufacturing sectors despite being impacted  by  unrealized  exchange loss of  RM10.23  million due to the translation of the USD denominated term loan.


Table: Hevea's last 8 quarterly results


Chart 1: Hevea's last 32 quarterly results

Valuation


Hevea (closed at RM1.39 yesterday) is now trading at a PE of 9.7 times (based on last 4 quarters' EPS of 14.3 sen. At this PER, Hevea is still deemed fairly attractive. It may command a PER of 12 times.

Technical Outlook

Hevea has been on a strong uptrend since it broke above its long-term downtrend line, RR at RM0.23 in November 2013. The 30-month EMA line may serve as its uptrend line, with support at RM1.10.


 Chart 2: Hevea's monthly chart as at Nov 17, 2015  (Source: ShareInvestor)


 Chart 2: Hevea's weekly chart as at Nov 17, 2015  (Source: ShareInvestor)

Conclusion

Based on good financial performance, relatively attractive valuation & positive technical outlook, Hevea remains a good stock for long-term investment.

Note:
In addition to the disclaimer in the preamble to my blog, I hereby confirm that I do not have any relevant interest in, or any interest in the acquisition or disposal of, Hevea.

MPI: Another quarter of strong earning growth

Result Update

For QE30/9/2015, MPI's net profit jumped 37% q-o-q or 136% y-o-y to RM47 million. PBT increased 34% q-o-q due to strengthening of USD via-a-vis the MYR. Revenue increased from RM373 million to RM387 million - revenue increased by 17% for USA but remained flat for Europe and Asia.


Table: MPI's last 8 quarterly results


Chart 1: MPI's last 33 quarterly results 

Valuation

MPI (closed at RM7.35 yesterday) is now trading at a trailing PER of 10 times (based on last 4 quarters' EPS of 71 sen). At this PE multiple, MPI is deemed fairly attractive.

Technical Outlook

From Chart 2, we can see that MPI has broken above the long-term downtrend line at RM4.50 last year.


Chart 2: MPI's monthly chart as at Nov 17, 2015 (Source: ShareInvestor.com)

From the weekly chart (Chart 3), MPI's upside is capped by the line, AB at RM7.50. An upside breakout above this line could signal the continuation of the prior uptrend. The next resistance will be at RM9.50.
  

Chart 2: MPI's weekly chart as at Nov 17, 2015 (Source: ShareInvestor.com)

Conclusion

Based on good financial performance and attractive valuation, MPI is a good stock for long-term investment.

Note:
In addition to the disclaimer in the preamble to my blog, I hereby confirm that I do not have any relevant interest in, or any interest in the acquisition or disposal of, MPI.

Monday, November 16, 2015

Live Webinar: Stock Selection Using Fundamental Analysis (UPDATED)

KC Lau has invited me to do a webinar for his listeners. He is the publisher of KCLau, a website that specializes on all matters relating to personal finance. I have chosen to speak on the topic of stock selection. If you are interested to listen to my presentation, you can register here. The webinar will be on from 10:00-11:00am tomorrow (November 17).


For those who like to listen to the webinar, you can go to:

The full replay is for about 7 days, and it will be taken down after 24 November.
You can also download a copy of the video here:
https://s3.amazonaws.com/webinarkclau2/2015/11/StockSelectionFA-AlexLu.mp4

Saturday, November 14, 2015

MBSB: Another disappointing quarter

Result Update

For QE30/9/2015, MBSB's net profit plunged by 34% q-o-q or 67% y-o-y to RM63.5 million while revenue was unchanged q-o-q but rose 13% y-o-y to R768 million. The drop in NP was mainly due to higher allowances for impairment losses on loans, advances and financing.


Table: MBSB's last 8 quarterly results

A closer look at the chart below reveals that MBSB's bottom-line continued to slide even though top-line increased. This is due to the continued decline in its profit margin- mainly due to higher allowances for impairment losses.


Chart 1: MBSB's last 45 quarterly results

Valuation

MBSB (at RM1.69 yesterday) is now trading at a trailing PER of 6.8 times (based on the annualized EPS of 24.8 sen). However, if MBSB's performance going forward mirrors those of the last 3 quarters, then its full-year EPS would be about 13.6 sen and its PER would rise to 12.4 times.  At this PER, MBSB is fully valued.

(Note: MBSB's net profit for QE31/12/2014 rose due to the recognition of deferred tax in relation to origination & reversal of temporary differences.)

Technical Outlook

MBSB is in a downward line, with resistance at RM1.80. MBSB's share price movement for the past 1 year is confined within an irregular downward channel.

 
Chart 2: MBSB's weekly chart as at Nov 13, 2015 (Source: ShareInvestor.com)

MBSB's long-term share price movement seems to be within a curving upward channel. It tested the lower line at RM1.30 & rebounded. With the latest quarterly result, I expect the share price to slide towards the lower line again. Support can appear at RM1.50, RM1.40 & RM1.30.

 
Chart 3: MBSB's monthly chart as at Nov 13, 2015 (Source: ShareInvestor.com)

Conclusion

Based on poorer financial performance, tougher operating environment & bearish technical outlook, I maintain the rating of REDUCE for MBSB.

Note: 
In addition to the disclaimer in the preamble to my blog, I hereby confirm that I do not have any relevant interest in, or any interest in the acquisition or disposal of, MBSB.

Friday, November 13, 2015

Market Outlook as at November 13, 2015

FBMKLCI tested & failed to cross their intermediate downtrend line. See Chart 1.


Chart 1: FBMKLCI's weekly chart as at Nov 13, 2015_10.00am (Source: ShareInvestor.com)

FBM70 Index (representing the 2nd liner stocks) is set to test its intermediate downtrend line. Its MACD, ADX & Slow Stochastic are however showing some weakness- possible sign of a possible failure to break above the downtrend. See Chart 2.


Chart 2: FBM70's weekly chart as at Nov 13, 2015_10.00am (Source: ShareInvestor.com)

Meanwhile the small-cap stocks, ACE Market stocks & fledging stocks are putting in a better showing than their big brothers. FBMSCAP has just broken above its intermediate downtrend line (see Chart 3).


Chart 3: FBMSCAP's weekly chart as at Nov 13, 2015_10.00am (Source: ShareInvestor.com)

FBMACE has also broken above its medium-term downtrend line & continues to rally (see Chart 4).


Chart 4: FBMACE's weekly chart as at Nov 13, 2015_10.00am (Source: ShareInvestor.com)

The biggest surprise of all: FBMFLG has broken above its medium-term downtrend line and may soon revisit its August-September 2014 high (see Chart 5).


Chart 5: FBMFLG's weekly chart as at Nov 13, 2015_10.00am (Source: ShareInvestor.com)

These charts show clearly that fund managers are raising cash & staying sideline while small players are rushing in where angels fear to tread. Let the Edge Daily November 11 front-page be a warning to those who threw caution to the wind. Be careful out there!


via the Edge Daily

Thursday, November 12, 2015

Tienwah: Earning roared back

Result Update

For QE30/9/2015, Tienwah's net profit rose 166% q-o-q or 298% y-o-y to RM14.6 million while revenue rose by 11% q-o-q or 8% y-o-y to RM96 million. Tienwah's bottom-line roared back due to higher revenue, increased in the share of profits of an associate and lower depreciation charge. The latter was due to revision of the useful life of its plant & machinery which resulted in a RM3.2 million reduction in  the depreciation charge in the current quarter; of  which RM2.1million related to adjustments from 1 January 2015 to 30 June 2015.


Table: Tienwah's last 8 quarterly results

Below I present the chart of Tienwah's P&L & profit margins for the past 35 quarters. The 2 charts on the left are unadjusted while the 2 charts on the right are adjusted for changes in depreciation. You can see that the adjusted charts do not take away too much from what is a substantial improvement in Tienwah's performance, both top-line & bottom-line.


Chart 1: Tienwah's last 35 quarterly results

Valuation

Tienwah (closed at RM1.82 yesterday) is trading at a trailing PE of 7.6 times (based on the last 4 quarters' my projected EPS 23.8 sen). If the one-off improvement due to depreciation reduction (a result of change in useful life duration), the rolling EPS would drop to 21.0 sen & the trailing PER would rise to 8.7 times. At these multiples, Tienwah's valuation is deemed attractive.

Technical Outlook

As noted earlier, Tienwah has broken above its intermediate downtrend line, RR at RM1.70 about 2 weeks back (see Chart 2). With this breakout, Tienwah could well have found its bottom. Recovery may come if earning returned. It may have returned!


Chart 2: Tienwah's weekly chart as at Nov 11, 2015 (Source: Share Investors)

From the monthly chart below, we can see that the stock has rebounded after testing its long-term uptrend, SS.

 
Chart 3: Tienwah's monthly chart as at Nov 11, 2015 ((Source: Share Investors) 

Conclusion

Based on improved financial performance, attractive valuation & positive technical outlook, Tienwah is a good stock for long-term investment.

Note: 
In addition to the disclaimer in the preamble to my blog, I hereby confirm that I do not have any relevant interest in, or any interest in the acquisition or disposal of, Tienwah.

Wednesday, November 11, 2015

USD: The Return of Carry Trades Reversal

In the early 2000s, investors attributed market corrections to a powerful external force known as carry trade reversal. Back then, when we talked about carry trades, we were referring to JPY carry trades. That's because JPY carry trades was the only carry trades in town.

A carry trade operates on the simple idea that investors should borrow fund in a currency that has low interest rate & use the fund to invest in assets that can generate higher return. Carry trade reversal happens when either one of these 2 things happens: the funding currency appreciates or interest rate of the currency rises. Today, the idea of unconventional monetary policies is no longer a stranger to central bankers and the world is now flushed with money due to multiple quantitative easings. As a result, carry trades is no longer an exclusive Japanese export. In fact, the dominant carry trades for the past 5 years had been the USD carry trades- thanks to 3 rounds of quantitative easing by the US Fed.

If you get into a carry trade (say, USD), you would be borrowing a USD loan and then using the proceed to invest in an asset (say, Malaysian stocks). Essentially, you would be shorting USD and long Malaysian stocks. Immediately, you can see the problem; Malaysian stocks had lost ground but USD has risen substantially. The rise of USD has been advertised for sometimes now; first, the slow rollback of the amount of assets buying by US Fed and soon, the increase in interest rate (expected in early 2016). The tightening of the US monetary policies may come at a time when quantitative easing by other countries (such as EU & Japan) may be peaking.

To make matters worse, USD Index has broken above its long-term downtrend line, RR. This means that USD Index is likely to go into a long-term uptrend. Where will this uptrend reach is anyone's guess! It may test the 2002 high of 120 or it might go ballistic and revisit its 1986 high at 160!! That means it may see a rise of a painfully 20% to a whopping 60%! If either one of these comes to pass, asset value worldwide will be in for a big drop!

Thus, we can see blue chip stocks grinding lower as foreign funds are still selling. The only game in town are second & third liners stocks, where the sellers and buyers are Ali, Ah Chong & Muthu and not Peter, Paul & Mary. 

   
Chart: USD Index's monthly chart as at November 2015 (Source: Stockcharts.com)

JCY: Better earnings needed!

On November 5, I posted on JCY having a bullish breakout above its RM0.80 horizontal line. Is this breakout supported by existing financial performance?

Recent Financial Results

The latest quarterly results for JCY is for QE30/6/2015. The next quarterly results for QE30/9/2015 will only be out at the end of November.

In QE30/6/2015, JCY's net profit dropped 36% q-o-q to RM32.6 million on the back of a 6%-decline in revenue to RM480 million. Compared to the same quarter last year, net profit is up 30% while revenue is up 6%. Revenue dropped q-o-q due mainly to lower volume shipped and lower selling prices, albeit the strengthening of USD vis-à-vis MYR. Bottom-line dropped q-o-q due mainly to lower revenue and the weakening of THB vis-a-vis USD.


Table: JCY's last 8 quarterly results


Chart: JCY's last 27 quarterly results

Industry Outlook

According to an article in Kitguru, the prospect for the HDDs sector is a challenging. It opined that "(s)ales of hard disk drives have been on the decline this year because of slow demand for personal computers and tough competition from solid-state drives. While Seagate Technology and Western Digital Corp. hope that demand of HDDs will pick up in the coming quarters, a market analyst claims that it will decline again. Moreover, in the long-term, HDD makers will have to lower the price of their products because of competition." For more, go here.

Valuation

JCY (closed at RM0.88 on November 8) is now trading at a trailing PER of 11X (based on last 4 quarters' EPS of 7.9 sen). At this PER, JCY is deemed fully valued.

Technical Outlook

The breakout of the RM0.80 horizontal line can be clearly seen in both Chart 2 & 3. In Chart 3 (Weekly chart), we can see that JCY has also broken above the line, ab at RM0.85. Its immediate resistance is the horizontal line at RM0.90. Beyond that, the psychological resistance at RM1.00 should cap the rise until earnings improves. 


Chart 2: JCY's monthly chart as at Nov 8, 2015 (Source: ShareInvestor)

 
Chart 3: JCY's weekly chart as at Nov 8, 2015 (Source: ShareInvestor)

Conclusion

So far, the rally in JCY is technically driven. This upleg may gain momentum if the next quarterly results (expected in the last week of November) shows a sharp improvement in earnings.

Note: 
In addition to the disclaimer in the preamble to my blog, I hereby confirm that I do not have any relevant interest in, or any interest in the acquisition or disposal of, JCY.

Geshen: Exciting show at a stiff price

Background


Geshen was established in 1995 has businesses in the UK, US, Singapore, and Japan. Geshen is a manufacturer of high precision plastic components for the manufacturing of ICT products, electronics and electrical and automotive products.

Last year, Chan Choong Kong, an experienced fund manager acquired a 56.37%-stake in Geshen. Chan is the owner-manager of the following fund management companies:
  • Opus Asset Management , a fixed income asset management company
  • Pan Asia Capital Management Ltd, a Pan-Asian private equity
  • Sakura Management Ltd, a private equity business 
Last year, Geshen acquired a 75%-stake in Polyplas for RM33.76million. The acquisition represents a strategic investment for the Ge-Shen group as it allows it to diversify its product offering, expand its customer base, expand its market coverage, and increase its operating efficiency and achieve economies of scale. Polyplas contributed significantly to the bottom-line of Geshen in the last 2 quarters.

Recent Financial Results

From the table & chart below, we can see the sharp rise in the top-line & bottom-line of Geshen in the past 2 quarters.


Table: Geshen's last 11 quarterly P&L account


Chart 1: Geshen's last 11 quarterly P&L account

Financial Position

Geshen's financial position as at 30/9/2015 is deemed adequate, with current ratio at 1.5 times while gearing ratio is slightly elevated at 0.8 times.

Valuation

Geshen (closed at RM1.46 on November 8) is now trading at a PER of 9.2 times (based on last 4 quarters' EPS of 15.8 sen). Based on this, Geshen is deemed fully valued for a medium-cap stock. However, if the company can maintain its last 2 quarterly earnings going forward, its full-year earning can come to 25 sen. On that basis, its forward PER could be at a fairly attractive 5.8 times.

Technical Outlook

Geshen has rallied substantially from RM0.20 in early 2014 to nearly RM1.50 today. After such a long rally, the only way to get into the stock is on pullback towards the 10-week SMA line at RM1.00. However, that may not happen anytime soon.


Chart 2: Geshen's weekly chart as at Nov 8, 2015 (Source: Share Investor)


Chart 3: Geshen's monthly chart as at Nov 8, 2015 (Source: Share Investor)

Conclusion

Based on exciting prospects and good financial performance for past 2 quarters, Geshen is a stock worth tracking for long-term investment. 

Note: 
In addition to the disclaimer in the preamble to my blog, I hereby confirm that I do not have any relevant interest in, or any interest in the acquisition or disposal of, Geshen.