Monday, June 12, 2017

Magnum: Value Appears After A Hard Knock!

On May 19, Magnum announced its result for QE31/3/2017. That announcement was overshadowed by the announcement that it was penalized by the Inland Revenue for an amount of RM476.5 million. Today, The Star newspaper tried to address the question on many investors' mind: Is it time to look at Magnum?

Result Update

For QE31/3/2017, Magnum's net profit dropped 32% q-o-q or 56% y-o-y to RM30.6 million while revenue - up 10% q-o-q but down 7% y-o-y - to RM697 million.


Table 1: Magnum's last 8 quarterly results

This bottom-line does not reflected the tax penalty which would only be taken into the book in QE30/6/2017. If this has been taken into the book for QE31/3/2017, this result would be a huge loss. See the table below. 


Table 2: Magnum's results for QE31/3/2017 (as reported & adjusted)

Over the past 3-4 years, Magnum has experienced a declining profit trend. More importantly, its revenue has also been declining slowly. This is due to competition from the illegal gaming syndicates. Despite introducing new games, Magnum has not been able to stop the slide.


Graph: Magnum's last 14 quarterly results

Valuation

Magnum (closed at RM1.71 last Friday) is now trading at a PER of 16 times (based on last 4 quarters' EPS of 10.7 sen). Magnum's Price to Book is about 1.26x (based on its adjusted NTA of RM1.35 per share as at 31/3/2017 after deducting the tax penalty from net assets). Magnum has suspended its dividend for this quarter. Prior to this, its dividend payment for the preceding 4 quarters was 13 sen. If it can continue to pay this level of dividend again, the dividend yield would be 7.6%.

Hence, Magnum has dropped to a price level that makes the stock fairly attractive.

Technical Outlook

Magnum has dropped close to its long-term uptrend line, SS. The support from that uptrend line at RM1.60 should hold up the stock.


Chart 1: Magnum's monthly chart as at Jun 9, 2017 (Source: ShareInvestor.com)

It is too early to say that Magnum has hit the bottom. However, we see that some buying support has appeared at the RM1.70 mark.


Chart 2: Magnum's daily chart as at Jun 9, 2017 (Source: ShareInvestor.com)

Conclusion

Based on its lower price, Magnum is once again trading at fairly attractive valuation. This coupled with the technical support at RM1.60 level, make Magnum worthwhile stock to consider for long-term investment.

Note:
 
I hereby confirm that I do not have any direct interest in the security or securities mentioned in this post. However, I could have an indirect interest in the security or securities mentioned as some of my clients may have an interest in the acquisition or disposal of the aforementioned security or securities. As investor, you should fully research any security before making an investment decision.

Thursday, June 08, 2017

SCABLE: Here We Go Again?

Yesterday, SCABLE finally broke above the “horizontal line” at RM1.18 (see Chart 1). In the past 2 occasions when the stock had a similar upside breakout, we saw the share price rallied to the preceding high. If the current breakout can develop into a strong rally, SCABLE may repeat the feat of touching its preceding high of RM1.80 (see Chart 2).

As such, SCABLE (now trading at RM1.23) could be a good stock for a medium-term trade. If the anticipated rally does not pan out, we were not be too badly off as the stock is still trading not far from its bottom of RM1.10. The reward to risk proposition is attractive as the upside of about 60 sen while the downside is a bit over 10 sen. Good luck                       

 
 Chart 1: SCABLE's daily chart as at Jun 7, 2017 (Source: MalaysiaStock.biz)

 
Chart 2: SCABLE's weekly chart as at Jun 7, 2017 (Source: MalaysiaStock.biz)

By the way, I appended below the recent financial performance of SCABLE. It is underwhelming!

 
Graph: SCABLE's last 18 quarters' result

Note:
I hereby confirm that I do not have any direct interest in the security or securities mentioned in this post. However, I could have an indirect interest in the security or securities mentioned as some of my clients may have an interest in the acquisition or disposal of the aforementioned security or securities. As investor, you should fully research any security before making an investment decision.

Tenaga: You Have Other Plan?

Yesterday I posted  about Tenaga's strong rally on June 5. My belief was that the rally was a "window dressing" activity to prop up FBMKLCI above the recent high of 1785. Two days after the initial push-up, Tenaga is still hovering around RM14.20. There was good buying support yesterday and more importantly, the selling pressure seems to have subsided today. Such market action warrants a re-examining of the stock! 

Technical Outlook

Tenaga broke above its downward channel (RR-R"R") in March. It was not a convincing breakout as the share price slid back and leaned against the earlier downtrend line, RR for support. Eventually an upward channel was formed (SS-S"S"). Two days ago, Tenaga broke above the upper line (R"R") of this channel. Does this mean that the uptrend for Tenaga is about to accelerate?


Chart 1: Tenaga's daily chart as at Jun 7, 2017 (Source: MalaysiaStock.biz)

Tenaga is trading quite close to its recent high at RM14.50. Can Tenaga surmount enough buying support to break above the recent high?


Chart 2: Tenaga's weekly chart as at Jun 7, 2017 (Source: MalaysiaStock.biz)

Results Update

For QE28/2/2017, Tenaga's net profit was mixed- dropped 15% q-o-q but rose 12% y-o-y - to RM1.48 billion while revenue was similarly mixed- dropped 1% q-o-q but rose 6% y-o-y - to RM11.16 billion.Tenaga reported a lower operating profit of RM1,98 billion as compared to RM2,34 billion in the preceding quarter. This was due to a marginal decrease in revenue of RM79.3 million and higher operating expenses of RM255.5 million. (Tenaga's latest result was announced on April 27.)

 
Table: Tenaga's last 8 quarterly results


Graph: Tenaga's last 41 quarterly results

Valuation

Tenaga (closed at RM14.20 yesterday) is now trading at a PER of 11 times (based on last 4 quarters' EPS of 129 sen). At this PER, Tenaga is deemed fairly attractive.

Conclusion

Based on attractive valuation & positive technical outlook, I consider Tenaga to be a good stock for long-term investment. If you choose to treat my earlier post as a TRADING SELL call, you can do so provided you are nimble enough to jump back in if the stock cleared the recent high of RM14.50 (adjusted for dividend) or RM14.90 (unadjusted for dividend). Good luck!

Note:
I hereby confirm that I do not have any direct interest in the security or securities mentioned in this post. However, I could have an indirect interest in the security or securities mentioned as some of my clients may have an interest in the acquisition or disposal of the aforementioned security or securities. As investor, you should fully research any security before making an investment decision.

Wednesday, June 07, 2017

Tenaga: Thanks for the lift!

Tenaga went up 38 sen to RM14.20 yesterday, and helped to keep FBMKLCI o close at 1791. Tenaga rose on little to no news, and that is not likely to inspire follow-thru buying today.


Chart 1: Tenaga's daily chart as at jun 6, 2017 9Source: Shareinvestor.com)

If you look at yesterday trading for Tenaga and the underlying CWs, you will see that the transactions were concentrated on the stock and one of the CWs, Tenaga-C35.


Table: Tenaga & its CWs transactions on Jun 6, 2017 (Source: Kenanga BTX)

If there is no news on Tenaga today that can justify the sharp spike yesterday, Tenaga and Tenaga-C35 are likely to tumble down today. You should avoid these 2 securities.


Chart 2: Tenaga-C35's daily chart as at jun 6, 2017 (Source: Shareinvestor.com)

Tuesday, June 06, 2017

FGV: CEO & CFO given leave of absence


FGV has just announced that the Group President/Chief Executive Officer and Group Chief Financial Officer of FGV have been given leave of absence commencing from 6 June 2017 pending investigations of certain transactions under Delima Oil Products Sdn Bhd, a subsidiary of FGV. For more (not very much more), go to Bursa announcement & The Edge report. 

Despite being an important stock for political reason, FGV is such a mess that it is not hard to see the stock swooning to lower price level before local institutions will step in to stabilize the share price. Let's hope it can hold at the immediate support from the line connecting the recent lows at RM1.55. If that support fails, it may go to the November 2016 low of RM1.40.1.41. 


Chart: FGV's weekly chart as at Jun 6, 2017_12.30 (Source: Malaysiastock.biz)

Banking Stocks Rally Resumed?

If we are worried that the broad market rally may not have continued, we can take comfort that the Finance index has just broken above the wedge formation (CDEF) at 16500. This breakout means that the banking stocks rally is likely to resume.


Chart 1: Finance's daily chart as at Jun 5, 2017 (Source: Shareinvestors.com)

We can position ourselves in some of the laggards or recently beaten down banking stocks and wait for them to re-join the rally. These include AFG, RHBBANK and AMBANK. They are mostly trading near their uptrend lines as well as supported by strong horizontal lines. The reward to risk for selecting these stocks is in your favor as compared to buying into CIMB or Maybank.


Chart 2: AFG's daily chart as at Jun 5, 2017 (Source: Shareinvestors.com)


Chart 3: RHBBANK's daily chart as at Jun 5, 2017 (Source: Shareinvestors.com)


Chart 4; AMBANK's daily chart as at Jun 5, 2017 (Source: Shareinvestors.com)

Market Outlook as at June 6, 2017

Investors and punters will quickly learn humility in the stock markets. If there is one thing that stock markets can do very well is this; it can prove us wrong! Yesterday I wrote that FBMKLCI was not likely to break above the horizontal resistance at 1785. At the end of the day, that's exactly what it did! It closed at 1788 or 3 points above that resistance! If FBMKLCI can stay above the 1785 mark, it is likely to continue with its prior uptrend.


Chart 1: FBMKLCI's daily chart as at June 5, 2017 (Source: Shareinvestors.com)

As noted yesterday, FBMACE & FBMSCAP are likely to continue their recovery though I should highlight that FBMACE corrected a bit yesterday.


Chart 2: FBMACE's daily chart as at June 5, 2017 (Source: Shareinvestors.com)


Chart 3: FBMFLG's daily chart as at June 5, 2017 (Source: Shareinvestors.com)

The 2nd & 3rd liner stocks rallied yesterday, and that lifted FBM70 & FBMSCAP right up to the violated uptrend lines. Can these indices break reclaim the violated uptrend lines?


Chart 4: FBM70's daily chart as at June 5, 2017 (Source: Shareinvestors.com)


Chart 5: FBMSCAP's daily chart as at June 5, 2017 (Source: Shareinvestors.com)

For the market to continue its recovery, we like to see FBMKLCI stay above the 1785 mark and FBM70 & FBMSCAP to break above and stay above their previous uptrend lines. If these 3 indices can perform as we hope for, then the market will continue to be bullish.

Monday, June 05, 2017

Market Outlook as at June 2, 2017

FBMKLCI rebounded strongly on Friday. This raised the hope that the worst is over and recovery is on the way.

I am going to revise the trendlines that I think FBMKLCI will likely follow for the near term. Firstly, I like to move away from the 3-fan trendlines to an irregular upward channel, with upper line (RR) and lower line (SS). I have drawn the irregular upward channel (below) and you would notice that it is an expanding channel where the troughs (or, the lows) touched the lower line but the peaks (or, the highs) failed to touch the upper line after March (see the cloud formation).

This failure to reach the upper line is a warning that the market is in lofty territory & the crowd sensed it too. The players have begun to pullback whenever FBMKLCI reached 1785! Just as important, FBMKLCI broke below the lower line on the intra-day trading on Thursday. If not for last Friday, we would be in serious trouble. With FBMKLCI at 1777, we are just 8 points away from the recent highs. See the two charts below.


Chart 1: FBMKLCI daily chart as at Jun 2, 2017 (Source: Shareinvestor.com)


Chart 2: FBMKLCI 4-hour intra-day chart as at Jun 2, 2017 (Source: Shareinvestor.com)

The correction over the past 2 weeks have been very painful for fledgling stocks and stocks in the ACE Market. The good news is that both indices have found support at the intermediate uptrend lines and rebounded. There is hope that the intermediate uptrend lines will hold up these stocks at least for a while. See the next two charts.


Chart 3: FBMACE daily chart as at Jun 2, 2017 (Source: Shareinvestor.com)


Chart 4: FBMFLG daily chart as at Jun 2, 2017 (Source: Shareinvestor.com)

However the second liners and third liners are not in such a good position. Both FBM70 & FBMSCAP had broken below their intermediate uptrend lines. This means these stocks may have more room to decline.


Chart 5: FBM70daily chart as at Jun 2, 2017 (Source: Shareinvestor.com)


Chart 6: FBMSCAP daily chart as at Jun 2, 2017 (Source: Shareinvestor.com)

This week, the market will be very volatile with the possible exception of ACE Market and fledgling stocks which may continue their recovery. Blue chip stocks may start off well but have limited upside. The middle market may attempt to rally on the coattail of a blue chips rally but that rally may flatter as prices approach the violated uptrend lines. For those who were gutsy enough to buy last week, the urge to take some chips off the table will be more irresistible than ever. Good luck!

Sunday, June 04, 2017

Hevea: Earning Remained Healthy

Results Update

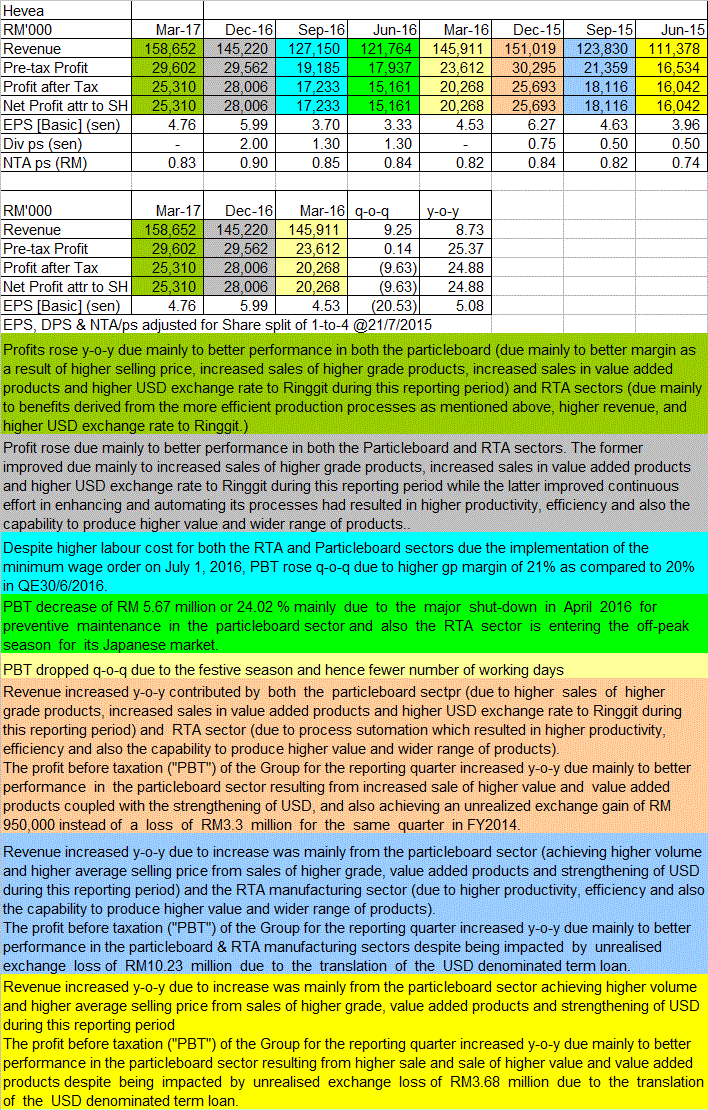
For QE31/3/2017, Hevea's net profit was mixed - down 10% q-o-q or up 25% y-o-y - to RM25 million while revenue rose 9% q-o-q and % y-o-y to RM1519million. Profits rose y-o-y due mainly to better performance in both the particleboard (due mainly to better margin brought on by higher selling price, increased sales of higher grade products, increased sales in value added products and higher USD exchange rate to Ringgit during this reporting period) and RTA sectors (due mainly to benefits derived from the more efficient production processes, higher revenue, and higher USD exchange rate to Ringgit.) [The result for QE31/3/2017 was announced on May 23.]


Table: Hevea's last 8 quarterly results


Graph: Hevea's last 38 quarterly results

Valuation


Hevea (closed at RM1.37 last friday) is now trading at a PE of 7.6 times (based on last 4 quarters' EPS of 17.8 sen. At this PER, Hevea is still deemed very attractive. In addition, Hevea pays a decent dividend, with yield of 3.4%.

Technical Outlook

Hevea is in a steep uptrend line, SS with support at RM1.35 (see Chart 1). the immediate support is at the line connecting the recent trough at RM1.25-1.30 (see Chart 2).


Chart 1: Hevea's monthly chart as at Jun 2, 2017  (Source: ShareInvestor)


 Chart 2: Hevea's weekly chart as at Jun 2, 2017  (Source: ShareInvestor)

Conclusion

Based on good financial performance, relatively attractive valuation & positive technical outlook, Hevea remains a good stock for long-term investment.

Note:
I hereby confirm that I do not have any direct interest in the security or securities mentioned in this post. However, I could have an indirect interest in the security or securities mentioned as some of my clients may have an interest in the acquisition or disposal of the aforementioned security or securities. As investor, you should fully research any security before making an investment decision.

Notion: Earning Dropped

Results Update

For QE31/3/2017, Notion's net profit dropped 31% q-o-q but rose 41% y-o-y to RM4.4 million while revenue rose 1% q-o-q or 21% y-o-y to RM68 million. Total revenue was flat in the current quarter under review compared to the preceding quarter. Nevertheless, Auto sector registered an increase of 9%, HDD is flat while Engineered Products is 12% negative due mainly to 34% down for Camera whereas Other Engineered Products recorded an increase of 36%. Profit after taxation was RM 4.44 million compared to RM 6.44 million in Q1FY2017 mainly due to unrealized foreign exchange losses. (Notion's latest result was announced on May 23.)

 
Table: Notion's last 8 quarterly results


Graph: Notion's last 40 quarterly results

Valuation

Notion (closed at RM1.21 last Friday) is now trading at a PER of 33 times (based on last 4 quarters' EPS of 3.7 sen). At this PER, Notion is deemed overvalued.

Technical Outlook

Notion rallied after it broke above its long-term downtrend line, RR in November 2016 at RM0.40 (see Chart 1). Right now, Notion is trapped in a flag formation, ABCD (see Chart 2). An upside breakout above RM1.38 or a downside breakout below RM1.18 would point the way forward for the stock.


Chart 1: Notion's monthly chart as at Jun 2, 2017 (Source: ShareInvestor.com)


Chart 2: Notion's daily chart as at Jun 2, 2017 (Source: ShareInvestor.com)

Conclusion

Based on weaker financial performance & demanding valuation, Notion is a stock to be avoided.

Note:
I hereby confirm that I do not have any direct interest in the security or securities mentioned in this post. However, I could have an indirect interest in the security or securities mentioned as some of my clients may have an interest in the acquisition or disposal of the aforementioned security or securities. As investor, you should fully research any security before making an investment decision.

AMWAY: Earning Still Weak

Results Update

For QE31/3/2017, Amway's net profit dropped 18% q-o-q or 48% y-o-y to RM9.5 million while revenue dropped 6% q-o-q or 22% y-o-y to RM237 million. Revenue decreased by 5.5% q-o-q due to further consolidation following the conclusion of ABOs’ Performance Year 2016, which was driven by strong ABO momentum towards the 40th anniversary programs. Profit before tax decreased by 8.8% q-o-q mainly due to lower sales and higher import costs. These were partly offset by lower provisions for sales incentives and ABO incentive trips, as well as reduced operating expenses. (Amway's latest result was announced May 17.)


Table: Amway's last 8 quarterly results


Graph: Amway's last 39 quarterly results

A significant portion of Amway's products and/or inputs are sensitive to the movement of USD-MYR. Since the movement has been unfavorable for the past 2 years, this has affected Amway's revenue & profits. From the chart below, we can see that USD-MYR is at a crossroad. Any further weakness in USD could cause the uptrend of USD-MYR to reverse and that will bring about a favorable change in the pricing of its products, leading to improved sales & profitability. 


Chart 1: USD-MYR's weekly chart as at June 2, 2017 (Source: Investing.com) 

Valuation

Amway (closed at RM7.60 last Friday) is trading at a trailing PER of 27 times (based on last 4 quarters' EPS of 28 sen). While PER appears elevated, this may change with better performance if USD-MYR reverses. Meanwhile, investors may take comfort in receiving a decent dividend yield of 3.9%.

Technical Outlook


Amwayhas tested its long-term uptrend line at RM7.50. Further price run-up could trigger the MACD to hook-up. This may be the positive signal that shareholders are waiting for.


Chart 2: Amway's monthly chart as at June 2, 2016 (Source: ShareInvestor.com)

Good entry to this stock is at RM7.30-7.50. An upside breakout of the horizontal resistance at RM8.20 could signal the next upleg for the stock.


Chart 3: Amway's daily chart as at June 2, 2016 (Source: ShareInvestor.com)

Conclusion

Despite the weaker financial performance and demanding valuation, Amway could be a good stock to consider for recovery play. For reason stated above, I revised my rating from REDUCE to ACCUMULATE.

Note:
I hereby confirm that I do not have any direct interest in the security or securities mentioned in this post. However, I could have an indirect interest in the security or securities mentioned as some of my clients may have an interest in the acquisition or disposal of the aforementioned security or securities. As investor, you should fully research any security before making an investment decision.

Yeelee: Earnings Plummeted

Result Update

For QE1/3/2017, YeeLee's net profit dropped by 48% q-o-q or 47% y-o-y to RM6.2 million while revenue was mixed - down 8% q-o-q but up 6% y-o-y - to RM268 million. Revenue dropped q-o-q due to lower sales of beverages, Campbell's products and palm-based products. This led to a drop in profits. (The result was announced on May 31.)


Table: YeeLee's last 8 quarterly results


Graph: YeeLee's last 44 quarterly results

Valuation

YeeLee (closed at RM2.49 last friday) is now trading at a PE of 11.9 times (based on last 4 quarters' EPS of 20.93 sen). At this PER, YeeLee is deemed quite attractive for a well-diversified group with large exposure to consumer spending.

Technical Outlook

YeeLee is in a long-term uptrend which is well-supported by either its 10-month SMA line at RM2.50 or its 20 or 30-month EMA lines at RM2.20-2.30.


Chart 1: YeeLee's monthly chart as at Jun 2, 2017 (Source: Chartnexus)

Yeelee has a strong support from its horizontal line at RM2.43.


Chart 2: YeeLee's weekly chart as at Jun 2, 2017 (Source: Chartnexus)

Conclusion
Despite the weaker financial performance, YeeLee is a good stock to hold for long-term investment based on attractive valuation & positive technical outlook.

Note:
I hereby confirm that I do not have any direct interest in the security or securities mentioned in this post. However, I could have an indirect interest in the security or securities mentioned as some of my clients may have an interest in the acquisition or disposal of the aforementioned security or securities. As investor, you should fully research any security before making an investment decision.

Panamy: Earnings Dropped

Results Update

For QE31/3/2017, Panamy's net profit dropped by 14% q-o-q or 26% y-o-y to RM27 million while revenue dropped by 13% q-o-q or 1% y-o-y to RM247 million. Revenue dropped q-o-q due to slower demand for Home Appliances products for both domestic and export market. The slowdown in market demand was mainly due to volatility of Middle East region, shortfall from Thailand sales and stiffer competition. PBT decreased by 33.6% or RM13.4 million as compared to combined profit before tax of RM39.7 million in the preceding quarter. (Panamy's latest result was announced on May 30.)


Table: Panamy's last 8 quarterly results


Graph: Panamy's last 48 quarterly results

Valuation

Panamy (at RM35.04 last Friday) is trading at a PE of 16.8 times (based on last 4 quarters' EPS of 209 sen). Notwithstanding a drop in dividend, Panamy still pays a decent DY of 3.3%.

Technical Outlook

Panamy is a long-term upward channel, with support at RM26.00.


Chart 1: Panamy's monthly chart as at Jun 2, 2017 (Source: ShareInvestor)

Panamy is now hanging onto the horizontal line at RM35.00.


Chart 2: Panamy's daily chart as at Jun 2, 2017 (Source: ShareInvestor) 

Conclusion

Despite the weaker financial performance, Panamy is still a good stock for long-term investment based on attractive valuation and positive technical outlook.

Note:
I hereby confirm that I do not have any direct interest in the security or securities mentioned in this post. However, I could have an indirect interest in the security or securities mentioned as some of my clients may have an interest in the acquisition or disposal of the aforementioned security or securities. As investor, you should fully research any security before making an investment decision.