VIX is used by some analysts as a contrarian indicator, whereby a very high reading could be a sign that the market is deeply oversold & is due to move sharply to the opposite direction. From Chart 1 below, we can see whenever VIX hit a high of 35 point or more (preferably 37 & above), the DJIA had already made a low & thereafter, DJIA would rebound back. See the extreme readings marked as 'A, B, C & D'.

Chart 1: DJIA & VIX weekly chart as at September 17, 2008 (Source: Stockcharts.com)
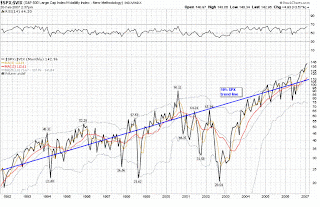
We are talking about the short to medium-term outlook, in the foregoing paragraph. The long-term picture, as painted by my yesterday's post, remained unchanged. For long-term analysis, one may use the S&P500:VIX ratio. According to VIX & More, the S&P500:VIX ratio tends to be mean-reverting around the long-term trend line (i.e. a 10% trend line). From Chart 2 below, we can see that the path back to the mean can be a long and difficult one. For more on S&P500:VIX, check out these 2 posts in VIX & More (here & here).

Chart 2: S&P500:VIX monthly chart from 1992 to 2007 (Source: VIX & More)
My personal observation is that the market may have hit a bottom when S&P500:VIX hit a low of 21 or below. This had happened in 1994 & 1998 (which were the lows achieved within a bull market) as well as in 2002 (a low recorded during a bear market). I have appended a weekly chart of S&P500:VIX with the ratio presently above 30 (i.e. the reading has yet to reach a low of 21 or below). I must admit that I am still fine-tuning the parameters for my weekly chart of S&P500:VIX (Note: VIX & More uses monthly chart), as I am using the free service of Stockcharts.com where I have access to weekly data only. Nevertheless, I believe that the chart is adequate for the purpose of getting a reading of the ratio of S&P500:VIX.

Chart 2: S&P500:VIX's weekly chart as at September 17, 2008 (Source: Stockcharts.com)
In conclusion, I believe there is a good chance that the US stock markets may rebound in the near future. This rebound may only be a short-term rebound, while the long-term outlook remained bearish. For those with big position in the market, you may wait for this rebound to trim your position (instead of selling at the current depressed prices). For those buying for the long-term investing, this level is a good entry to accumulate some stocks since we can never be sure where the bottom is. Good luck!
No comments:
Post a Comment