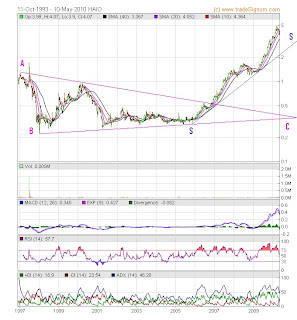
Chart 1: Haio's daily chart as at May 10, 2010 (Source: Tradesignum)
From the weekly chart (Chart 2), we can see that Haio's fantastic rise occurred after it has broken above its triangle ('ABC') at RM0.50 at the end of 2006. A long-term uptrend line ('SS') can be drawn, but a better guide would be the 20-week SMA line (which is equivalent to the 100-day SMA line). The 20-week SMA line provide support at RM4.05. The indicators reading is mildly negative, with bearish MACD cross-under; still positive RSI reading of 58; and potentially negative reading on ADX as the rising -ve DMI crossed the declining +ve DMI.

Chart 2: Haio's weekly chart as at May 10, 2010 (Source: Tradesignum)
For a more comprehensive look at Haio, go here.
6 comments:
impress. .
where you learn all this technique analysis?
hi alex. please comment on TWSCORP. chart look like to breakout soon, is it true ??
Hi wong,
TWSCORP is testing its downtrend line at RM0.64-65. It is on the verge of a breakout.
hi alex. if TWSCORP break the downtrend line at 65sen, what is it target price ?
Hi Ivan,
Thanks you.
I learn technical analysis from the usual names- Murphy, Magee, etc. The other 'teacher' is experience. If you look at 40-50 charts a day over 10-15 years, you can be learn a lot.
Hi wong,
If TWSCORP break above the downtrend line at 65sen, it would encounter resistance at RM0.70, RM0.75 & RM0.78-80.
Post a Comment