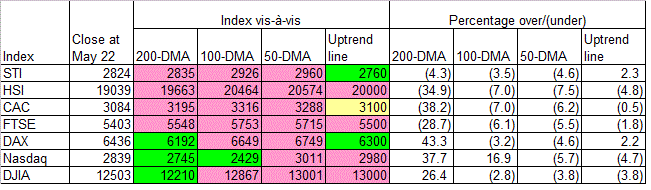
The US markets (as represented by DJIA & Nasdaq) are below the accelerated uptrend line (SS) but are still above their 200-day SMA line. These markets are among the strongest equity markets as they were able to surpass the high recorded in May-August 2011. I have drawn alternative uptrend line (S1-S1) and both indices are very near the alternative uptrend lines. Can they stay above this alternative uptrend line? We will wait & see.

Chart 1: DJIA's daily chart as at May 22, 2012 (Source: Stockcharts)

Chart 2: Nasdaq's daily chart as at May 22, 2012 (Source: Stockcharts)
The European markets have weathered the fallout from the Eurozone sovereign debt quite well. Then again, the true test- GREXIT- is still around the corner. DAX is still above its 200-day SMA line as well as rebounded above its intermediate uptrend line after a brief violation last week. CAC & FTSE are both below their 200-day SMA line & intermediate uptrend line (SS). I have drawn alternative uptrend line for CAC & FTSE (S-S1 or S1-S1) and both indices are above the alternative uptrend line.

Chart 3: DAX's daily chart as at May 22, 2012 (Source: Stockcharts)

Chart 4: CAC's daily chart as at May 22, 2012 (Source: Stockcharts)

Chart 5; FTSE's daily chart as at May 22, 2012 (Source: Stockcharts)
HSI and STI are below their 200-day SMA line. HSI is also below its intermediate uptrend line while STI tested its intermediate uptrend line & recovered.

Chart 6; HSI's daily chart as at May 22, 2012 (Source: Stockcharts)

Chart 7: STI's daily chart as at May 22, 2012 (Source: Stockcharts)
Based on the above, we can see that the developed equity markets are at critical level. Any further weakness could bring forward further selldown & possibly a Test of the (September) Low. We can only hope that the uptrend line would not be violated (which doesn't look very promising) or the Test of the Low would yield a positive outcome.
No comments:
Post a Comment