The CI has not only tested the 980 level, it has in fact broken above that level. With this breakout, the wedge would become a continuation pattern for the CI's prior trend, which is a gradual uptrend that started in March 2001. On the other hand, if the CI had broken below the lower boundary of the wedge, the wedge would become a reversal pattern.
This breakout must hold up for a reasonable duration of 3 to 5 days and it must be accompanied with a large volume (which was present for the past 2 days). See Chart 1 below.

Chart 1: CI's weekly chart as at Oct 13
From the monthly chart [Chart 2], we can see that the MACD has done a positive crossover, albeit a very marginal one, which must be confirmed by month-end closing. This MACD crossover is a fairly infrequent positive event (read: BUY signal). In the past 8 or 9 years, there have been 3 positive crossovers [denoted in Chart 2 as A1, A2 & A3].
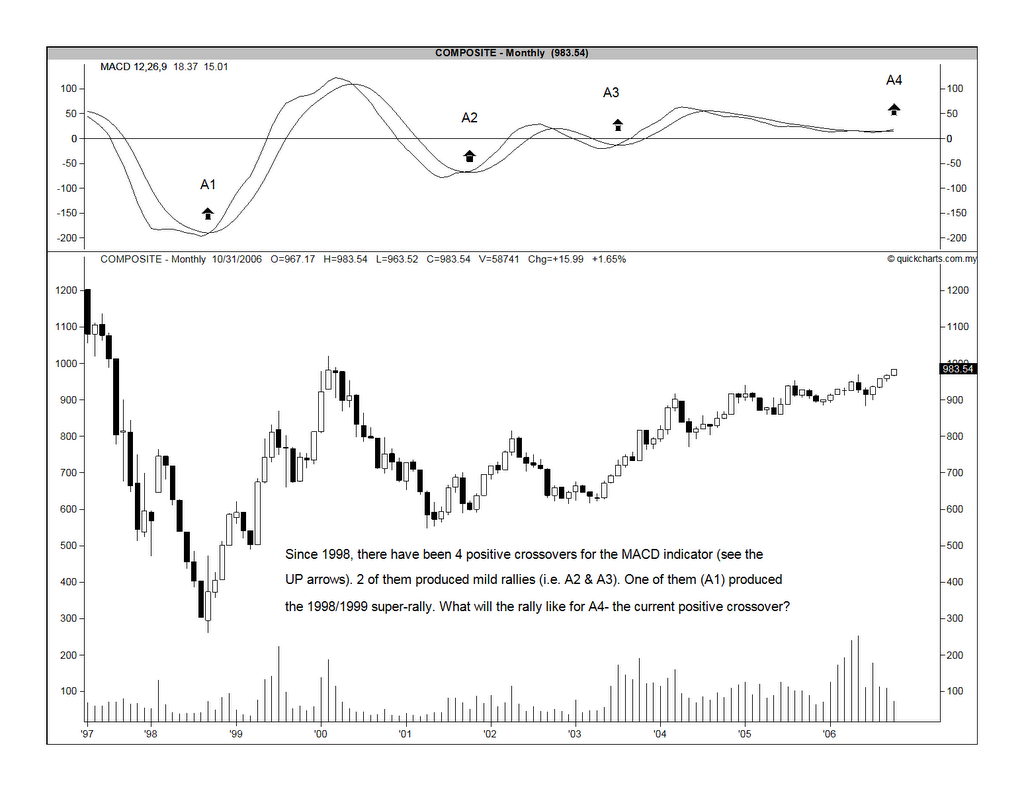
Chart 2: CI's monthly chart as at Oct 13
Of the past 3 MACD positive crossovers, A1 can qualify as a super-rally while the other two [A2 & A3] were mild rallies [see Chart 3 below].
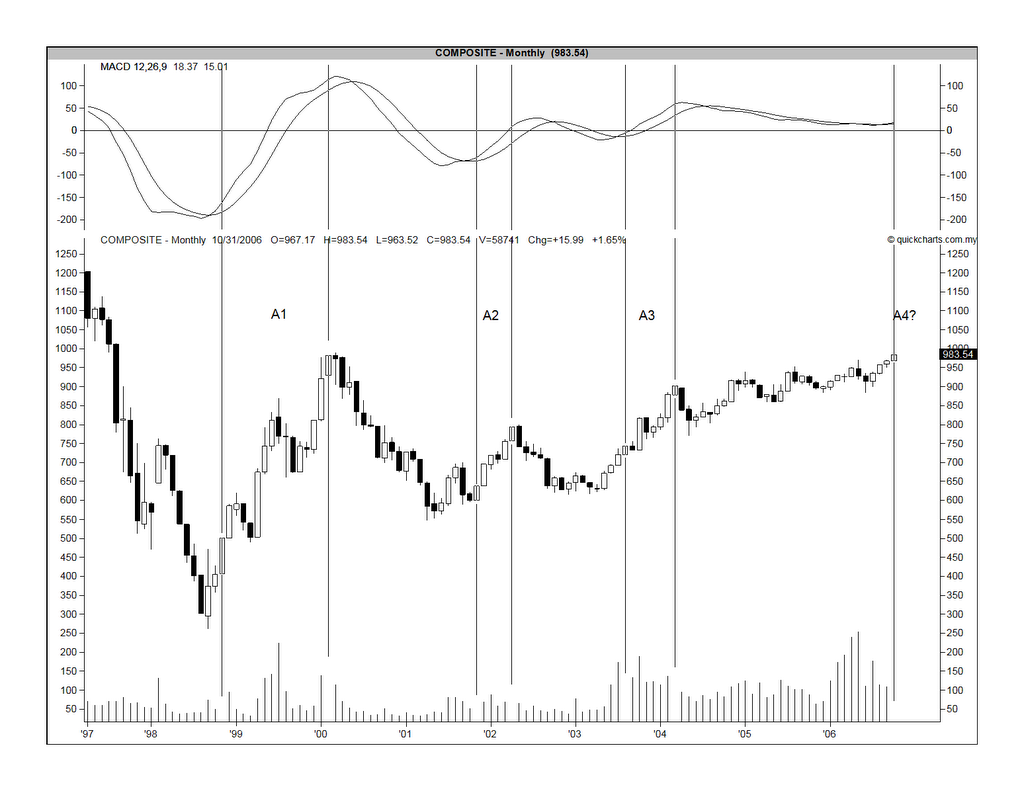
Chart 3: CI's monthly chart as at Oct 13 [overlaid with vertical lines]
I have tabulated the gain made in each of the past 3 rallies from the closing index in the month where the MACD confirmation was at hand to the peak index below. We can see that a mild rally can easily lead to a gain of 20-30% while a super rally could lead to a doubling of the index (I have serious doubt about this one).
Assuming that we have a real or genuine breakout (subject to confirmation by end of this month) and the CI is at, say 985; a mild rally lasting 5-7 months could put the CI to 1182 level. I dare not extrapolate where the CI would be if we have a super rally instead.
Important note: This is just a projection, which may or may not happen. There are a number of assumptions made which may not pan out in the manner that I've written here.
No comments:
Post a Comment