Normally, the price of the securities tend to recover, after the market has fully digested the unexpected event & its financial impact. However, in some cases where the event is a continuing event (eg. Transmile's fraudulent book-keeping or the US subprime & credit crunch problem), the market will revisit the problem & the selling will continue unabated.
The unexpected event is of course the shocking results of our recent General Election. Has the market absorbed the full impact of this event? I think what the market did immediately after the results was to price in a higher political risk factor. This price-finding process, which was done in a hectic fashion, could have substantially factored in the new political reality in Malaysia. Unless there is political problems over the next few weeks or months, I believe that yesterday's low of 1157 will be the internal low & one may slowly accumulate some quality stocks that had been beaten down.
From the daily chart, we can see that the immediate support is at 1140 level, while the immediate resistance will be the level where the market gapped lower yesterday, i.e. 1280.

Chart 1: KLCI's daily chart as at March 10, 2008 (courtesy of Quickcharts)
The weekly chart shows that the KLCI has broken below its uptrend line that commenced from June 2006. Unless the KLCI can recover above the uptrend line (at 1270 level), the technical outlook for the market will be bearish and we should reduce our exposure to equity.

Chart 2: KLCI's weekly chart as at March 10, 2008 (courtesy of Quickcharts)
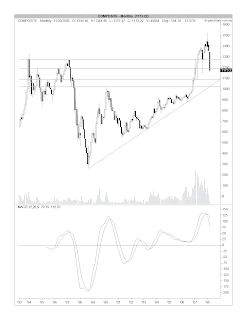
In the event that the market continue to trend lower, we can see that KLCI should find support at the immediate horizontal support of 1090 and the next horizontal support of 1020. Longer term uptrend line support is at 1030 level. Hopefully, we will not have to see the KLCI testing these levels anytime soon.

Chart 3: KLCI's monthly chart as at March 10, 2008 (courtesy of Quickcharts)
No comments:
Post a Comment