Let's look at the charts of MSCI EAFE & MSCI World indexes (Chart 1 & 2). The MSCI EAFE Index is a stock market index that is designed to measure the equity market performance of developed markets (Europe, Australasia, Far East), excluding the US & Canada. The MSCI World Index is a stock market index of 1500 'world' stocks and it is often used as a common benchmark for 'world' or 'global' stock funds.
We can see that the 50-day Exponential Moving Average ('EMA') has crossed below the 100-day & 200-day Simple Moving Average ('SMA'). This is denoted as 'X' on Chart 1 & 2 below. We can see that a similar cross-under happened in early 2008 but the market managed to rebound back in April & May 2008 before the sharp selldown kicked in one month later, in June. The whole chain of events in 2008 is denoted as 'Y'. In the current cross-under, some are hopeful that a rebound would come shortly before a selldown set in. While many things can happen over the next few weeks or months, it's better & safer to accept that the current cross-under has signaled the end of the bull market & possibly the beginning of the bear market.

Chart 1: MSWorld's daily chart as at June 9, 2010 (Source: Stockcharts)

Chart 2: MSEAFE's daily chart as at June 9, 2010 (Source: Stockcharts)
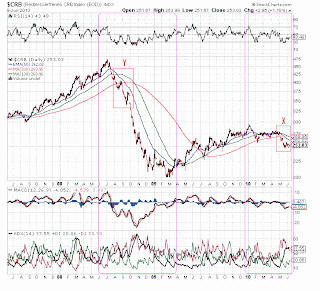
The other charts that may provide some guidance to the state of the market or economy is the CRB & WTIC indexes. From Chart 3 & 4 below, we can see that the 50-day Exponential Moving Average ('EMA') has crossed below the 100-day & 200-day Simple Moving Average ('SMA'). This is denoted as 'X' on the chart. The last time we saw a similar cross-under was in August/September 2008 [denoted as 'Y'].

Chart 3: CRB's daily chart as at June 9, 2010 (Source: Stockcharts)

Chart 4: WTIC's daily chart as at June 9, 2010 (Source: Stockcharts)
Another way of interpreting the above technical signal is that market players across different asset classes are anticipating the current European problems to turn ugly in the same manner that the sub-prime crisis did in September 2008. Will it happen? We will have to wait & see.
17 comments:
Good article to describe the current market ?
http://www.informedtrades.com/510425-traps-shakeouts.html
Dear Alex
Would you mind comment on AZRB. This stock bashed down recently to as low as 76sen, but have regain back to 80sen level today. AZRB currently trade cum dividend of 3.5sen
Hi, you said you have been reading Edwards and McGee, Technical Analysis of Stock Market Trends lately. In Chapter 3, it's noted that the better stocks are the last to be sold off and the first to recover. The 2nd & 3rd liners would jump in the late stage of a bull market & the first to drop at the start of a bear market.
VERY NICE. I'll put into my blog one day.
Thanks
Hi Alex...
What do u think about AIM..is it good to buy it?...hope u can guide me...
thanks
bro . ..
w'cup period...u not much time update u blog?
i follow u blog daily basic . . .at laest come in 2 times/ day..feel no thing read . .a bit xian :D
Hi Alex, could you revisit JCY which you had posted on earlier? It is only RM 1.50 now, despite good 2nd quarter results. What is your opinion on this stock now? Thanks!
Hi cheer,
Thanks for the link. It is very enlightening. Once again...
http://www.informedtrades.com/510425-traps-shakeouts.html
Hi hng,
At RM0.785, AZRB looks reasonably priced, trading at PER of 7-10. Its FY2009 EPS was 7.5 sen while its 1Q2010 EPS was 2.8 sen (giving an annualized FY2010 EPS of 11.2 sen).
It had tested the horizontal support of RM0.75 in late May and rebounded. However, its prevailing trend is down since it made a high of RM1.06 in August last year. That trend may change if it can break above the horizontal resistance at RM0.85.
Hi Polite Market,
Thanks.
Hi BENDAHARA TUN PERAK,
AIM is a marginal company which incurred losses of RM1-3 million on turnover of RM46 million in the past 2 years. For 1Q2010, it made a minuscule net profit of RM80k on turnover of RM8 million. Despite the unexciting prospect, AIM is a financially stable company with NTA of 18 sen per share [of which, cash backing is about 10 sen].
Chartwise, AIM broke above its medium-term downtrend line at 12 sen in January this year. It made a high of 43.5 sen in April & plunged to a low of 13 sen in late May. AIM's immediate horizontal support is at 13-14 sen.
I think it is relatively safe to buy at 13-14 sen, but I wouldn't know whether there will be another play for this stock.
Hi Ivan,
Like many, I'm excited about the World Cup. However, I will watch matches if the timing is convenient. No late nights for this early owl. For this World Cup, I hope my favorite team, Germany can equal Italy's record of 4 World Cup titles. So far, so good!
Hi AlexP,
For QE31/3/2010, JCY reported a EPS of 3.2 sen- giving it an annualized EPS of 12.88 sen for FY2010. At RM1.50, JCY is now trading at a PER of 11.6 times.
Chartwise, JCY's immediate horizontal support at RM1.45-1.50.
Based on reasonable valuation & good technical support, JCY could be a BUY.
Hi Alex..thanks a lot for your guide about AIM...What about EFFICEN (EFFICIENT E-SOLUTIONS BHD)?...
What prospect of this company as OSK put it into 50 jewel company?
thanks..
HI Alex ,
Can I have the comment for Latexx share ? what is the entry point ?
Hi Alex,
Can you please tell me what happen to Keuro?
Post a Comment