Friday, October 22, 2010

Exxon may have a bullish breakout

When I was reading up on BP's Deepwater Horizon oil spill in April-July, I was struck by the downtrend in a rival company, Exxon Mobil Corporation (NYSE: XOM). Since then, I have been keeping an eye on its chart. I noticed that Exxon may have just broken above its downtrend line at USD66 yesterday. Exxon trades at a PE of 12.8 times. For a summary of Exxon, go here.


Chart: Exxon's weekly chart as at Oct 16, 2010 (Source: Yahoo Finance)

Based on the technical breakout, Exxon could be a trading BUY.

Steel sector is stirring up

Steel prices continued to rise in Asia. See The Composite Carbon Steel price chart for Asia & Worldwide below.


Chart 1: All Carbon Steel Products Composite Price & Index charts (June 2006 to Sept 2010) from MEPS (INTERNATIONAL) LTD

The rise in steel prices reflect the increased demand & higher cost of iron ore. Over the past 2 weeks, we can see the share price of our local steel producers is slowly moving up again. My preferred stocks for this sector are AnnJoo & KinSteel. Both stocks have broken above their downtrend line.


Chart 2: AnnJoo's weekly chart as at Oct 22, 2010_11.00am (Source: Quickcharts)


Chart 3: Kinsteel's weekly chart as at Oct 22, 2010_11.00am (Source: Quickcharts)

Based on the improved fundamental & technical breakout, steel stocks could be good trading BUY.

Thursday, October 21, 2010

KBunai poised for correction

From the 60-minute chart below, KBunai looks poised for correction. Look at the divergence between the volume & price movement as well as cross-under of the MACD indicator.


Chart: KBunai's 60-min chart as at Oct 20, 2010 (Source: Quickcharts)

The gift that keeps giving! First, Pemandu at the Economic Transformation Plan (ETP) open day on September 22 announced that an integrated resort (IR) - including a mangrove centre, water theme park and waterfront properties- will be developed on a 500-acre “eco-nature” resort in Karambunai, Sabah. This IR may come with the option to build a casino to ensure a higher return on investment (ROI). Later, Karambunai denied that the IR would include the development of any casino (here).

At the Budget announcement on October 15, it seems that the government would be developing this resorts at a cost of RM3 billion. Now, it is made clear that it’s a public-private partnership with the government contributing RM100 million to the total development cost of RM3 billion (here).

Like the saying goes, “If wishes were horses, then beggars would ride on them.” My concerns are as follows:

· Would the project be any more successful than MK Land’s Bukit Merah resort?

· Should the RM100 million be spent to build up an area which can cater for more than one resort? Taman Negara could be a good model to follow. Imagine a similar RM100 million allocation for Mutiara Taman Negara as compared to funding the development of the infra-structure around Taman Negara.

· Would a RM3 billion “eco-nature” resort be so massive that you can’t see any more “eco-nature” in the resort?

All in all, I am not sold on the idea of Karambunai as a stock nor Karambunai as “eco-nature” resort, with or without a RM100 million contribution from the government.

Wednesday, October 20, 2010

Rubber glove sector- to buy or not to buy?

The current rebound amongst rubber glove stocks is quite strong. After a sharp drop in price, this rebound makes these stocks really hard to ignore. I have chosen four charts to analyze this sector.

From Chart 1 & 2 below, we can see that Topglov & Kossan are trend-following stocks, giving idealized charts for easy technical analysis. The best way to establish the trend of these stocks is by plotting the 10, 20 & 40- week SMA lines (equivalent to the 50, 100 & 200-day SMA lines). Once the 10 & 20-week SMA lines have cut below the 40-week SMA line (or, the death cross sighted), the stocks would enter into a bearish phase. When the reverse happened [the 10 & 20-week SMA lines have cut above the 40-week SMA line (or, the golden cross sighted)], the stocks would enter into a bullish phase.

Topglov & Kossan have witnessed the death cross 2 or 3 weeks ago. The last time Topglov has experienced the same technical event was in July 2007 while Kossan had its death cross in October 2007. Both stocks then entered into a downtrend until the golden cross appeared in March 2009- signaling the bull rally for these stocks for the past 15 months.


Chart 1: Topglov's weekly chart as at Oct 20, 2010_11.00am (Source: Quickcharts)


Chart 2: Kossan's weekly chart as at Oct 20, 2010_11.00am (Source: Quickcharts)

I have also appended below the charts of Harta & Supermx who show promise of a recovery. In Chart 3, we can see that Supermx has recovered so much ground that its 10-week SMA line is poised to curve above the 40-week SMA line.


Chart 3: Supermx's weekly chart as at Oct 20, 2010_3.30pm (Source: Quickcharts)

In the case of Harta, we can see that the share price has recently revisited its recent high at RM5.60-5.66. While it failed to break above the recent high (and may set the stage for a potential bearish triple top reversal), the fact that it managed to re-test the recent high is very commendable. You may notice that the 10-week SMA line has curved above the 40-week SMA line.


Chart 4: Harta's weekly chart as at Oct 20, 2010_11.00am (Source: Quickcharts)

What could have triggered the strong rebound in rubber glove stocks? Everything, that can go wrong for this sector, has gone wrong. They are:
1. a normalizing demand (& a looming excess production capacity situation);
2. a sharp rise in the prices of rubber latex (see Chart 5) and the cost of other raw material; and
3. an unfavorable movement in the forex rates (albeit a potential short-term relief).


(Note: TSR 20 index as proxy for rubber latex price)
Chart 5: TSR 20 index & CRB's weekly chart as at Oct 19, 2010 (Source:
Rubbernet)

Based on fundamental reasons, I am still very skeptical on the near term outlook for rubber glove stocks. However the strong rebound in the share price seems to suggest things are on the mend. We would have a much clearer picture in a few weeks' time, which would come from either more positive technical readings or the release of the financial results for QE30/9/2010 for Supermx, Harta & Kossan (expected in 2nd week of November).

USD rebounding at last


USD index tested the uptrend line at the 76 mark & rebounded yesterday. This rebound could carry the index to its 50-day SMA line at 80.66 (denoted as 'A'), which would be comparable to the rebound of June-July 2009 (denoted as 'A"'). After this potential rebound, I believe the USD would continue to drift lower as a death cross has been sighted (with its 50-day SMA line crossed below its 200-day SMA line). The entire downtrend for USD might last for many months (denoted as 'X') which is comparable to the preceding downtrend from March to December 2009 (denoted as 'X"').


Chart 1: USD's daily chart as at October 19, 2010 (Source: Stockcharts.com)

The weakness in the USD has been a boon to many risk assets, such as emerging markets equities & commodities. A new round of Quantitative Easing (known as QE2) by the US Fed has been openly discussed that it may have achieved half its objectives even before it was rolled out. Whatever the impact of QE2, investors have voted by moving their funds into other assets- especially gold. In time of crisis or period of hyper-inflation, people can only count in one currency that can retain its value. That's safe haven currency is gold.


Chart 2: Gold's daily chart as at October 19, 2010 (Source: Stockcharts.com)

Today, as we celebrate our success in investing in equities & properties, let's not forget that this success is due partly to the sharp drop in the value of our currencies- be it RM or USD. Below I have appended the charts of crude oil, CRB, S&P500 and SSEC as priced in gold. Notice how CRB, S&P500 and SSEC are revisiting its crisis low!


Chart 3: WTIC:GOLD & CRB:GOLD's daily chart as at October 19, 2010 (Source: Stockcharts.com)


Chart 4: S&P500:GOLD & SSEC:GOLD's daily chart as at October 19, 2010 (Source: Stockcharts.com)

The continuous, aggressive creation of more money & credit may one day save us from the next Great Depression but at what cost. Every central banker in the developed countries is working overtime to unleash some inflation in order to beat off the specter of deflation. After all, no one wants a Japanese lost decade. If we are not careful, we may get something equally bad- a German Hyperinflation. These are dangerous times, indeed!

Friday, October 15, 2010

Market Outlook as at October 15, 2010


FBM-KLCI has risen steadily from its low of 1250 at the end of May to touch an intra-day high of 1503 yesterday. The powerful liquidity-driven rally is experiencing some profit-taking today. From the chart below, we can see bearish divergence in some indicators which signaled underlying weakness in the market.

The current correction may bring the index down to the horizontal line 1480, which was September high. In addition, I drew the immediate uptrend line ('SS') which connects the troughs since May. Two 'parallel' lines were also drawn- one marking the upper boundary while the second line delineating the mid-point. This second line should also provide some support to the index at 1480 level in the current correction. All in all, I believe the developing correction to be healthy & the 1480 level should be a good entry level to the market.


Chart: FBM-KLCI's dail chart as at Oct 15, 2010_10.30am (Source: Quickcharts)

Thursday, October 14, 2010

MMC- not favored to acquire PLUS

PLUS is suspended today. Is the suspension done to facilitate the announcement of the much-anticipated sell-off by PLUS's major shareholder, UEM Group of its stake in PLUS?

One of the parties which had submitted a proposal to takeover PLUS is MMC. When the market got wind of the proposal, it chased the share to a high of RM3.38 on October 4. Today, MMC share price is positive but very subdued. There are growing concern that MMC or its main shareholder, Syed Mokhtar is controlling too many strategic assets due to his close connection with the ruling party, UMNO (go here). The subdued rally in MMC share price is a sign that the company is not favored to acquire PLUS.


Chart: MMC's 15-minute chart as at Oct 14, 2010_12.20pm (Source: Quickcharts)

Wednesday, October 13, 2010

Shanghai's SSEC index may have a bullish breakout


As at 3.01am EDT,SSEC was trading at 2861.36 (a gain of 19.95 points or 0.70%). SSEC rallied after it re-opened on October 8 following a 5-day holiday (from October 1 to October 7). This means that SSEC has broken above its 200-day SMA line at 2835 as well as the long-term downtrend line (at 2830) that stretches back to October 2007. With these double breakout, I believe SSEC is likely to commence on its new uptrend. You should get into CIMBX25 asap.


Chart: SSEC's weekly cahrt as at Oct 11, 2010_plotted on log scale (Source: Yahoo Finance)

Pelikan may have a bullish breakout

Background

Pelikan is involved in the manufacturing & distribution of writing instruments, art, painting & hobby products, office stationeries & printing consumables. In 1Q2010, it completed the acquisition of the Herlitz, Molkari & Ganymed group, which is involved in the sales of school and office products. For more on Herlitz, go here.

Recent Financial Results

Pelikan's results are pretty volatile. In QE31/3/2010, its net profit soared due to the recognition of negative goodwill of RM143.1 million from the acquisition of the Herlitz, Molkari & Ganymed group.


Table: Pelikan's last 8 quarterly results


Chart 1: Pelikan's 24 quarterly results

Financial Position

Pelikan's financial position is deemed satisfactory, with current ratio at 1.63 times & debt to equity at 0.57 time as at 30/6/2010.

Valuation

From the EPS of 4.58 sen for QE30/6/2010 & assuming that this June quarter accounts for 45-50% of its earning for a full year, I have arrived at an estimate for FY2010 EPS of 10 sen. Based on current price of RM1.24, Pelikan is trading at a PE of 12.4 times. At this multiple, Pelikan is deemed fairly valued, with limited potential upside.

Technical Outlook

Pelikan has been sliding even since it made a high of RM1.60 in August 2009. It has just broken above its downtrend line at RM1.21-1.22. Its next resistance levels are at the horizontal lines of RM1.30 & then RM1.40.


Chart 2: Pelikan's daily chart as at Oct 11, 2010 (Source: Tradesignum)

Conclusion

Based strictly on technical consideration, Pelikan could be a good trading BUY. However, if Pelikan can derive synergy from its new acquisition, it should be a stock to watch.

Tuesday, October 12, 2010

USD-RM cross rate poised to rebound

The Thai government agreed today to impose a 15 per cent withholding tax on interest and capital gains earned by foreign investors on Thai bonds, the latest bid by an emerging economy to tame its surging currency.For more, go here.

I believe this is one of the best weapons to tackle the inflow of hot moneys into our region. The alternative is to impose capital controls which are even more unpalatable to international community. Slowly but surely, the tide is turning...

From Chart 1 below, we can see that the cross rate for USD-RM has gone above the 20-day SMA line at 3.09. As at 4.30 am EDT, USD-RM cross rate was traded at 3.1065. Would the USD-RM cross rate rise sharply like in June-July 2009 (denoted as 'A') & April-June 2010 (denoted as 'C') or would it swing up & down like in October 2008 to February 2009 (denoted as 'B')? A sharp rise in the USD-RM cross rate would lead to a sharp correction in our stock market (see Chart 2 below). On the other hand, a bumpy ride for the USD-RM cross rate may not jeopardize the current rally in the stock market. I am more inclined towards the second scenario since the USD index has already recorded a death cross (as noted in an earlier post). Nonetheless, we must be prepared for choppy tradings ahead.


Chart 1: USD-RM exchange rate as at September 22, 2010 (Source: Yahoo Finance)


Chart 2: FBM-KLCI's daily chart as at Oct 11, 2010 (Source: Tradesignum)

Coastal- a good stock for long-term investment


Background

Coastal Contract Bhd ('Coastal') is involved in the provision of marine products & services to the shipping, Oil & Gas and commodities industries.

Recent Financial Results

For the QE30/6/2010, Coastal's net profit increased by 11.5% q-o-q or 46.4% y-o-y to RM48.3 million while its turnover was marginally lower than the immediate preceding quarter (QE31/3/2010) but soared by 46% over the previous corresponding quarter (QE30/6/2009). The beetr performance was attributable to better revenue from the Shipbuilding division.


Table: Coastal's last 8 quarterly results

A look at the past 6 years chart of Coastal's top-line & bottom-line shows that the company's growth record has been very impressive & consistent.


Chart 1: Coastal's 24 quarterly results

Financial Position

Coastal's financial position is healthy. As at 30/6/2010, its current ratio stood at 1.8 times while its bank borrowings to shareholders' funds stood at 0.3 time.

Valuation

Coastal (closed at RM2.29 yesterday) is now trading at a PE of 4.3 times its last 4 quarters' EPS of 52.55 sen. At this multiple & strong growth track record, Coastal is deemed a very attractive stock.

Technical Outlook

I have presented below 2 charts of Coastal. Chart 2 is the weekly chart plotted on arithmetic scale. It shows a stock that is trapped with a triangle ('XYZ'), with upside breakout (or, resistance) at RM2.40 & downside breakout (or, support) at RM2.15. Coastal was similarly trapped within a triangle in 2008, where it broke to the downside due to intense selling pressure during the Global Financial Crisis. With no crisis in sight, this bearish is not a likely scenario.


Chart 2: Coastal's weekly chart as at Oct 4, 2010_plotted on linear scale (Source: Tradesignum)

Chart 3 is a weekly chart plotted on logarithmic scale. It shows the stock in an uptrend (S-S2) where the support is at RM2.10. The horizontal support & resistance levels are at RM2.00-2.10 & RM2.40-2.70, respectively.


Chart 3: Coastal's weekly chart as at Oct 4, 2010_plotted on log scale (Source: Tradesignum)

Conclusion

Based on strong & steady financial performance, healthy financial position & attractive valuation, Coastal is a good stock for long-term investment. An upside breakout above RM2.40 could signal the continuation of its prior uptrend.

Monday, October 11, 2010

CPO has a bullish breakout today

CPO had a big move today. As at 3.30 pm, CPO December future contract was up RM132 to RM2914. With this move, CPO has broken above its "horizontal" resistance ('RR') at RM2800. The immediate resistance is the psychological level of RM3000.


Chart 1: CPO's daily chart as at Oct 11, 2010_3.00pm (Source: ifs.marketcenter.com)

The bullish breakout in CPO could lead to an upside breakout for the Plantation index, which is presently being blocked at the psychological 7000 level. In the afternoon session, the Plantation index is trading above the 7000 level.


Chart 2: Plantation's daily chart as at Oct 8, 2010 (Source: Tradesignum)

My preferred plantation stocks are IJMPlant and IOI. Even Sime may feature in the bullish plantation theme play.

Friday, October 08, 2010

Malton may have a bullish breakout

Background

Malton Bhd ('Malton') is involved in construction, project management & property development. Malton is well-known for being the project manager for the development of The Pavillion, Kuala Lumpur. For more on the group's activities, go here.

Pertinent, Unrelated Developments

Lately, Malton's major shareholder, Desmond Lim made news when his private company, Urusharta Cemerlang KL) Sdn Bhd acquired a small parcel of land (measuring 0.7 acre) near The Pavilion for RM210 million. The land was acquired at a whopping price of RM7210 psf- a new benchmark for KL commercial land.

Desmond Lim is also linked to a consortium, which consists of 1Malaysia Development Bhd (1MDB) and Lembaga Tabung Angkatan Tentera (LTAT), that has received approval in principle to redevelope the Sungai Besi Royal Malaysian Air Force (RMAF) base. Go here for more details.

Desmond Lim's high profile could be a good thing as well as being a liability. This in turn could have a negative impact on Malton.

Financial Performance & Position

Malton is a profitable company, which reported a net profit of RM21.9 million on a turnover of RM346.9 million for FYJune2010. Its financial position is satisfactory, with current ratio at 2.3 times and bank borrowings to shareholders' funds of 0.3 time as at 30/6/2010.

Valuation

With FYJune2010 EPS of 6.27 sen & current price of RM0.60, Malton is trading at a OE of 9.6 times. At this PE multiple, Malton- a mid-size construction-cum-property group- is deemed fully valued.

Technical Outlook

Malton is currently testing its horizontal resistance at RM0.60 after it broke above its downtrend line at RM0.48-0.50 two weeks ago. If Malton can break above teh RM0.60 resistance, it may test higher levels at RM0.80 & then RM1.00-1.10.


Chart: Malton's monthly chart as at Oct 1, 2010_plotted on log scale (Source: Tradesignum)

Conclusion

Based strictly on technical consideration, Malton could be a trading BUY. A good entry is either at RM0.55 (on pullback) or when it has broken above the RM0.60 mark.

Wednesday, October 06, 2010

Topglov- the Gloves Comes Off!

Results Update

Topglov has just announced its results for QE31/8/2010. Two things are worth noting immediately:
  1. its turnover dropped when compared to the immediate preceding quarter; and
  2. its net profit dropped for the second consecutive quarter.
The company attributed the poor performance to normalizing demand; higher latex prices; and weakening US dollar. The 'normalizing demand' was the same theme that I have written about for the past few quarters. However, the jury is still out as we have earlier noted the rebound in Adventa's profit which seems to promise a stop in the slide in the fortune amongst the glove producers. Alas, the present results of Topglov- the top glove producer in Malaysia and the world- is now staring at us. We must decide, whose results shall we take to represent the norm for the glove industry- Adventa or Topglov? I would go with Topglov's results.


Table: Topglov's last 8 quarterly results


Chart 1: Topglov's 17 quarterly results

Valuation

Topglov (closed at RM5.69 today) is now trading at a trailing PE of 14 times (based on its last 4 quarters' EPS of 40.7 sen). With earning sliding fast, the trailing PE may understate Topglov's PE multiple [or, make Topglov appear more attractive than it is (or will be)].

Technical Outlook

Topglov has rebounded from a recent intra-day low of RM4.98 recorded on September 23 to touch its 200-day SMA line (or equivalent to the 40-week SMA line) at RM5.75-5.80. Can it break above the 200-day SMA line? Not with this poor set of financial results!


Chart 2: Topglov's weekly chart as at Oct 6, 2010 (Source: Quickcharts)

Conclusion

Based on the poor financial results & negative technical outlook, I would rate Topglov a SELL.

Multico- another attractive smallcap

Background

Multi-Code Electronics Industries (M) Bhd ['Multico'] is involved in the manufacturing of electronics parts and accessories for the automotive industries. The factory is located at the Pandan Industrial Area, Johor Bahru, with approximately 500 employees.

Recent Financial Results

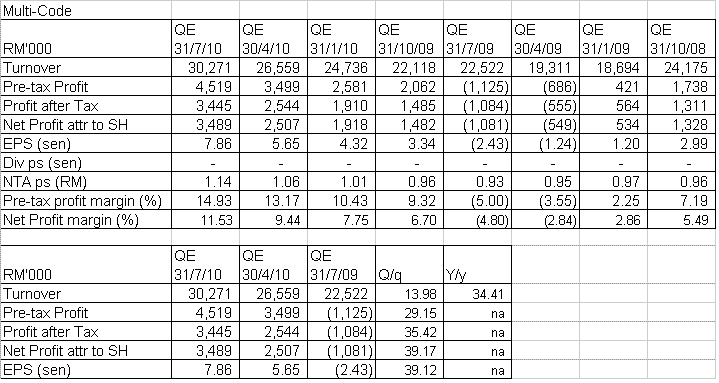
Multico has recently announced its results for QE31/7/2010, where its net profit increased by 39% q-o-q from RM2.5 million to RM3.5 million on the back of a 14%-increase in turnover from RM26.6 million to RM30.3 million. The improved performance is attributable to increased demand for motor vehicles.


Table: Multico's last 8 quarterly results


Chart 1: Multico's 13 quarterly results

Other Information

The huge losses incurred in QE31/7/2007 was due to provision for doubtful debts. Recently, 2 former directors of Multico were found guilty of defrauding the company of RM18 million in 2007. For more, go here.

Financial Position

Multico's financial position is very healthy, with strong liquidity & very little bank borrowings. As at 31/7/2010, its current ratio stood at 2.13 times & gearing ratio at 0.01 time.

Valuation

Multico (closed at RM0.745 yesterday) is now trading at a PE of 3.5 times (based on last 4 quarters' EPS of 21 sen). Being a smallcap stock, Multico could potentially command a PE of 6 times- giving it a potential target price of RM1.26.

Technical Outlook

After a long bottoming phase, Multico signaled its return by breaking above its strong horizontal resistance at RM0.60 in April. However, the stock did not go very far. After making a high of RM0.68, the stock dropped back. In late September, Multico surpassed the April high of RM0.68. This looks like a Cup-with-handle formation with the breakout at RM0.68. If this reading is correct, the stock could continue to rise & test the next horizontal resistance at RM1.00.


Chart 2: Multico's weekly chart as at Oct 5, 2010 (Source: Quickcharts)

Conclusion

Based on strong financial performance & position, undemanding valuation & positive technical outlook, Multico couls be a good stock for medium-term investment.

Tuesday, October 05, 2010

AWC- a cheap smallcap


Background

AWC Berhad (“AWC”) is involved in the provision of engineering services and integrated facilities management solutions in Malaysia, and rapidly expanding in Singapore and the Middle East. Its four core businesses are:
  1. Facilities – provides “one stop” integrated facilities management services to building owners.
  2. Engineering – leader in Building Automation System and specializes in heating, ventilation and air conditioning control systems (HVAC), hydronic balancing system and industrial cooling system.
  3. Technology – provides turnkey research & development for micro electronic software products, consumer electronics products and security related products.
  4. Environment – Proprietary brand STREAM, uses the breakthrough automated pneumatic vacuum technology for waste collection.
Recent Corporate Development

Yesterday, AWC announced a capital reduction scheme which was intended to wipe out its accumulated losses of RM45.8 million as at 30/6/2009 (or RM43.9 million as at 30/6/2010). The scheme involves the cancellation of RM0.20 from the par value of each ordinary share of RM0.50. Upon completion of the scheme, the outstanding shares will remain unchanged at about 228.679 million units, each with a par value of RM0.30.

The accumulated losses arose when AWC took over an ailing listed company, Trans Capital Holdings Bhd ('TCHB') in 2003. That was part of a restructuring exercise & from here, AWC ended up with TCHB's accumulated losses of RM80 million as at 30/6/2003 (which was slowly reduced to RM43.9 million as at 30/6/2010).

The proposed capital reduction scheme is nothing more than an accounting exercise to clear out a unpleasant blot from its Balance Sheet.

Recent Financial Results

AWC's net profit increased by 33% q-o-q to RM3.2 million on the back of a 29.5%-increase in turnover to RM66.7 million. Compared to the previous corresponding quarter (QE30/6/2009), AWC's net profit dropped by 26.1% despite an increase of 70.0% in its turnover. The seesaw movement in its top-line & bottom-line is due to a sharp drop in the company's profit margin due to increased sales from lower margin businesses.


Table: AWC's last 8 quarterly results


Chart 1: AWC's 8 quarterly results

Financial Position

AWC's financial position is very healthy with current ratio of 2 times & gearing ratio of 0.09 time as at 30/6/2010. Its cash balance stood at RM49 million or RM0.21 per share!

Valuation

Based on its close of RM0.23 yesterday, AWC is trading at a PE of 4 times (based on last 4 quarters' EPS of 5.72 sen). At this multiple, AWC is deemed quite attractive. As a smallcap, AWC could command a PE multiple of 6 times.

Technical Outlook

Over the past 2 years, AWC has risen from a low of RM0.06 to a high of RM0.36. The stock is still in a downtrend, where the price movement can be fitted into a 3-fan trend line. An upside breakout above the RM0.30 could be the start of an uptrend for this stock. The horizontal support levels are at RM0.20 & RM0.23 while horizontal resistance levels are at RM0.33 & RM0.36.


Chart 2: AWC's weekly chart as at Oct 4, 2010_plotted on log scale (Source: Tradesignum)

Conclusion

AWC is a relatively cheap smallcap, which was unfairly knocked down by the announcement of a capital reduction scheme yesterday. I view this scheme as nothing more than a housekeeping exercise to clear out a blot in its Balance Sheet. The sharp drop in the share price could be an opportunity to get into the stock as a lower price.

Monday, October 04, 2010

CIMBX25- an excellent proxy to ride the Chinese Dragon

The current issue of the Edge contained an interesting article by Anna Taing entitled "Recovery Headwinds". She wrote about the US dollar carry trade & the Japanese yen carry trade may create a wall of liquidity heading for emerging markets. This certainly explains the strong performance of equity markets throughout Asia for the past few months. However there is one market that is lagging behind- China. With the good manufacturing numbers, an under-valued currency & a stock market that has corrected sufficiently, I believe a bet on Chinese equity is turning into an irresistible trade.

One way to bet on Chinese equity is to construct a portfolio of top Chinese companies. If you do not have the resources to do, you can just buy CIMB FTSE Xinhua 25. This exchange traded fund (ETF) is constructed to mirror FTSE Xinhua 25 index, which is an index comprising the top 25 Chinese companies that are listed on the Stock Exchange of Hong Kong (go here).

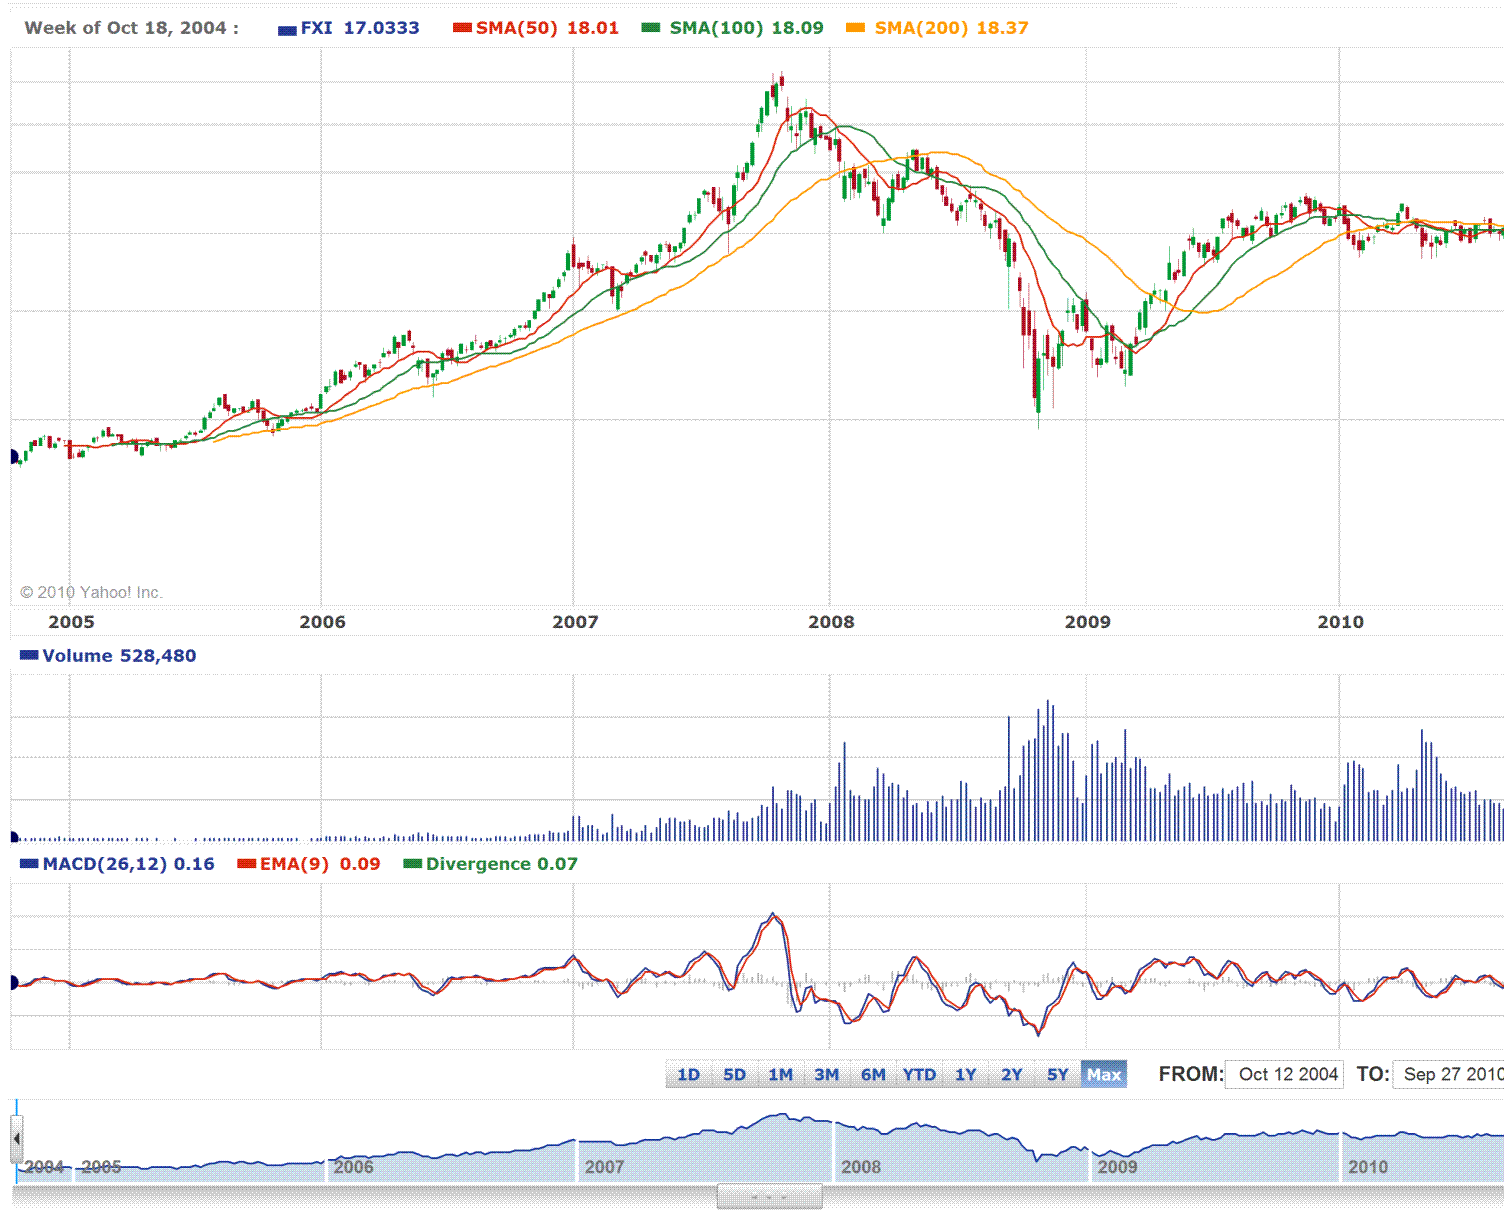
From Chart 1, you can see that FTSE Xinhua 25 (FXI) has been consolidating for the past 15 months & is poised for an upswing.


Chart 1: FXI's weekly chart as at Sept 27, 2010 (Source: Yahoo Finance)

Chart 2 below shows the price chart of CIMBX25. An upside breakout above RM1.05 could be the start of an uptrend in CIMBX25.


Chart 2: CIMBX25's daily chart as at Oct 4, 2010 (Source: Tradesignum)

I believe CIMBX25 is a good long-term investment in Chinese equity. You may accumulate this ETF today and buy more aggressively once it breaks above the RM1.05 level.

Friday, October 01, 2010

USD to weaken further

USD index did a death cross yesterday. This means that USD is likely to go lower over the next few weeks, possibly testing the uptrend line support at the 76 mark. However, the immediate outlook for USD for the coming week is mixed as I expect it to have a rebound from the horizontal support at 77.5 mark. This rebound would however be capped by the 50-day SMA line at 80.5.

The continued slide of the USD is causing serious problem to many exporters in Asia. There were many reports of Asian central banks intervening in the forex market to slow the rise of their domestic currencies but without success. While we hope that these interventions would arrest the slide of the USD, we also do not want to see a sharp reversal in the USD. This is because a sharp reversal in USD could trigger a sharp reversal in our stock market.


Chart: USD's daily chart as at September 30, 2010 (Source: Stockcharts.com)

Genting SP- likely to trade sideway

Genting SP rebounded today, chalking up a gain of 14 cents to close at S$2.00. Some people beat themselves up for not buying at the low of S$1.85 yesterday. Last week, a different group of players beat themselves up for selling at the high of S$2.18 on September 20. Seldom have I seen a stock that has elicited such strong emotion as this stock. Genting SP, a gambling stock that truly bring out the gambling instinct in all of us.

However, I believe that Genting SP will soon satisfy the demand of the two diverse group of players. For those who missed selling at S$2.18, they may see the stock at or near that price again. For those who missed buying at S$1.86, they may also see the stock at or near that price again. Of course, these 2 scenarios would not happen at the same time. How could it be possible, you may ask. It's possible because I believe this stock has made a temporary top & for the next few months, it's likely to trade sideway- revisiting its recent high as well as its recent low. For those who can muster their emotion, this stock could be an excellent trading stock. You may make good money by trading the swing from the low to the high.


Chart: Genting SP's weekly chart as at Sept 30, 2010 (Source: SGX)

TSM has a second core business

Background

TSM Global bhd [formerly, Juan Kuang (M) Industrial Bhd] ('TSM') is involved in the manufacture & supply of wiring harness systems (for motor vehicles) and auto accessories as well as being an importer & wholesaler of electrical products & access.

In QE31/7/2010, TSM completed the acquisition of a 85.47% stake in Kenseisha (M) Sdn Bhd (KMSB) from Sierra Indah Sdn Bhd for RM15.08 million (here). KMSB is involved principally in die-casting and precision machining of parts for electronic equipment. It has two plants in Bangi Industrial Estate, Selangor.

Recent Financial Results

TSM has just announced its results for QE31/7/2010, where its net profit dropped by 25% q-o-q or 4% y-o-y to RM6.4 million. Its turnover increased by 49% q-o-q or 76% y-o-y to RM110 million. KMSB contributed RM19.6 million to the turnover. TSM's profit for this quarter was weighed down by operating loss of RM2.637 million incurred by KMSB & the writing off of goodwill arising from the acquisition of KMSB of RM2.777 million. TSM is working towards achieving a breakeven in operating results from KMSB by the present 4th quarter.


Table: TSM's last 8 quarterly results


Chart 1: TSM's past 25 quarterly results

Financial Position

TSM's financial position is deemed very healthy. As at 31/7/2010, its current ratio was at 2.5 times whiel bank borrowings to shareholders' funds stood at 0.13 time.

Valuation

TSM (closed at RM3.22 yesterday) is now trading at a trailing PE of 6 times (based on last 4 quarters EPS of 54 sen). If TSM can turnaround the operation of KMSB, TSM would achieve better earning in the next financial year. As such, its future PE multiple could be lower than 6 times. Even at the present trailing PE of 6 times, TSM's valuation is deemed undemanding.

Technical Outlook

TSM has risen steadily from about RM1.00 in 2009 to above RM3.00 now. Its immediate horizontal support is at RM3.00 while its immediate horizontal resistance is at RM3.30. If it can break above the RM3.30 level & the recent high of RM3.50-3.60, TSM could potentially go to the RM5.00.


Chart 2: TSM's weekly chart as at Sept 30, 2010_plotted on log scale (Source: Tradesignum)

Conclusion

Despite the dip in its net profit, TSm is still an interesting company. Its two core business could propel TSM to higher level of profitability. Based on undemanding valuation & good financial position undemanding valuation, TSM could be a good stock for long-term investment.

PBA get a 27%-increase in water tariff

Background

PBA Holdings Bhd ('PBA') is involved the supply of water to the State of Penang. For more on PBA, go here.

New Development

PBA has just announced that it has been granted a 27% increase in water tariff starting from November 1 this year. The new & existing rate are tabulated below. (For more, go here)


Table 1: PBA's water tariff rates

Recent Financial Results

A quick look at PBA's recent financial performance shows that the company's profitability has stabilized in the past few quarters after a pro-longed slide that started in 2007. The decline in profitability happened despite a steady rise in turnover because of the absence of any increase in water tariff rate for the past few years. The new rate should boost PBA's bottom-line significantly but I am unable to estimate the quantum of this increase.


Table 2: PBA's last 8 quarterly results


Chart 1: PBA's past 21 quarterly results

Valuation

PBA (closed at RM0.93 yesterday) is trading at a trailing PE of 15.5 times (based on the past 4 quarters' EPS of 6 sen). At this multiple, PBA is deemed fully valued. With the new tariff rate, PBA's earning could be much better. Assuming that PBA's net profit returned back to the level achieved in FY2007 of about 13 sen, then PBA's future PE would be about 7.2 times.

Technical Outlook

PBA has been in a downtrend line since 2003. If it can break above that downtrend line at RM0.98-1.00, the stock could slowly rise in an uptrend.


Chart 2: PBA's weekly chart as at Sept 30, 2010_plotted on log scale (Source: Tradesignum)

Conclusion

Based on the new tariff rate & expected better results, PBA could be a good stock for long-term investment. A break above the long-term downtrend line at RM1.00 could be the start of a new uptrend for PBA.