Friday, August 18, 2006

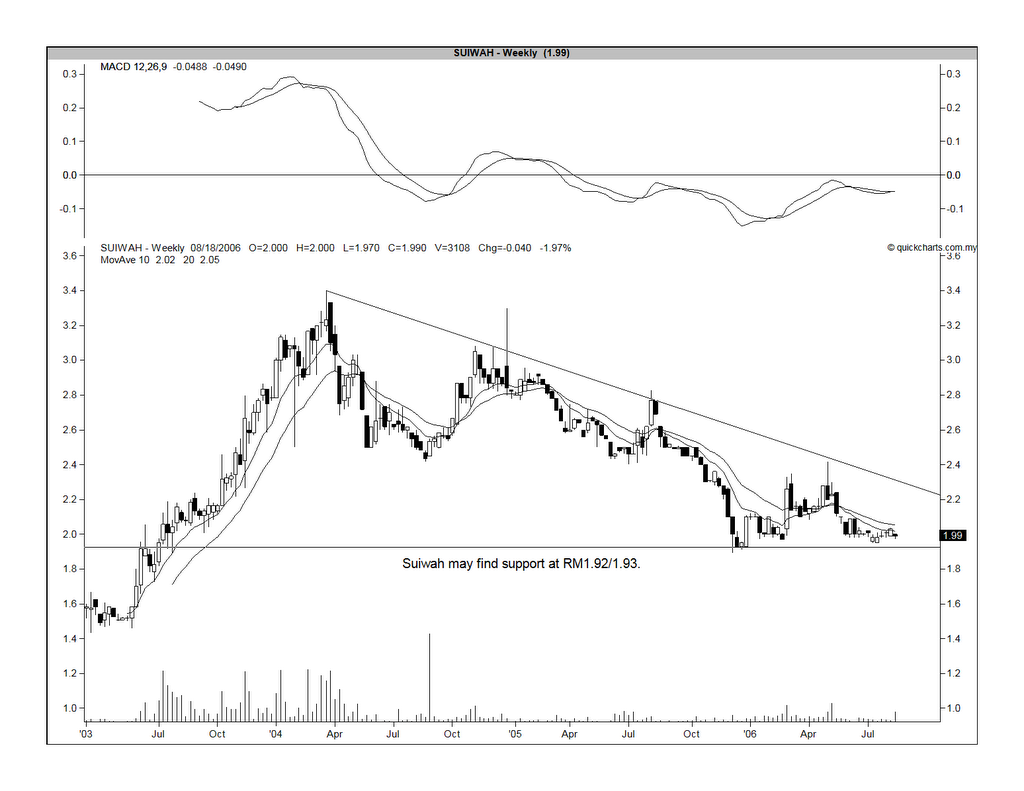
Suiwah dipped below RM2.00

On July 13, I have recommended a BUY on Suiwah based on fundamental consideration. The share has recently dipped below the psychological level of RM2.00. After further studies, I've discovered that the RM1.90-2.00 level for Suiwah is a congested support area. Until it broke below the RM1.90, I would not be too unduly worry about the recent technical weakness in this share.


Chart 1: Suiwah's daily chart as at August 17


Chart 2: Suiwah's weekly chart as at August 17

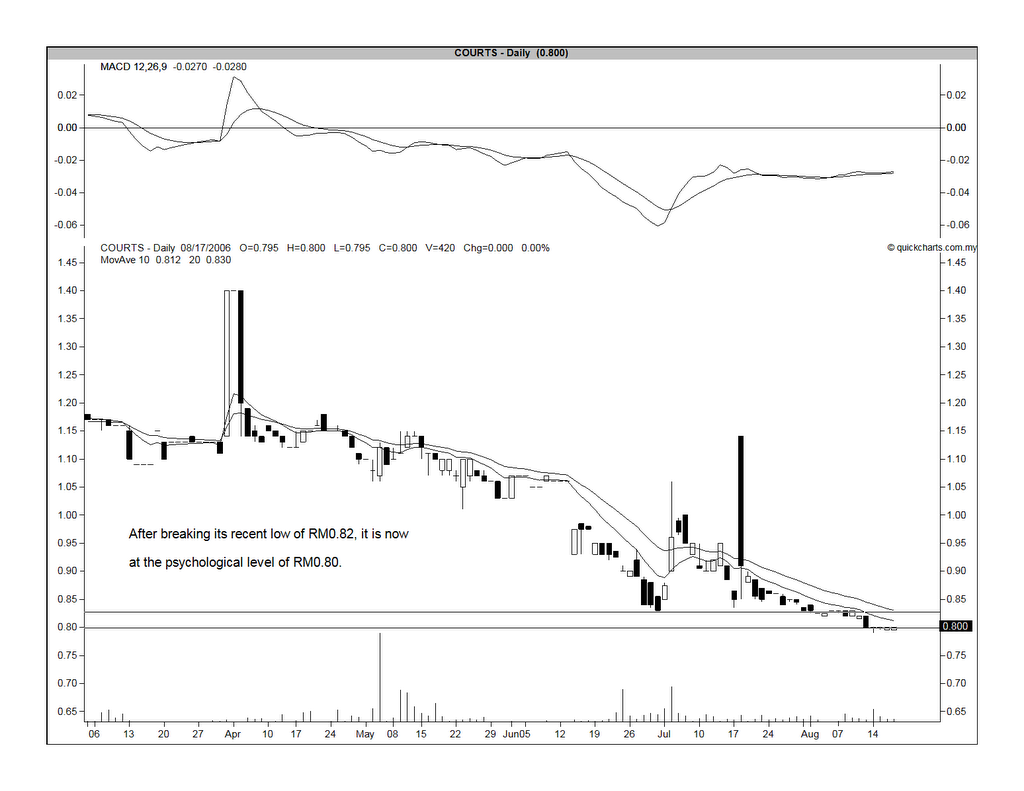
Courts broke its recent low of RM 0.82

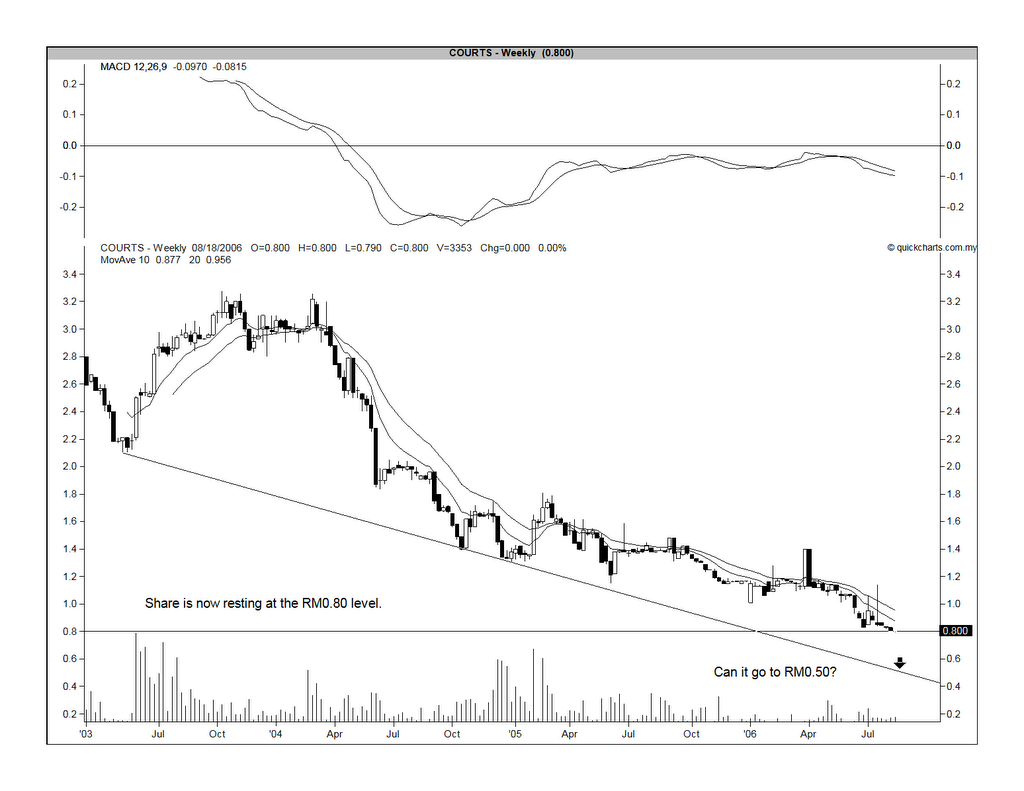
On July 21, I've recommended Courts as a Long Term BUY based on break-up valuation at RM1.12. The stock has recently made a new low of RM0.79/0.80, which is marginally lower than the recent low (support) of RM0.82. As Courts was not a BUY call based technical consideration, I shall maintain my recommendation for this stock. Nevertheless, I like to point out that a break below RM0.80 may bring forth further selling.


Chart 1: Courts' daily chart as at August 17


Chart 2: Courts' weekly chart as at August 17

More results announcement from Steel players

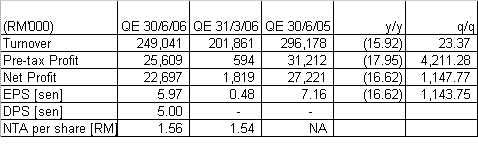
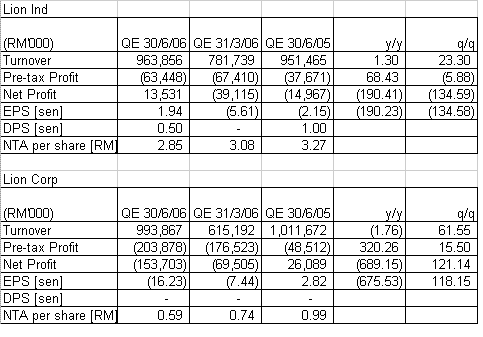
Onasteel, Lion Industries ("Lion Ind") & Lion Corp had reported their results for QE 30/6/06. The result for Onasteel is very encouraging. Net profit increased 11 folds to RM22.7 mil q-o-q on the back of a 23%-increase in turnover to RM249 mil. On a y-o-y comparison, net profit & turnover are off by 16.6% & 15.9% , respectively (see atble 1 below).


Table 1: Onasteel's Financial Results for QE 30/6/06.

The results for Lion Ind & Lion Corp are harder to analyse because they are both conglomerates. From a study of the notes to the account, Lion Ind reported a 29%-drop in the operating loss for the Steel division to RM14.7 mil on the back of 30%-increase in turnover to RM807 mil for QE 30/6/2006 when compared to the immediately preceding quarter. For Lion Corp, the Steel division has also reported a 41%-drop q-o-q in its operating loss to RM43.8 mil on the back of a 66%-increase in turnover to RM973 mil for the same period. I have appended the results for QE 30/6/06 for these companies for your viewing.


Table 2: Lion Ind & Lion Corp's Financial Results for QE 30/6/06.

So, we are still awaiting more results that may confirm the recovery in the steel sector is for real.

APM reported a decent 2Q2006

Despite the slowdown in the auto sector, APM reported a decent result for 2Q2006. Net profit increased 7.6% q-o-q to RM16.3 mil on the back of a 2.0%-increase in its turnover of RM234.5 mil. But, the bottomline & topline were lower than the corresponding quarter in 2005 by 6.2% & 1.3% , respectively. See the Table below for the result for 2Q2006.


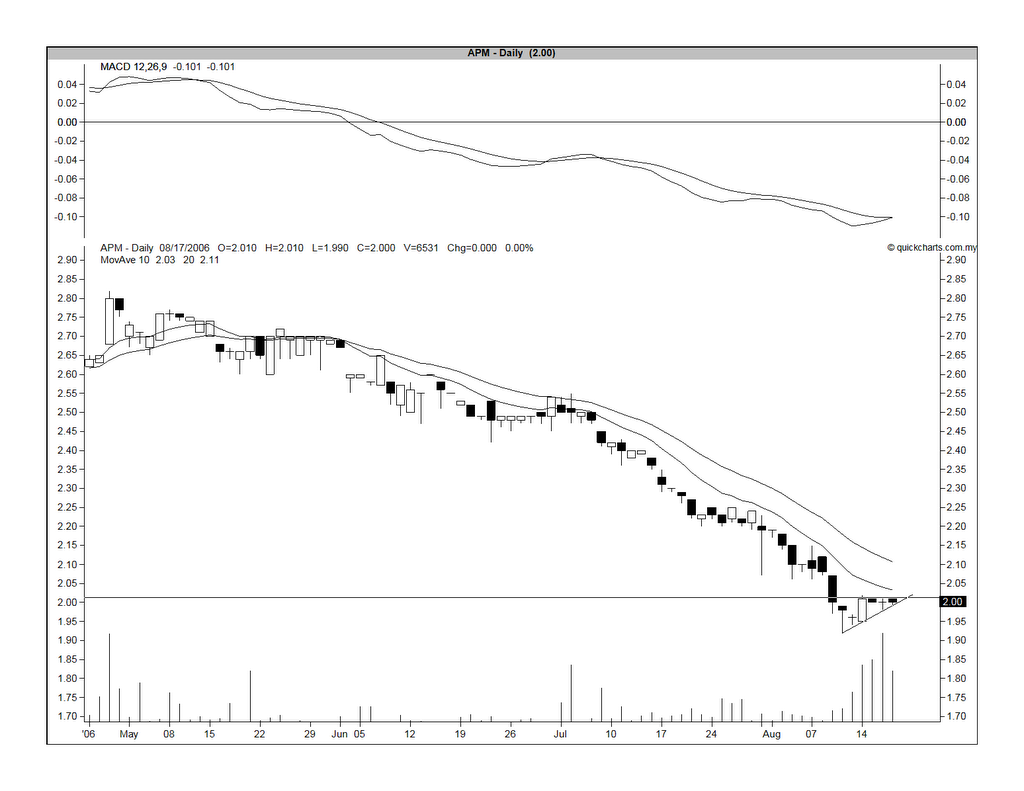
Recently, APM has broken below its strong horizontal support of RM2.20 (see Chart 1 below). It has dropped to a low of RM1.92 before recovering to stay above the RM2.00 mark. A bottoming process has begun & an ascending triangle can be seen. A break above RM2.02/2.03 could lead to further recovery in the share price in the short-term (see Chart 2 below).


Chart 1: APM's monthly chart as at August 17


Chart 2: APM's daily chart as at August 17

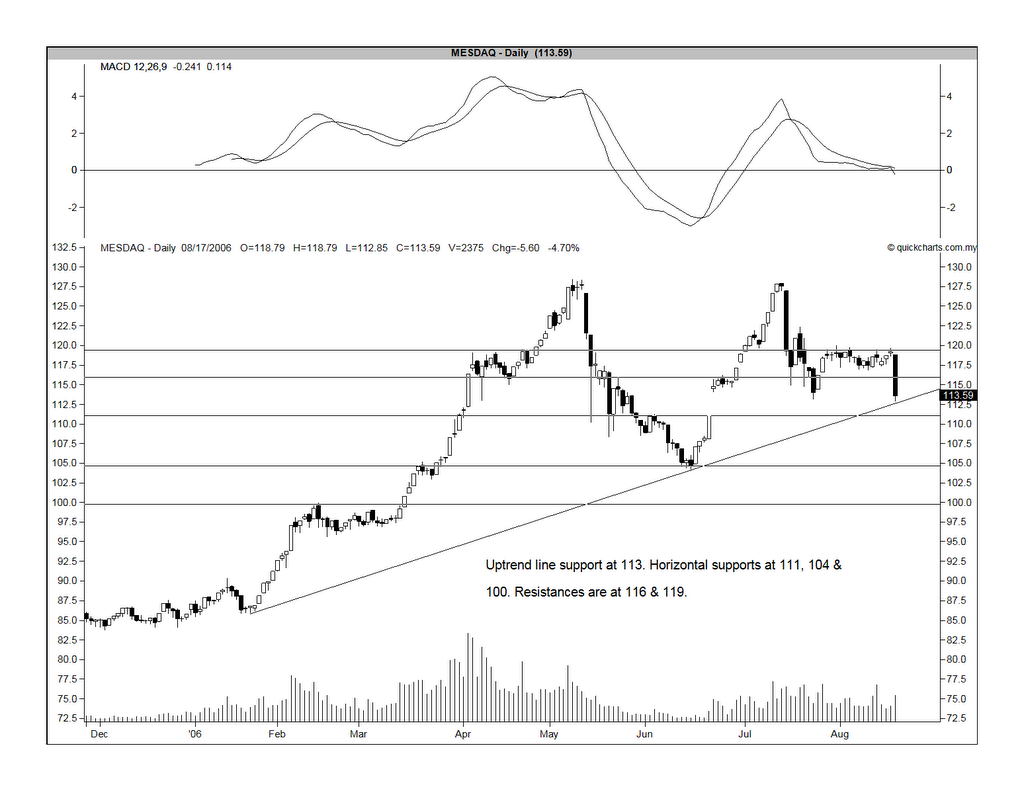
Mesdaq at the uptrend line support of 113

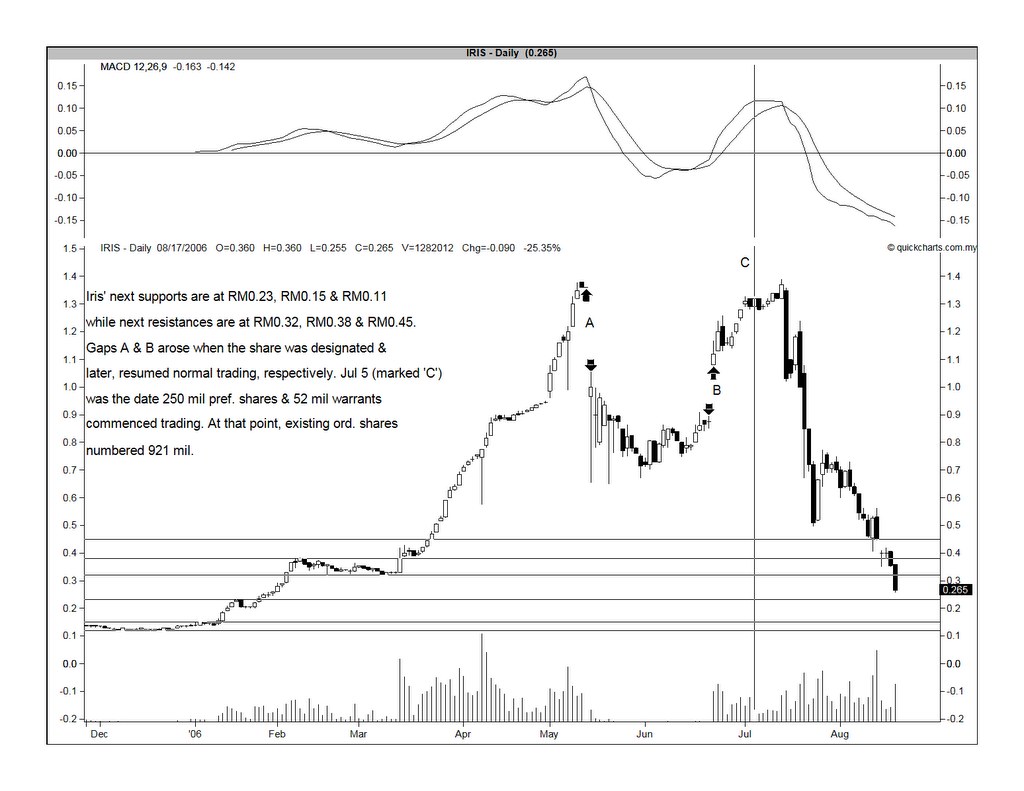
Yesterday, the Mesdaq had one of its worst days when 2 of its outstanding performers i.e. Iris & Mobif came down sharply. Iris, the rise of which epitomizes the rise of the Mesdaq in the past 6 months, continues its steady decent after making its double top at RM1.39 on July 13. Yesterday, Iris dropped 9 sen or 25% to 26.5 sen (see Chart 1 below). Mobif has dropped by an even bigger margin of 51% or RM1.83 to RM1.77 yesterday (see Chart 2 below). Unlike Iris, Mobif’s drop yesterday was its first day of selldown and its shareholders will likely to have many more anxious days ahead.


Chart 1: Iris' daily chart as at August 17


Chart 2: Mobif' daily chart as at August 17

How did these affect the Mesdaq? From Chart 3 below, you can see that Mesdaq is now nearing its uptrend line support of 113. A break below 113 would signal further consolidation ahead. At lower level, horizontal supports can be seen at 111, 104 & 100.


Chart 3: Mesdaq' daily chart as at August 17

Crude Oil just tested the USD70 level!

Last night, the Crude Oil has tested the uptrend line at USD70 level & rebounded! See Chart 1 & 2 below.


Chart 1: NYMEX Crude Future's 60-minute chart as at 20.30 GMT August 17


Chart 2: NYMEX Crude Future's weekly chart as at August 17


Before going further, I like to point out that the crude oil price in all the charts here refers to the price of Light Crude Oil that is traded as NYMEX Crude Future. The quote for this future contract can be easily obtained from Bloomberg (go here). The charts used here are obtainable from FutureSource's iFC Marketcenter.

Some of you may wonder why I am tracking the price of crude oil. Crude oil's recent price rise has contributed significantly to the rise in inflation rate. There are obviously other reasons for the spike in inflation rate, such as easy monetary policies adopted by the Fed & other central banks throughout the world from 2002-2004, etc. But, the accelerating price of crude oil has been the most watched phenomenon & if the crude oil rally were to weaken substantially (or, better still, to reverse downward), the positive implication of a less restrictive monetary policy that follows, would be most welcomed by equity investors.

Thursday, August 17, 2006

Crude Oil about to test its uptrend line at USD70

Recently, the crude oil was spooked by a series of negative news. These include the war in Lenanon and pipeline leaks in Russia and, later on, in Alaska. All these were happening as the US was about to enter the Hurricane season and, as expected, it helped to push up the price of crude oil to almost USD80.

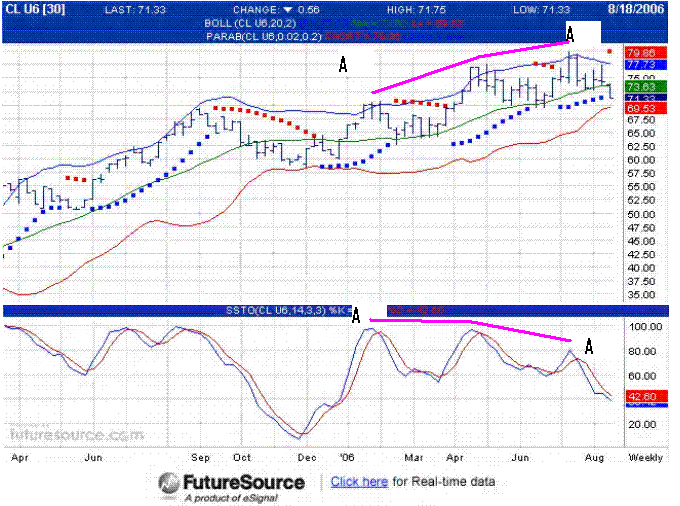
However, if we compare the price movement with one of the indicators i.e. the Slow Stochastic, we could see that as the price of crude oil was making new highs in the past 7 months, the Slow Stochastic is actually making lower highs (see Chart 1 below). I have highlighted the 3 highs of the crude oil price and the 3 accompanying highs of its Slow Stochastic in pink & marked as "AA". The bearish divergence is indicating to us that the internal of the crude oil rally is weakening.


Chart 1: Crude Oil overlaid with Bollinger Bands(20,2); Parabolic(20,20,200); & Slow Stochastic(14,3,3,3)

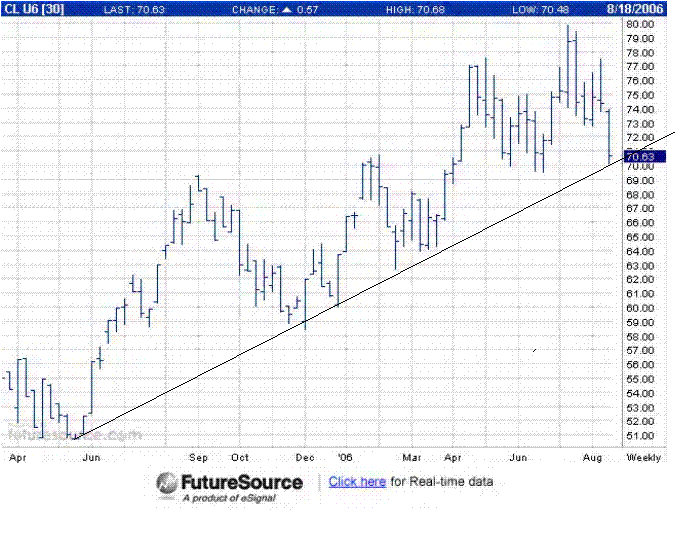
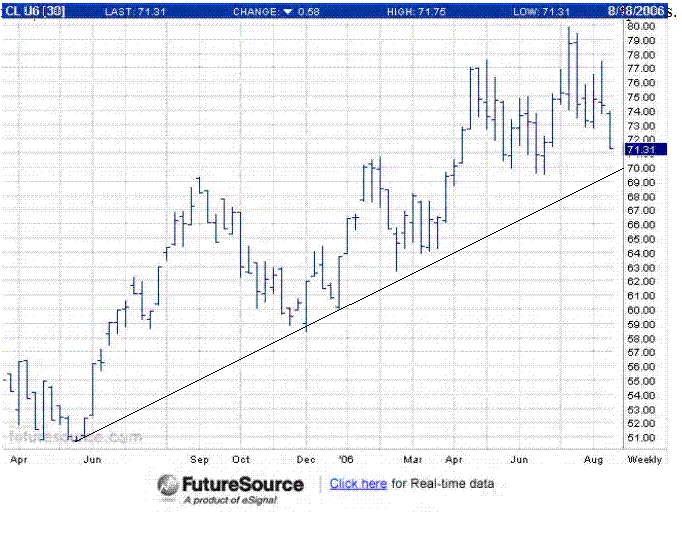
The crude oil is now coming down, reacting to the ceasefire in Lebanon. Other concern for the oil crowd may include slowdown in US & global economy. From Chart 2, we can see that crude oil is clearly in an uptrend line, with the support at USD70. The big question is whether this uptrend line will hold? A break of this uptrend line could be the end of the crude oil rally.


Chart 2: Crude Oil overlaid with uptrend line.

Wednesday, August 16, 2006

CI is going nowhere soon.

The CI appears to be in an upward channel since recovering from the May/June selldown. It has been pushing against the upper channel since Jul 27 but it has not been able to break above it. A re-test of the lower channel could happen if the market corrects over the next few days as it adjusts for the upcoming school holidays from August 19 to 27 (see Chart 1 below).


Chart 1: CI's daily chart as at August 15

The only excitement is in the Plantation sector. The Plantation index is well-supported by its ST uptrend line at 3500 level (see Chart 2 below). The Plantation theme play is starting to broaden out to include some second- & third-liners. One such share is Unico-Desa, which I have made a trading call on Unico-Desa on August 3 when it broke above the RM0.53 horizontal resistance.

Eventhough I am optimistic about the current prospect of the plantation sector, I'm also very cautious as a lot of good news has already been factored into the price, especially amongst its leaders such as IOI, KLK & PPB Oil. The rise of the cheaper stocks could signal the blow-out stage of the plantation theme play. The rewards at this stage are high, as are the risks. As usual, my advice is to have protective stop loss whenever you open a position in this kind of market. Good luck.


Chart 2: Plantation's daily chart as at August 15

Tuesday, August 15, 2006

MISC's 1Q2007 net profit down 29% y-o-y

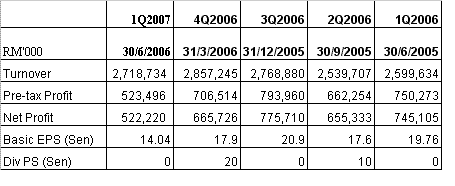
MISC's net profit dropped 29.9% y-o-y to RM522 mil while turnover increased 4.6% to RM2.718 billion (see the Table below). The drop in profitability is attributed to lower freight rates in the container shipping business while the core business of energy shipping is fairly stable. In addition, net profit was also negatively impact by higher bunker expenses due to rising price of fuel from US$260 (RM975) a tonne to US$325 a tonne.


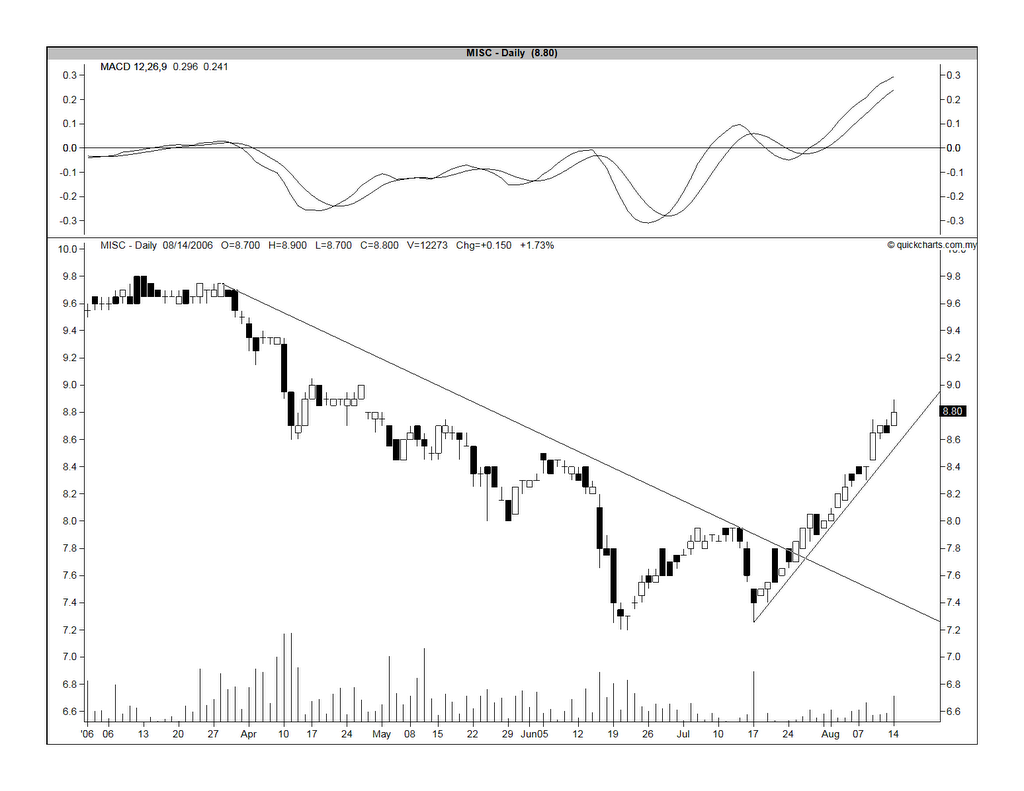
Since my bullish call on August 1, the share price of MISC has gained about 9% to RM8.80, based on yesterday (August 14)'s closing price. The share is in a steep ST uptrend line with support at RM8.60. A break of this uptrend would lead to correction with support seen at RM8.50 and then RM8.00 (see Chart below).


Chart: MISC's daily chart as at August 14

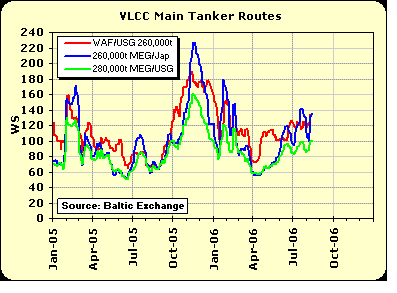
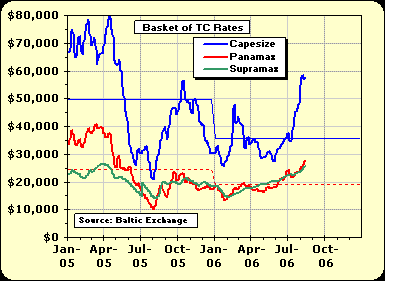
The latest charts on the movement of freight rates for tankers & bulk carriers, which are appended below, are supportive of my view that the rates have probably bottomed.


Chart for VLCC/ULCC Markets w/e 11th August 2006


Chart for Dry Bulk Markets w/e 11th August 2006

Monday, August 14, 2006

From the Edge for w/e 8/20/06

From the current issue of the Edge, we have the following interesting articles:

1. IMP3 to sharpen our edge

The 3rd Industrial Master Plan ("IMP3"), which will be unveiled soon, will deal with the problem of how to broaden our export base as well as how to move from our heavy dependence on the Electronic & Electrical sector to high technology & knowledge intensive activities with high value added content. This is very relevance given the recent lagging performance of our export vis-a-vis other Asian countries, which gave rise to concern about our competitiveness.

2. CPO: How high will it go?

Whenever you read a headline like this, you have asked yourself whether it is time to be a contrarian. Money is never made with information that is openly available to everybody. Some stocks may be worth a trade but on the whole, one has to be very cautious at time like this. When things are too good to be true, normally they are.

3. Mesdaq: A fair share of the Gems

This week's cover story is on Mesdaq. While 38% of the companies listed in this Board reported a negative growth in their net profit, it is heartening to see that 35% managed to report more than 50% growth. The star performers are Green Packet, mTouche, Dreamgate, REDtone, GHL System & AKNMtech. AKNMtech??? A little story is in order here...

AKNMtech was a stock that I had recommended as a BUY in April 2004 when it was trading at RM2.60. The share price has been dropping ever since I've made that call and as at last Friday, it closed at only RM0.285! From this, I've learned an important lesson: Investing in Mesdaq shares is not easy. Some of the technologies involved are beyond our ability to fully comprehend and even if you do, the technologies & the regulations can change very rapidly that a good stock today can turn out to be a lame duck tomorrow. In this sector, technical analysis & protective stop loss are a must!!!

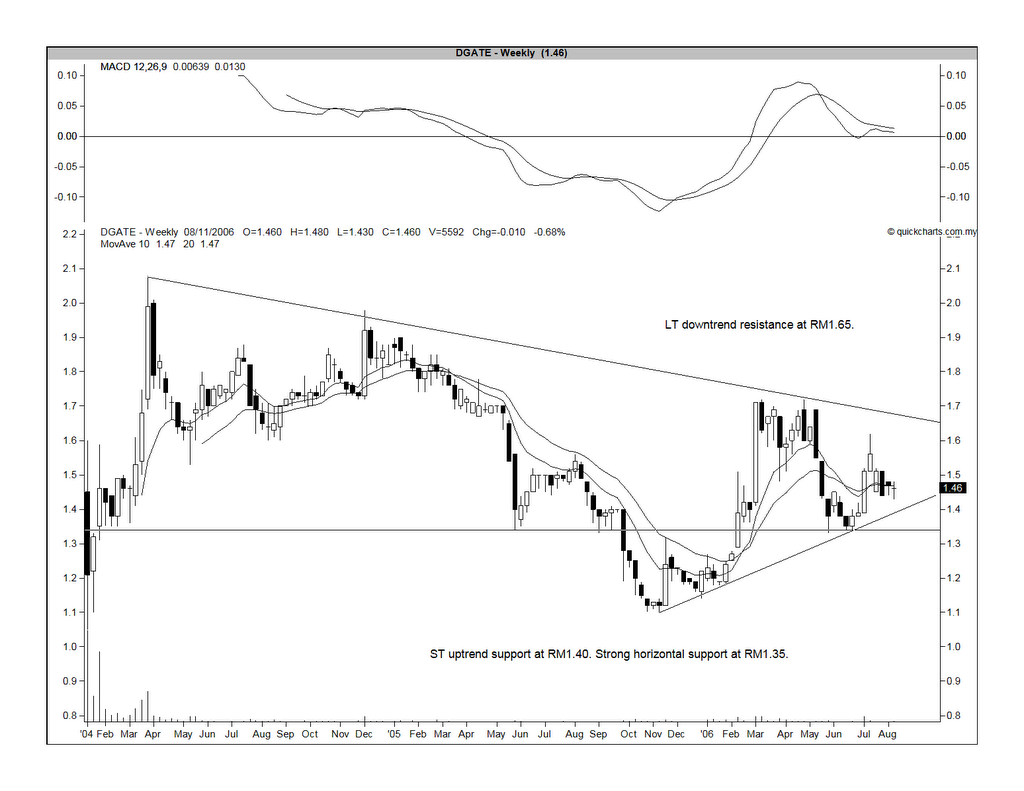
Having said that, one of the star performer i.e. Dreamgate is a stock that I am comfortable to recommend as a Long Term BUY. It supplies slot machines & casino games equipment. The casino scene in Asia is definitely picking up & Dreamgate is likely to get a big slice of the action. Based on CIMB's report dated 20060731, Dreamgate is expected to record an EPS of 12.4 sen & 14.4 sen for 2006 & 2007, respectively. This is a decent jump from only 10.0 sen for 2005. Based on the closing price as at August 11 of RM1.46, the share is trading at a PE of 14.6 times its 2005 earning.

From the chart below, we can see that the stock is in a ST uptrend but its upside is impeded by an overhead downtrend line. It is a good BUY at RM1.40 but a break above RM1.65 could signal the upside rally for the stock. It has a very strong horizontal support at RM1.35, so buying at RM1.40 is fairly safe.


Chart: Dreamgate's weekly chart as at August 11

Konsort also has a bullish breakout

Konsortium Logistik ("Konsort") was in a downtrend, which was only broken when the share price surpassed the RM0.49 level in w/e Jan 13, 2006 (see Chart 1 below).

Thereafter, the share price went sideway for about 3 months. Since May this year, the share price has been fairly volatile with strong resistance set at RM0.845 level. Its trading resembles an ascending triangle (see Chart 2 below) with a breakout at the RM0.845 level. This morning, the share price has broken above that level & hit a high of RM0.89, just before 10.30 a.m. At the time this post is written, the share price has eased back to RM0.85/0.855. If the share closed at RM0.845 (or, higher) today & can maintain above the RM0.845 level over the next day or two, I believe a bullish break of the ascending triangle has been achieved. The outlook for this stock would be positive.


Chart 1: Konsort's weekly chart as August 11


Chart 2: Konsort's daily chart as August 11

MEMS has a bullish breakout

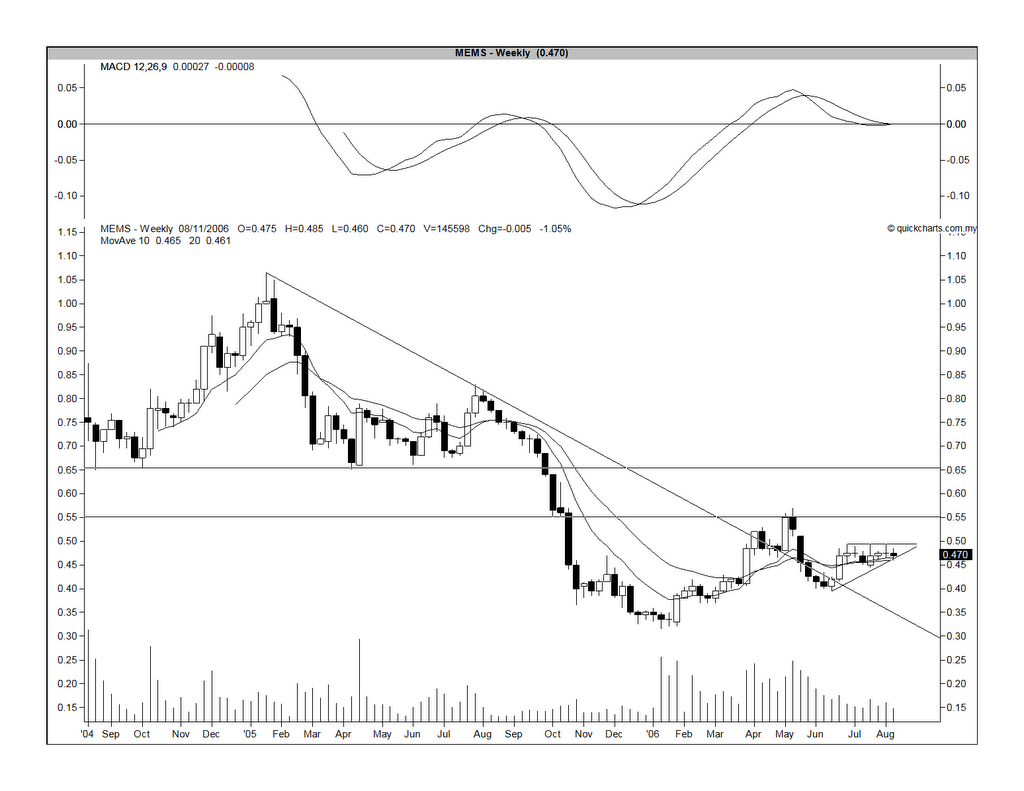
Mems was in a downtrend since making a high of RM1.06 in w/e Jan 21, 2005. The downtrend line was only broken when the share price broke above the RM0.50 level in w/e Apr 7, 2006 (see Chart 1 below).

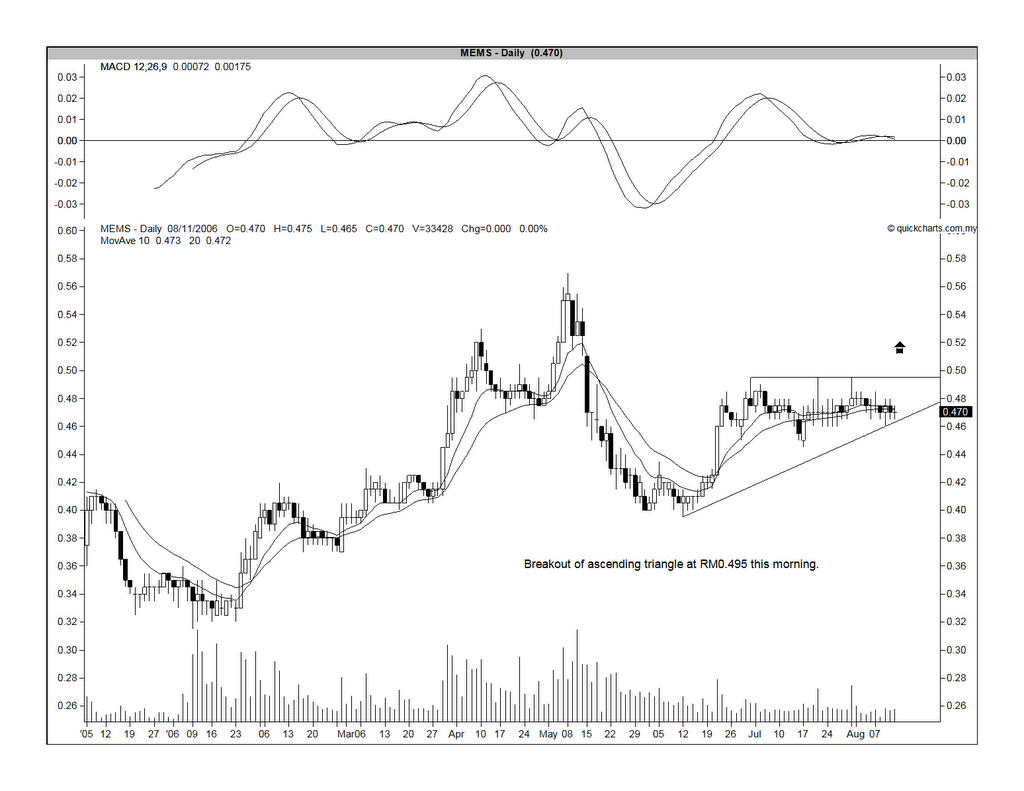
Thereafter, the share price slided back & has been trapped in an ascending triangle for the past 1 to 2 months (see Chart 2 below). A break above the RM0.495/0.50 level could signal the beginning of an uptrend for this stock. This morning, the share price has broken above RM0.50 level & hit a high of RM0.52, just before 11.00 a.m. At the time this post is written, the share price has eased back to RM0.49/0.495. If the share closed at RM0.495/0.50 today & can maintain at this level over the next day or two, I believe a bullish break of the ascending triangle has been achieved. The outlook for this stock would be positive.


Chart 1: Mems' weekly chart as at August 11
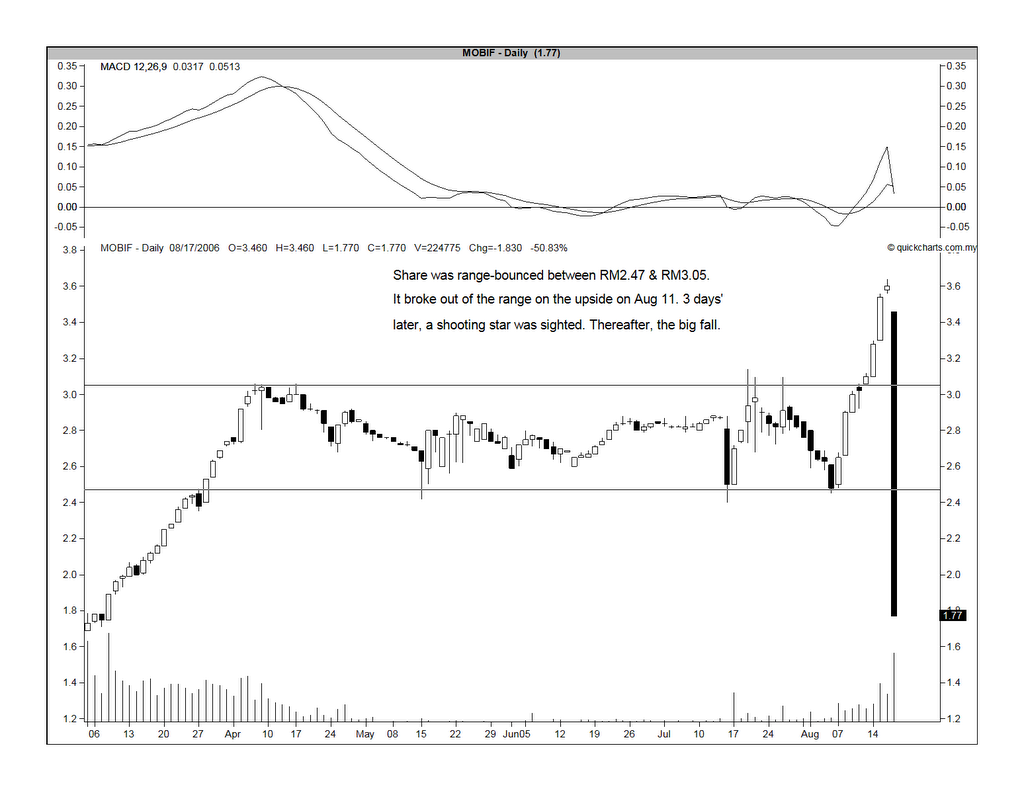


Chart 2: Mems' daily chart as at August 11
Friday, August 11, 2006

Linkfest

It's linkfest time again.

1. Last week, a lot of people were surprised by Malayawata's excellent results for QE 30/6/2006. Other steel players have yet to report their results for the same period but going by the Malayawata numbers, I believe their results should be just as good. Here is a look at one of the world-class steel-maker from Korea.

2. Recently, one of the research house upgraded their BUY call for UPA because "recent weakness in the share price, which retraced to a 52-week low, is a good entry point to UPA". Some people believe that buying a stock that has just made a 52-week low is a bad idea. Read more about it here.

3. You may have read about the recent cancellation of the WIMAX tender in Malaysia. WIMAX is viewed by some as the next great disrupter. If you like to know more about WIMAX, go to here and here.

4. A very good piece from Paul McCulley of PIMCO about Fed rate hike & the direction of bond yield. Read about it here.

5. Jeffrey Saut asks whether you are investing with the best?

6. Finally, if you want to get your hand on some research reports before making that decision to invest in some stocks, go to Bursa Malaysia's e-Research vault. You need only to register with them & the reports are there for your viewing for free.

Happy reading & have a good weekend.

Steel sector theme play may unfold soon

On August 7, I have posted a story from the Edge about the bright outlook for the steel sector. I have looked through the charts of all the big steel players and the following stocks look appealing to me.

1. Southern Steel ("SSteel").

SSteel is still in an uptrend, which began in January this year. The uptrend line support is at RM1.00/1.02. The stock's immediate resistance is at RM1.06. A break above this resistance could signal continuation of its uptrend.


Chart 1: SSteel's daily chart as at August 10

2. Lion Industries ("Lion Ind")

Lion Ind is also in an uptrend, which has commenced in December last year. The uptrend line support is at RM0.83. A break above RM0.90 could signal the continuation of its uptrend.


Chart 2: Lion Ind's daily chart as at August 10

3. Malaysia Steel Works ("Masteel")

Like SSteel & Lion Ind, Masteel is still in an uptrend which began in January 2006. The stock's immediate resistance is at RM0.80. A break above that level could signal the continuation of its uptrend.


Chart 3: Masteel's daily chart as at August 10

4. Ornasteel ("Onastel")

Unlike SSteel, Lion Ind & Masteel, Onastel has broken its uptrend in May this year. It is range-bounced between RM0.80 & RM0.88. Onastel has broken above RM0.88 on August 9. If it can hold above RM0.88, the stock is likely to move higher from here.


Chart 4: Onastel's daily chart as at August 10

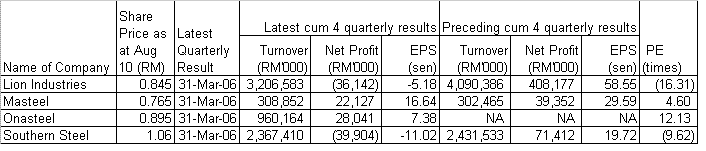
The financial performance of the above stocks are tabulated below:

Golden Hope- a BUY now.

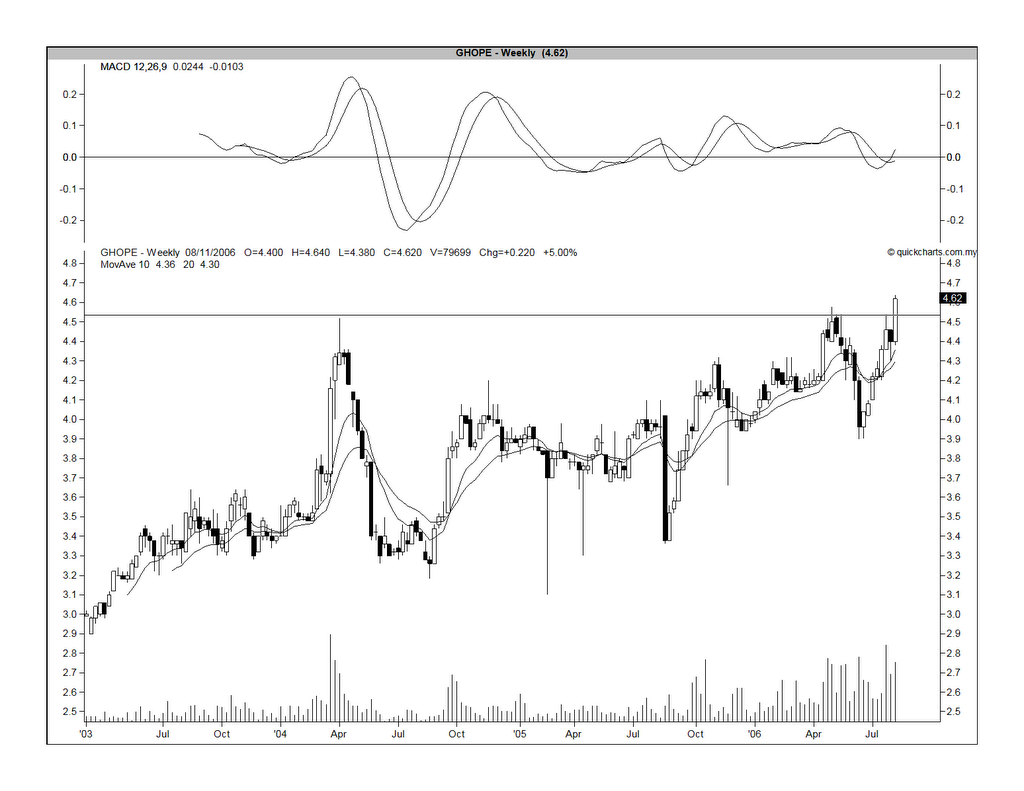
Golden Hope ("GHope") has broken above its strong horizontal resistance at RM4.54 yesterday (August 10). The next resistance will be RM5.30 while the psychological level of RM5.00 will also act as a resistance (see Chart 1 below).
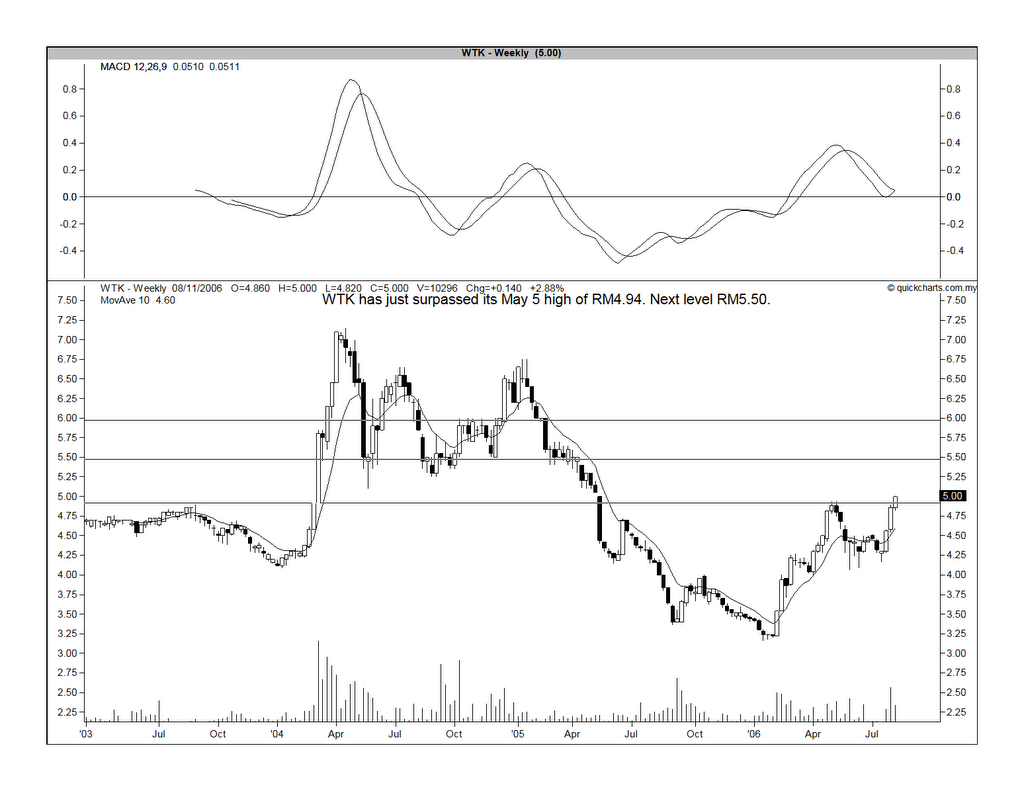


Chart 1: Ghope's weekly chart as at August 10

The monthly chart shows that GHope has actually broken above its long-term downtrend line in January 2004 at the RM3.60 level (see Chart 2 below). With the breaking of the strong horizontal resistance at RM4.54, the stock is likely to go higher.


Chart 2: Ghope's monthly chart as at August 10

Thursday, August 10, 2006

TH Plant- a buy if it breaks above RM2.07

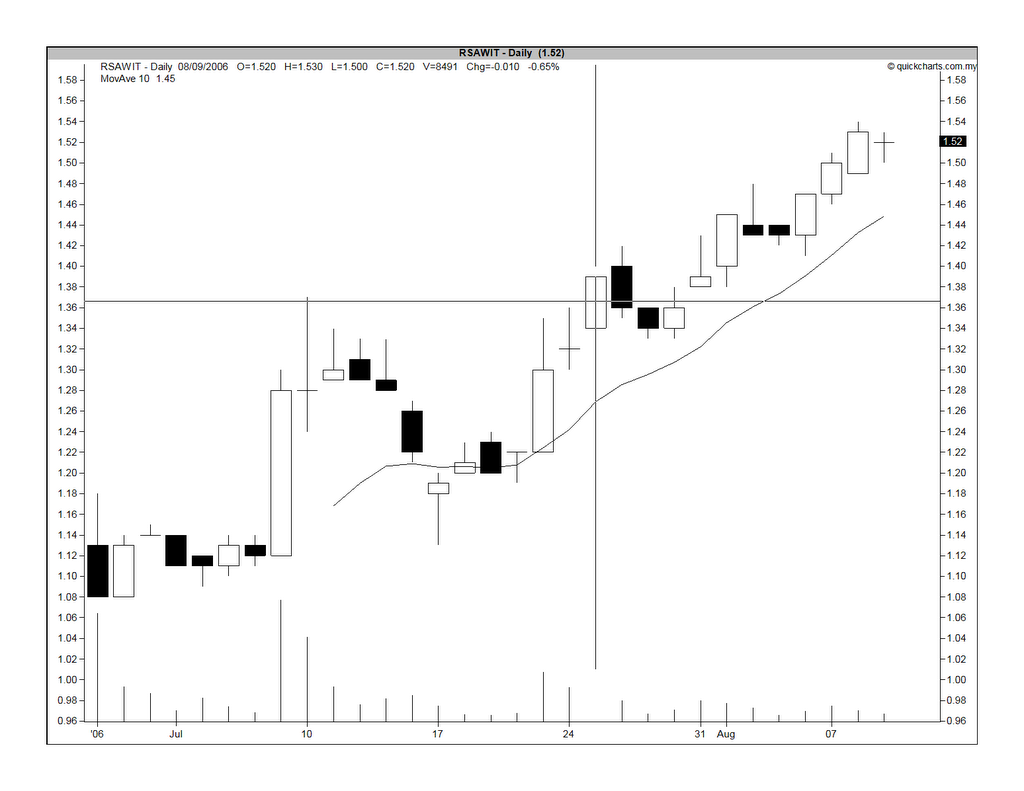
On July 25, I have recommended a trading buy for Rimbunan Sawit after it managed to surpass its recent high of RM1.37 (see Chart 1 below). Since then, Rimbunan Sawit has been inching up slowly. Today, it closed at RM1.54.

Another recently-listed plantation counter that you can look at is TH Plantations Bhd ("THPlant"), which is affiliated to Tabung Haji. THPlant, which has a IPO price of RM1.25, was listed in early May. The stock made a high of RM2.07 on May 8 and today, the share managed to touch that high before retreating to close at RM2.05. I believe that THPlant will soon re-test & surpass this RM2.07 high & then, continue to go higher (see Chart 2 below). Given the current strong play in the plantation sector, I feel that the stock may only pull-back a bit to RM1.98-2.00 level before going again. Then again, it may not pull-back at all. You may choose to buy on a pull-back or on breakout above RM2.07. In any event, it is quite "tradable".


Chart 1: R Sawit's daily chart as at August 9


Chart 1: R Sawit's daily chart as at August 9

Timber stocks are moving up

Timber stocks have been moving upward strongly for the past few weeks. The companies that are likely to do well are those with their own concession areas because demand for logs had picked up strongly and those without concession of their own, would find it hard to get supply for their downstream operation. When you talk about timber stocks, you would be talking about the Sarawak-based companies such as Subur Tiasa, Jaya Tiasa, Ta Ann, WTK & Lingui.

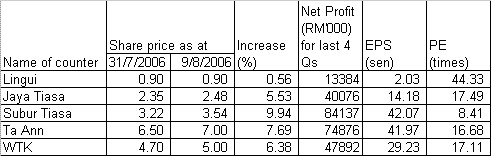
Based on the table below, the stock with the lowest PE is Subur Tiasa (PE of 8.4X) and the one with the highest PE is Lingui (PE of 44X). The reason for Lingui's poor performance vis-a-vis its peer is because it has a planted timber concession in New Zealand which is only beginning to be harvested. This dragged down its net profit but as the trees are now being harvested, its performance may surprise on the upside.

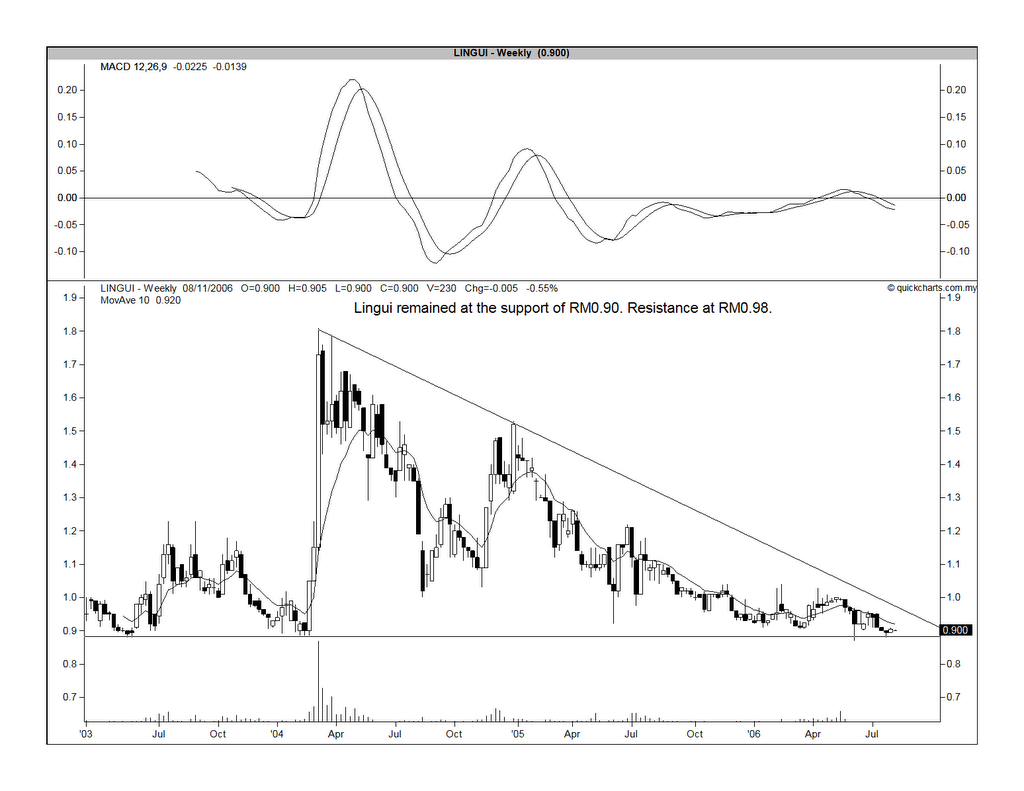
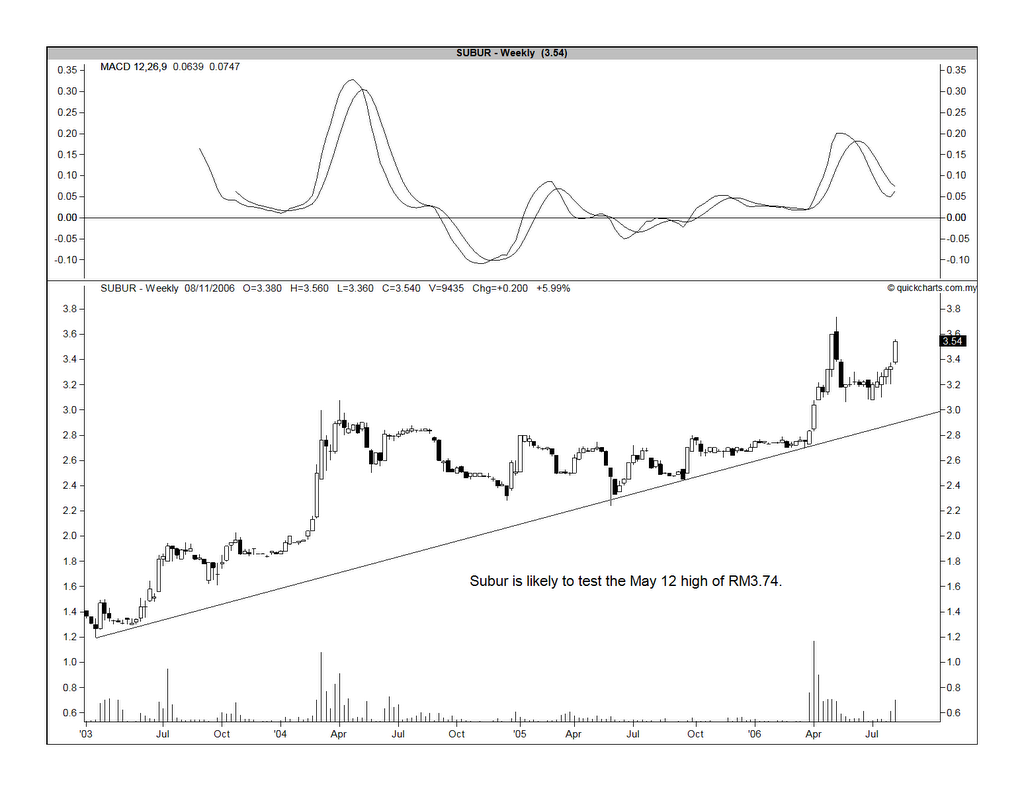
Based on PE consideration, you may want to look at Subur Tiasa. Based on lagged share price performance, Lingui may be a good choice.


Chart 1: Lingui's weekly chart as at August 9


Chart 2: WTK's weekly chart as at August 9


Chart 3: Ta Ann's weekly chart as at August 9


Chart 4: JTiasa's weekly chart as at August 9


Chart 5: Subur's weekly chart as at August 9

Wednesday, August 09, 2006

APM broke RM2.20 support, now testing RM2.00 support

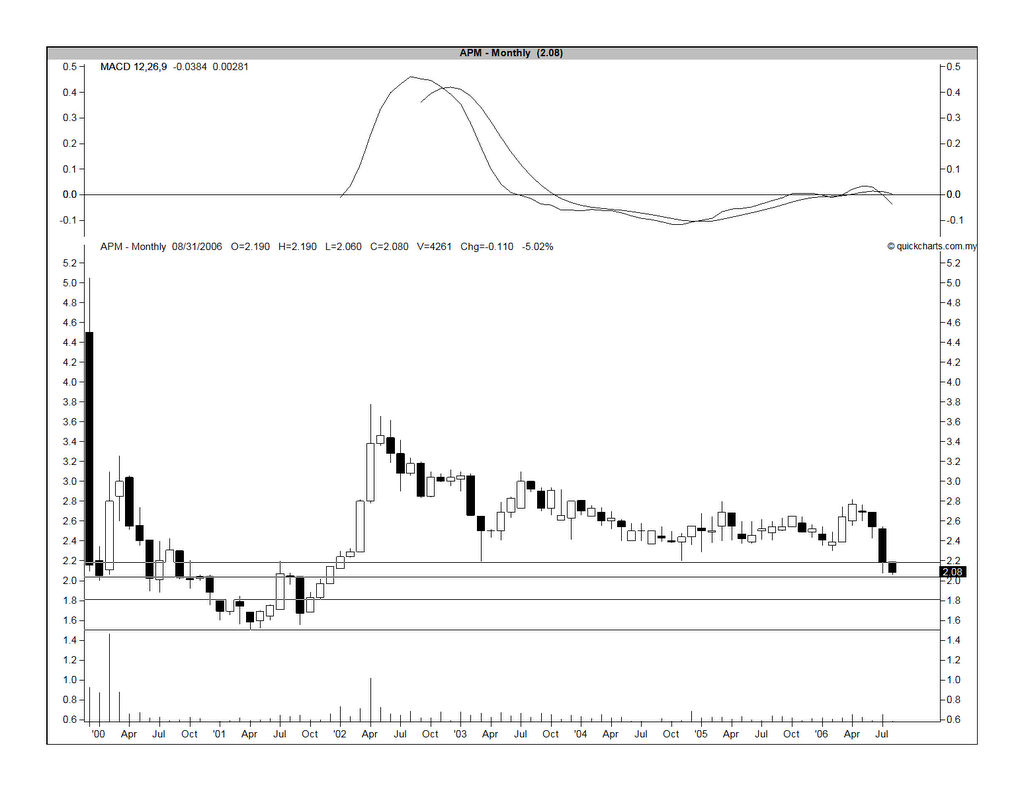
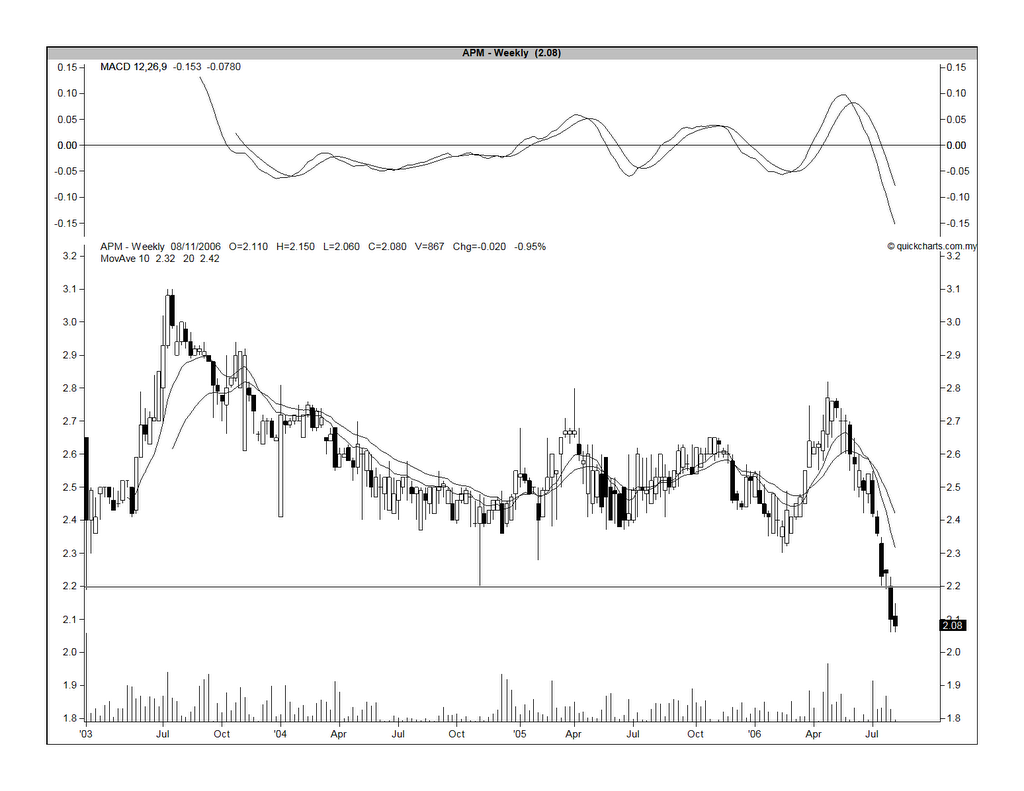
On July 27, I have written about APM coming to a strong horizontal support of RM2.20 and that it might be a good BUY. Unfortunately, APM failed to hold at the RM2.20 level. It has dropped to a low of RM2.00 at 3.00 p.m. today. Looking at the charts below, we can see that the next supports are at RM2.00, RM1.80 and RM1.50.

The decline in APM share price is a reflection of the poor performance of the auto sector in the past few months. For instance, we have a piece of news today in the Edge Daily about Nissan/Edaran Tan Chong Motor Sdn Bhd ("Nissan/ECTM") reporting an 18%-drop in vehicles sales in the second quarter of 2006 (2Q06) to 5,496 units from 6,705 units a year ago due to the instability of used-car prices, more stringent car loan requirements by finance companies, and escalating cost of car ownership. Nissan/ECTM is related to APM. Despite the depressed conditions in the auto sector, a solid company such as APM should be able to survive and, even, prosper. The earlier BUY call, which was based on technical consideration, is however cancelled until clearer signs that the stock has bottomed.


Chart 1: APM's monthly chart as at August 8


Chart 2: APM's weekly chart as at August 8

Fed stops rate hike

The conventional wisdom has it that when the Federal Reserves finally stops its rate hike, the share market will rally. Well, the reality is quite different. In a re-post entitled "Fed Pause Good For Stocks?", the Tinker Sense observed that "...that in the period spanning the Fed's last rate hike to its first cut (average span of six months), the market has an average decline of nearly 7%, and has only risen during two of the nine periods. In the chart below, we created a composite chart of the S&P 500's performance during the 'limbo' period of Fed tightening cycles." See Chart 1 below.


Chart 1: Average S&P 500 Performance from Last Hike of a Tightening Cycle to First Cut in Rates: 1962-2006

Why is that so? In a piece entitled "Betting on Bernanke: Rate Hikes and Reality" in The Stock Advisors, John Bollinger explained that "...both the Fed and the equity markets are forward looking and if the Fed thinks it has strangled the economy sufficiently, the market is not one to argue. A quick check shows that the Fed typically stops raising rates well before the bottom is put in."

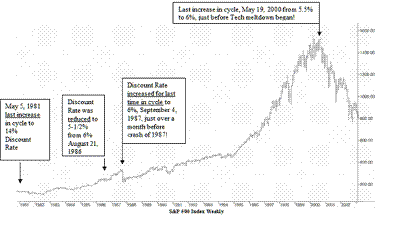
In the same article, John Sheperd cautioned that "...the last increase in a rate cycle is not the time to buy stocks, at least in three of the most dramatic examples in the last twenty-plus years." He has also presented a chart which shows how the market had reacted to a stop in the Fed rate hike in the past 20 years (see Chart 2 below).


Chart 2: S&P 500 from 1981-2003

Tuesday, August 08, 2006

Landmark- The rival removed his gloves?

In the Business Times today, you will find an article entitled "Syed Yusof may reveal bid for Landmarks". As I've said yesterday, Syed Yusof cannot maintain his silence for too long as the proposed private placement could seriously jeopardise his chances of gaining control of Landmark. He needs to come out & stop the proposed private placement. What would be the basis of his objection? Being a shareholder, he has a strong ground to protest a private placement at a big discount of 10% below the market price. However, that will not be enough. He must also protest that the existing shareholders' interest in the company will be diluted by the proposed private placement. Otherwise, the incumbent management can turn around and say "OK, we will do the placement at market price." What then? Well, it is only going to get more interesting over the few days & weeks.

With this latest development, our hope of gaining entry into Landmark at RM1.50/1.52 will likely be dashed. At the end of this morning session, Landmark share price was up 7 sen to close at RM1.69.