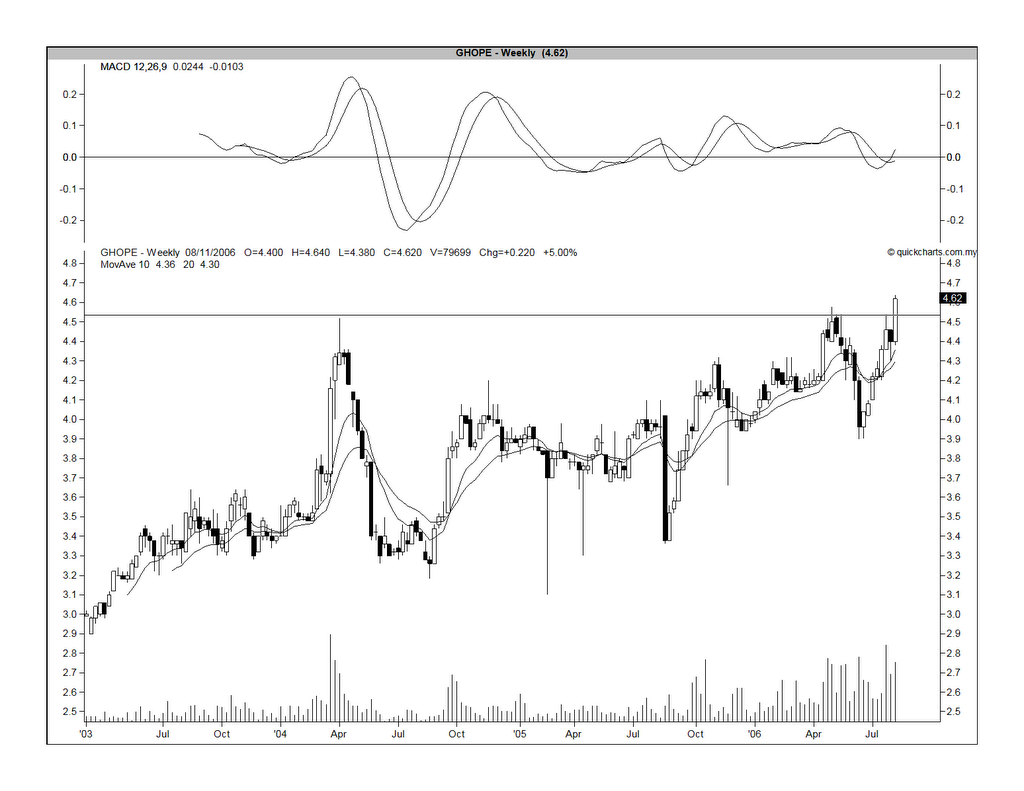
Chart 1: Ghope's weekly chart as at August 10
The monthly chart shows that GHope has actually broken above its long-term downtrend line in January 2004 at the RM3.60 level (see Chart 2 below). With the breaking of the strong horizontal resistance at RM4.54, the stock is likely to go higher.

Chart 2: Ghope's monthly chart as at August 10
No comments:
Post a Comment