
Recently, APM has broken below its strong horizontal support of RM2.20 (see Chart 1 below). It has dropped to a low of RM1.92 before recovering to stay above the RM2.00 mark. A bottoming process has begun & an ascending triangle can be seen. A break above RM2.02/2.03 could lead to further recovery in the share price in the short-term (see Chart 2 below).

Chart 1: APM's monthly chart as at August 17
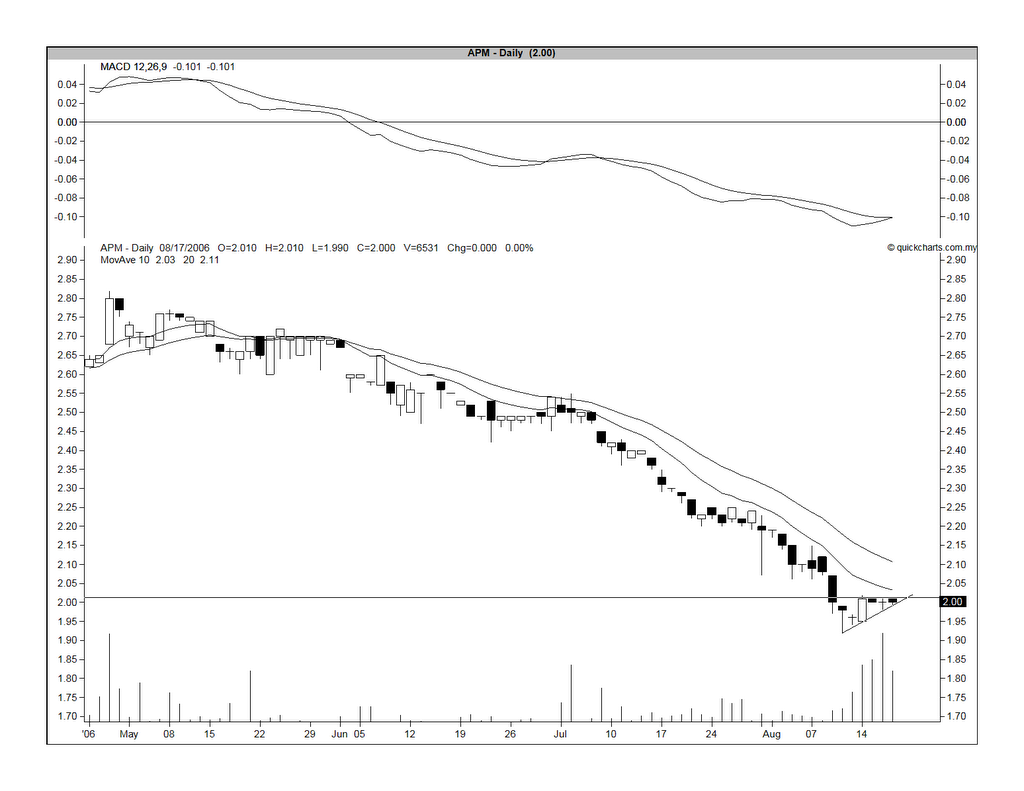
Chart 2: APM's daily chart as at August 17
No comments:
Post a Comment