Thursday, November 09, 2006

Proton up on unconfirmed report of Govt's sale of its manufacturing ops

The government is believed to have agreed to give foreign parties 51% control in the manufacturing operations of Proton. The potential partner is likely to be Volkswagen AG of Germany.

The sale of the controlling stake in the manufacturing operations may be based on a similar model currently in place between the second national carmaker, Perodua & its principal, Daihatsu Motor Co Ltd of Japan. Under this arrangement, the domestic distribution arm will remain in Proton's domain but the manufacturing operations will be managed by the forien party.

This unconfirmed report may be the catalyst that drove the share price of Proton up 54 sen to RM5.20 yesterday. At 11.00 a.m. this morning, Proton's share price has gained another 40 sen to RM5.60.

Assuming that this report is credible, two things must be noted. First of all, the sale is not a sale of 51%-stake in Proton itself but its manufacturing operations. So, there will be no MGO for Proton's minority shareholders. Secondly, the sale of this stake will definitely lead to greater utilization of the currently under-utilized Proton's manufacturing capacity & this will quickly lead to an improvement in Proton's bottomline. In the near future, other benefits will flow in such as the sharing of technical expertise, the development of new models on same platforms etc. So, this is a positive development but it may not be as good as what some people had hoped for. We are not going in the direction of Volkswagen's taking over the driving seat in Proton like what has happened in Seat or Skoda.

For details of Proton's deteriorating financial performance, see the table below.
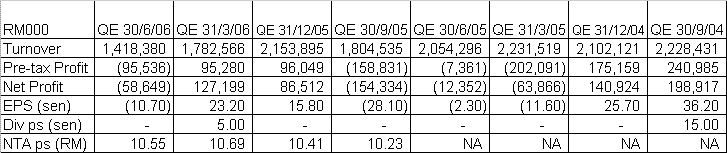


Proton's share price has broken above its downtrend line in September. Despite the breakout, the price did not move up. Instead, it was drifting down to do a 'Test-of-the-Low' i.e. to test its low of RM4.50 in August. Yesterday's sharp rise has put the share price at the resistance of RM5.20. This morning, the share price has gained another 40 sen & thereby breaking above the RM5.20 resistance (as well as another resistance at RM5.50). Proton's next resistances will be at RM6.10 & RM7.00. See the weekly chart below.


Chart: Proton's weekly chart as at Nov 8

Conclusion

After a sharp 2-day rise, I believe that Proton is likely to take a breather. If the share price were to drift back to the RM5.20 level, I believe that could be a good entry to this stock.

MBSB- Suitors for EPF's stake

In the Star newspaper this morning, we have a story that suitors are knocking on EPF's door to buy over its stake in MBSB. You can see from the table below that MBSB is a medium-size niche financial services company which makes a decent net profit totaling RM43 mil for the past 4 quarters on the back of a turnover of RM265 mil. Full year EPS is about 12.7 sen while its NTA per share is RM1.15. At yesterday's closing price of RM0.97, MBSB is trading at a PE of 7.6 times or 0.84 times its book value.


Possible valuation

One way of valuing MBSB is by the book value method, which is often used in the valuation of bank acquisition in Malaysia. A recent example is CIMB's acquisition of SBB at 2-time the latter book value. Of course, we cannot use a high multiple of 2 times for MBSB due to its niche operation and run-of-the-mill brand recognition, but a value of say 1.2 times could be justifiable. At that multiple, MBSB may be worth about RM1.38. This would translate into a company trading at a PE of 10.9 times, which is fairly reasonable.

Technical Outlook

From the monthly chart (Chart 1), we can see that MBSB was at the strong resistance of RM1.00 yesterday. A break above this RM1.00 level could see MBSB testing its next resistance of RM1.40 and, thereafter, RM1.90. A clearer picture is given by the weekly & daily charts (Chart 2 & 3). From Chart 2, we can see that MBSB has a medium-term uptrend line support at RM0.65 while its strong horizontal support is RM0.60 (see Chart 2). But the immediate horizontal support will be at RM0.82, if this current sharp run were to fizzle out (see Chart 3).


Chart 1: MBSB's monthly chart as at Nov 8


Chart 2: MBSB's weekly chart as at Nov 8


Chart 3: MBSB's daily chart as at Nov 8

Conclusion

MBSB could be in for an interesting time. If it can break above RM1.00 convincingly, you may want to trade it on the way up to RM1.40. If the current speculation leads to nothing and the prices were to retreat back to much lower level, you may want to enter this stock at the safer level of RM0.60-0.70. Finally, we can take comfort in knowing that the stock is not expensive based fundamental valuation.

Wednesday, November 08, 2006

CI- Is it safe to go in?

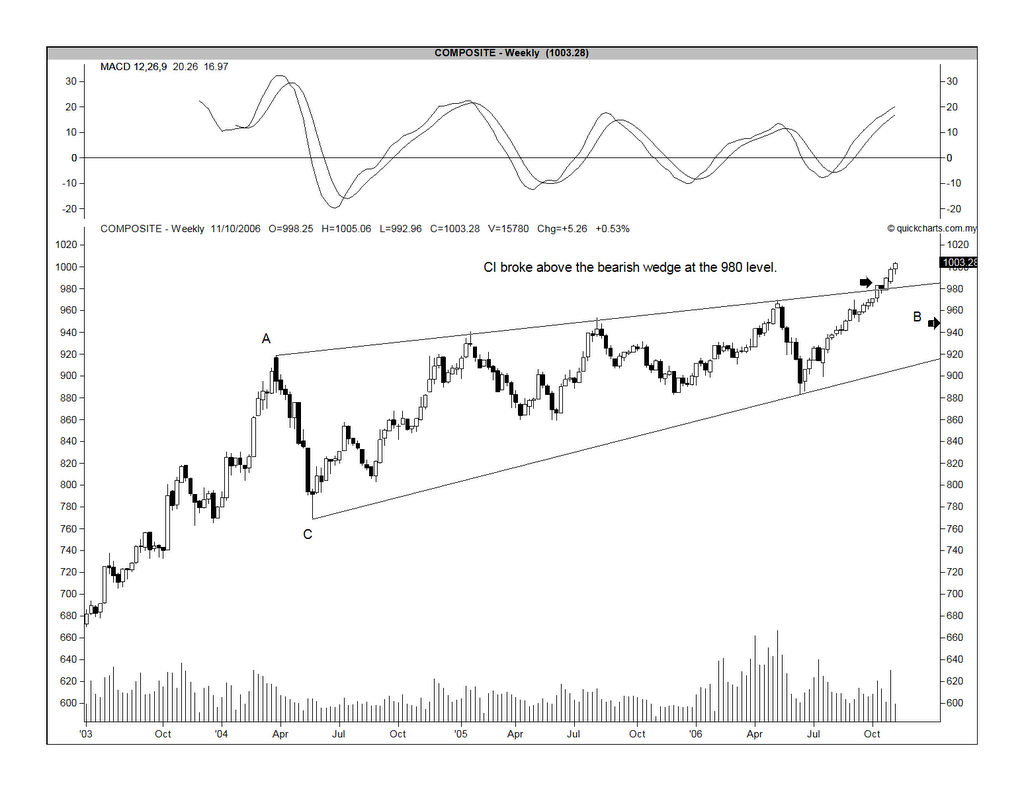
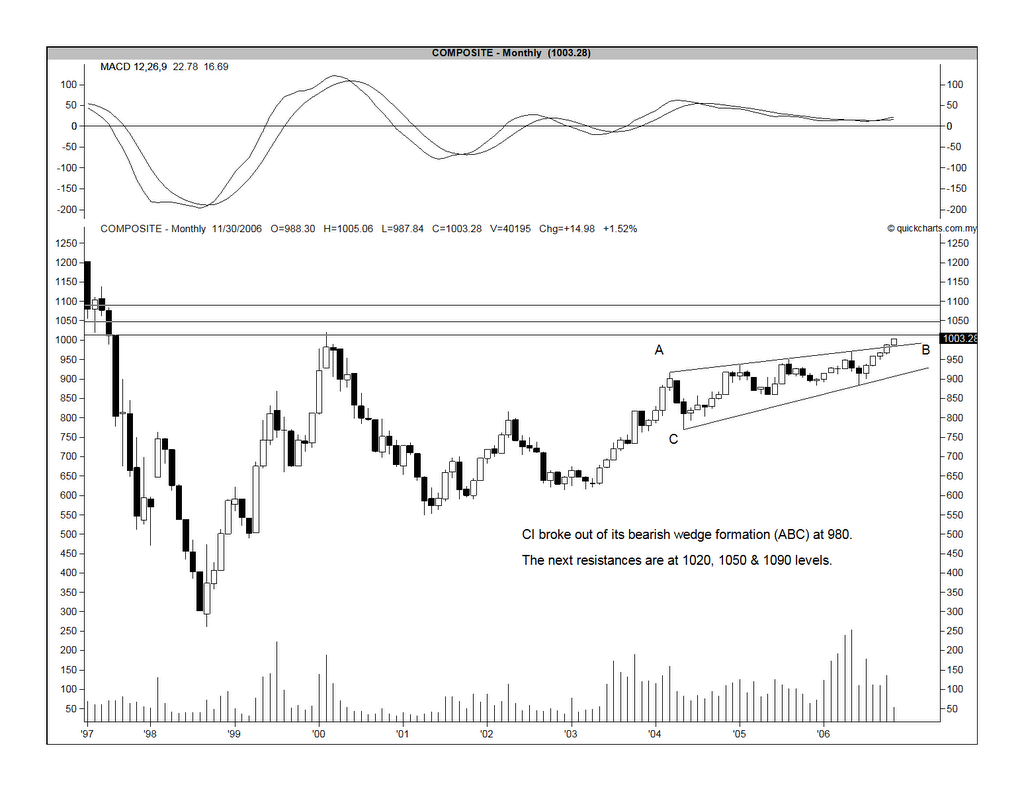
I've written in the past few weeks that the critical test of which direction the market will take is determine by whether the CI can surpass the 980 level. That level represents the upper boundary of a very big bearish wedge that has lasted 3 years. A break above the 980 level would turn this wedge into a continuation pattern to the prior trend, which is an uptrend.

The 1000 level is an important psychological level & since it lies 20 points above the 980 level, the 1000-mark looks like a target to shoot for. Can a market, which has been consolidating for 3 years, make a breakout & be happy with a 20-point or 2% gain? The answer is obviously NO.

What you are likely to see over the next few days, or even weeks, will be a close fight. At every break below the 1000-mark, the bears will stamp their feet & cheer. Fresh selling will pile in. Watch how the selling & buying will be carried out. At every recovery above the 1000-mark, the bulls will stamp their feet & cheer. The buying will come in. Again, watch how the buying & selling will be carried out. It is good that the market is fixated with the 1000-mark. But, we must bear in mind that the 1000-mark is a forward defensive line. A break of the 1000-mark is not the end of this nascent rally. We still have the 980 level to fall back on.

From the above commentary, you may say I’m bullish about the market. I would not disagree with that observation.


Chart 1: CI's weekly chart as at Nov 7

Comment: The CI has clearly broken above the wedge at the 980 level.


Chart 2: CI's monthly chart as at Nov 7

Comment: The CI's next resistances are at 1020, 1050 & 1090 level.

Mieco- Are you about to break free?

Background

I have a post on Mieco in September. Since then, the share price has recovered from the low of RM0.93 to prices ranging from RM1.10 to RM1.20. But, compared to Heveaboard & Evergreen, the price movement of Mieco is much slower.

To recap, Mieco is involved in the manufacturing of chipboards while Heveaboard & Evergreen are involved in the manufacturing of medium density fibreboards & particleboards, respectively. All three companies were badly affected by intense competition in 2005 due a glut in this sector. However, the worst could be behind them, as their product prices have recovered due to sharp rise in the prices of plywood. These products are viewed as near substitutes for one another.

3 Charts compared

On October 5, I have recommended a BUY on Evergreen as the stock has broken above its medium-term downtrend at the RM0.90 level. Since that breakout, Evergreen has risen to a high of RM1.28. See Chart 1 below.


Chart 1: Evergreeen's weekly chart as at Nov 7

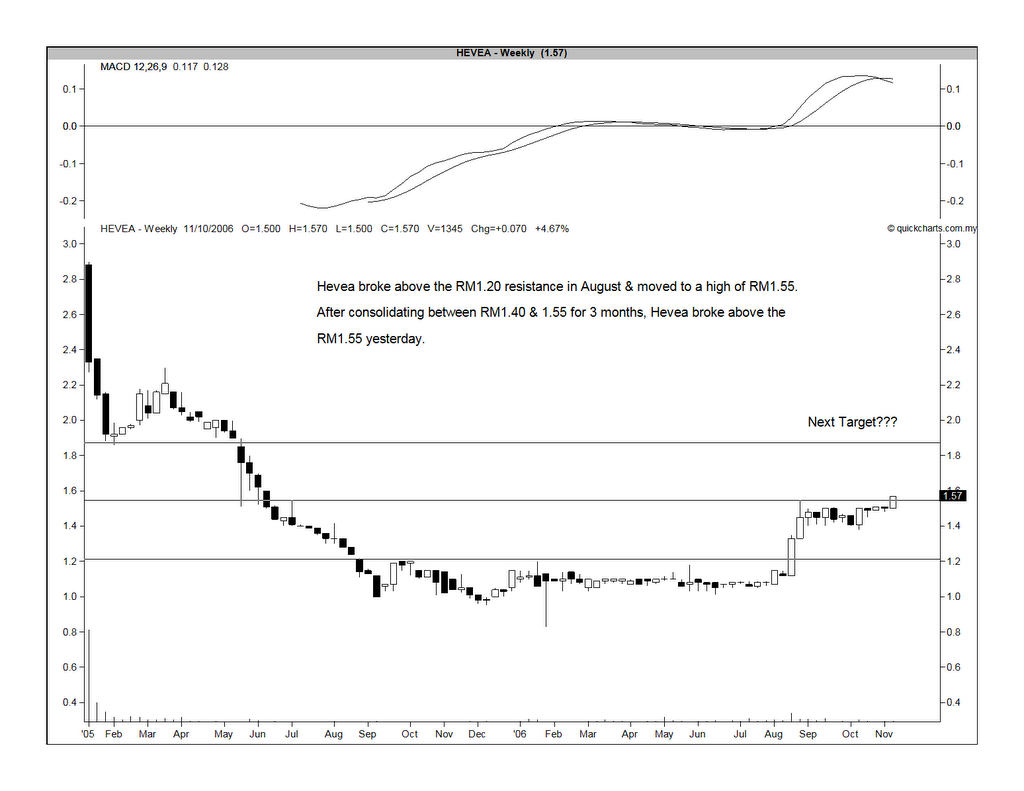
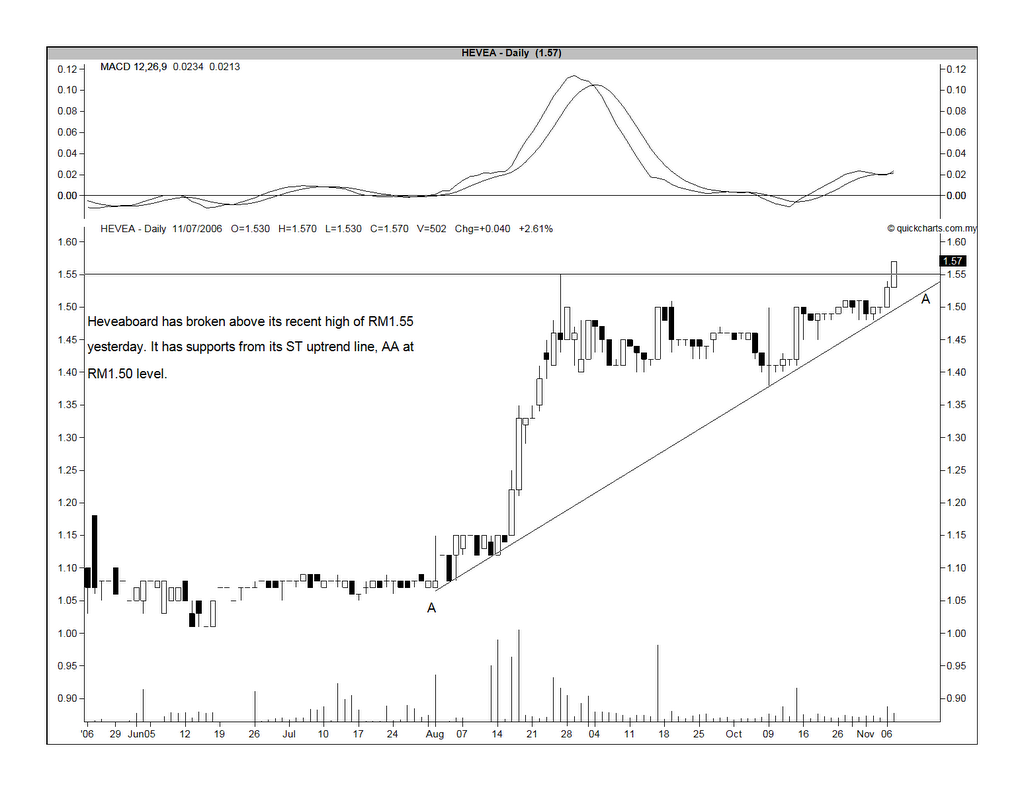
I've missed Heveaboard's bullish breakout of its trading range at the RM1.20 level in August. After that breakout, the stock shot to RM1.55 & therafter it consolidated between RM1.40 & 1.50 for the past 3 months. Yesterday, it broke above the RM1.55 level with thin volume. This could be the beginning of the next leg up for the stock, subject to confirmation. See Chart 2 & 3 below.


Chart 2: Heveaboard's weekly chart as at Nov 7


Chart 3: Heveaboard's daily chart as at Nov 7

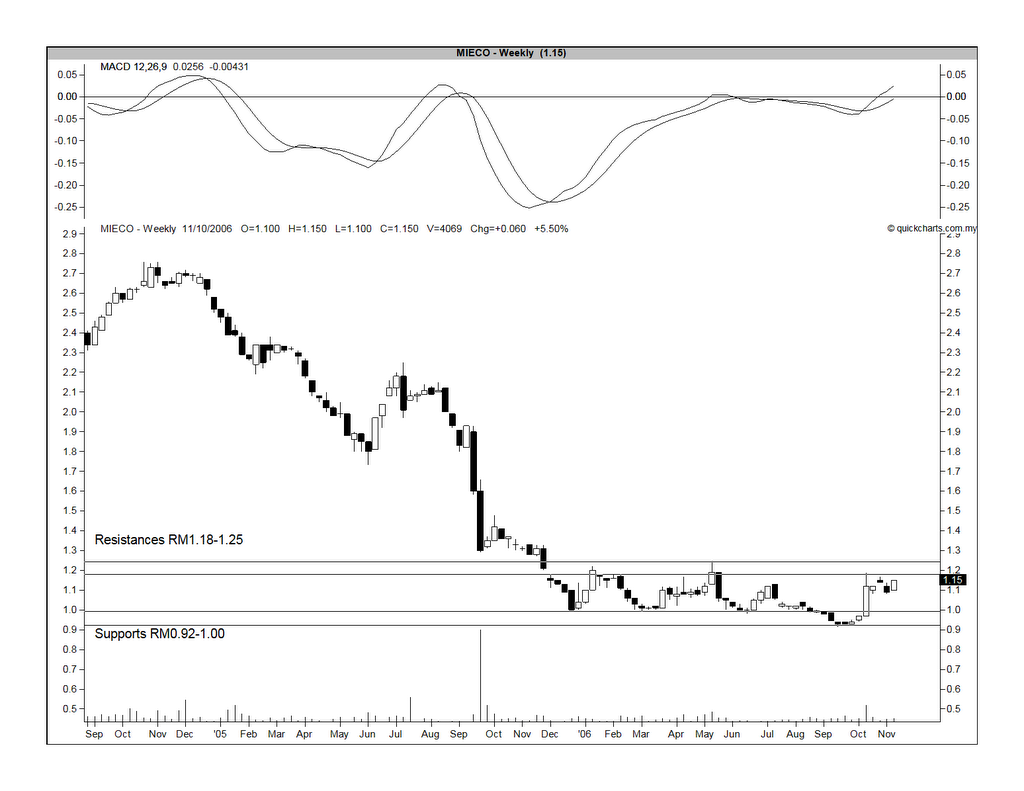
Finally, we come to Mieco. This stock is trapped in a trading range between RM1.00 & 1.20. A break above RM1.20 (or, RM1.25, if you're really stringent) could be the beginning of the bullish phase for Mieco. See Chart 4 Below.


Chart 4: Mieco's weekly chart as at Nov 7

Conclusion

Mieco looks like a good medium-term investment though what's lacking is a bullish breakout. For that, we have Heveaboard. The latter has just broken out of its trading range at the RM1.55 level. Again, we have to be careful as Heveaboard's breakout was not accompanied by big volume. As for Evergreen, the share price may consolidate for a while after its recent sharp rise.

Titan's net profit jumped in QE30/9/2006

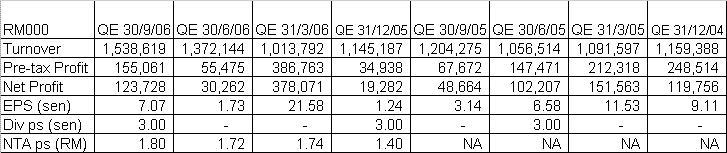
I've posted yesterday that Titan's technical outlook appears good as it has just broken above its medium-term downtrend line at the RM1.25 level about 3 or 4 days. After the market close, Titan has announced its results for 3Q2006 (i.e. for QE30/9/2006). It was a very good quarter for Titan, which show its net profit jumped 154% y-o-y or 309% q-o-q to RM123.7 mil. Its turnover has also improved by 12% q-o-q or 28% y-o-y to RM1.54 billion. EPS has improved to 7 sen. See the table below.


With this set of numbers, I believe there is very good chance that the share will surpass the strong resistance of RM1.30/32 today.

Tuesday, November 07, 2006

Titan has broken above its downtrend

Titan is involved in the manufacture and sales of petrochemicals products and polyolefin resins. Its latest financial results i.e. 2Q2006 (for QE30/6/2006) shows a 70.4%-drop in its net profit to RM30.3 mil, despite a 29.9%-increase in its turover to RM1.37 billion. For the first half results, its net profit increased by 63.8% to RM408.3 mil while turnover grew by 11.0% to RM2.39 billion.

What's interesting is that Titan has broken above its medium-term downtrend line at RM1.25 level last week. It is testing the immediate horizontal resistance at RM1.30/32 level now. At 3.30 p.m. today, the share was trading at RM1.31. If it can convincingly cross the RM1.30/32 level, Titan's up leg maybe on the way. See the weekly chart below.

Choo Bee has a bullish breakout

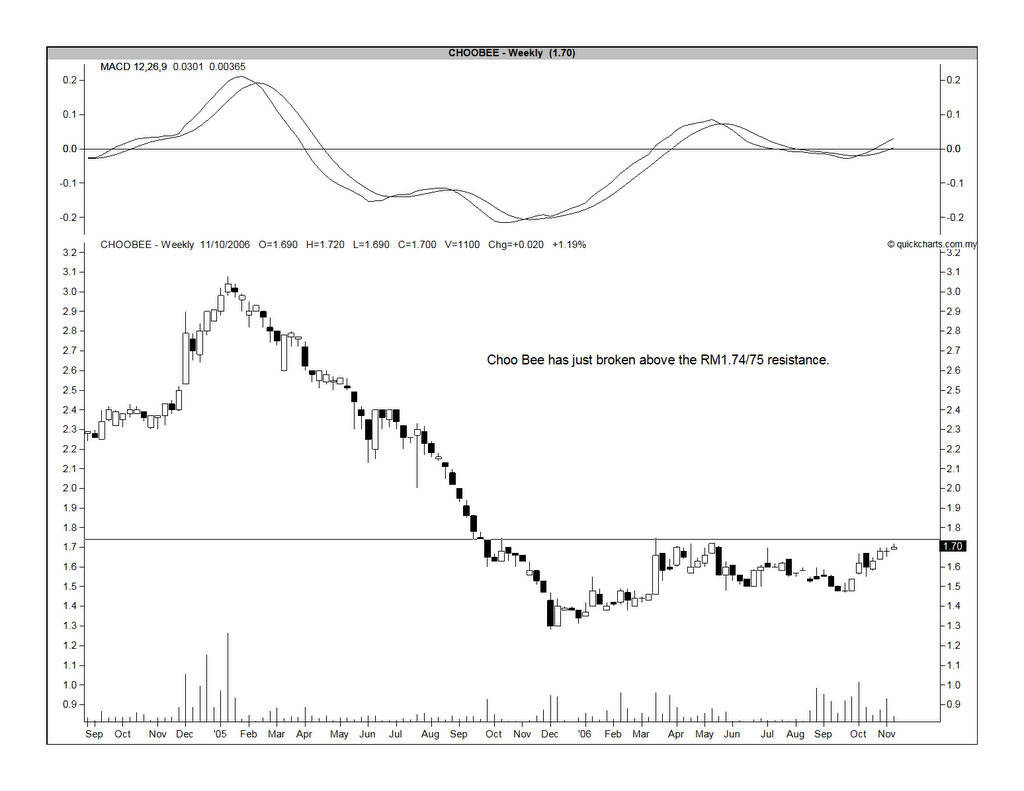
As noted in my post on October 27, Choo Bee's breakout level is at RM1.74. This morning, the share price has surpassed this level. At 10.00 a.m., Choo Bee is at RM1.76 & the volume traded is at 73,900 units. The latter is a bit low at this point. I hope that the volume will increase sharply as the day progresses. You would notice that the volume built-up over the past 2 or 3 months has been fairly good.


Chart: Choo Bee's weekly chart as at Nov 6

Bursa has just surpassed its strong resistance of RM6.20

With the recent announcement of a better set of results for QE30/9/2006 & a 28-sen dividend, Bursa has been receiving steady buying interest. This morning, the share price has rallied strongly & surpassed the strong horizontal resistance of RM6.20. With the ex-dividend date fixed on Nov 15 (i.e. 5 trading days away), I believe that the share price is likely to inch up toward the RM6.70/75 level. Bursa may be a good trading stock if the share price were to weaken to the RM6.25/30 level again. See the daily chart below.


In QE30/9/2006, Bursa's net profit has increased 28.1% y-o-y to RM25.1 mil on the back of a 6.0%-increase in its turnover to RM68.1 mil. EPS for the 9-month ending 30/9/2006 is 15.4 sen, thereby giving an annualized EPS of 20.5 sen. Based on this EPS & currrent trading price of RM6.30, Bursa is trading at a PE of 30.7 times. That's a fairly high PE multiple, by any mean.

Monday, November 06, 2006

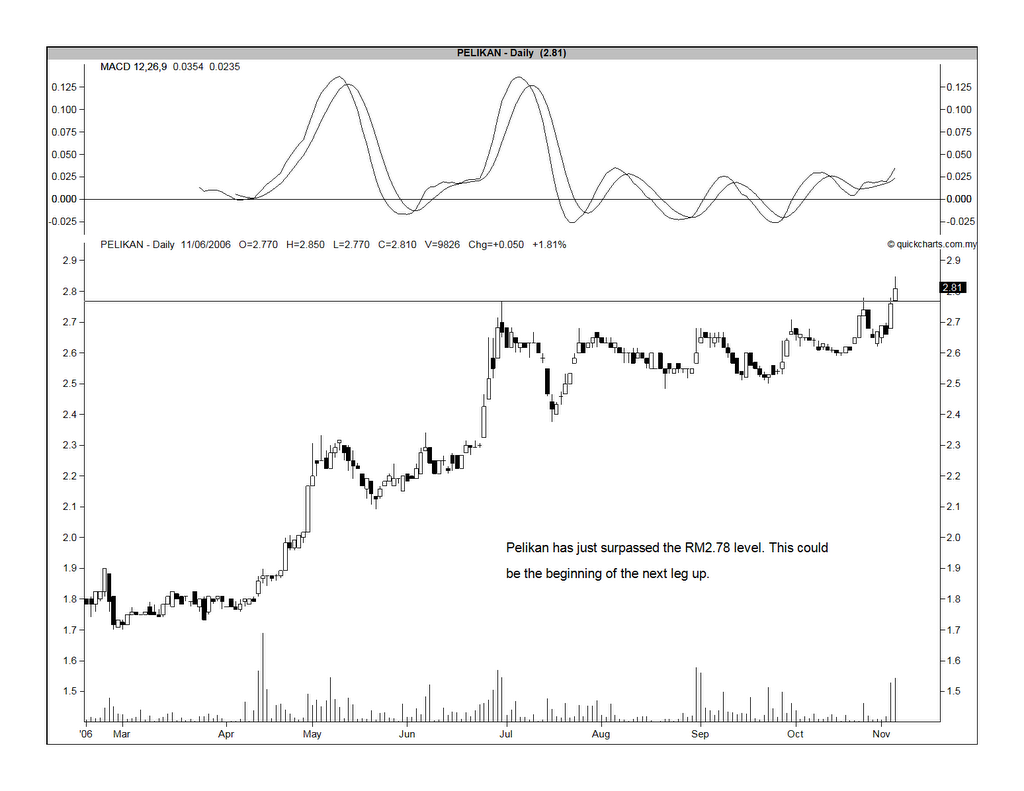
Pelikan has a bullish breakout at RM2.78/80

Background

Pelikan is involved in the manufacturing & distribution of writing instruments, art, painting & hobby products, office stationeries & printing consumables. Prior to April 2005, Pelikan (formerly, Diperdana) was involved in the provision of logistics & related services. This business was sold off to Konsortium Logistik Bhd.

Recent Financial Performance

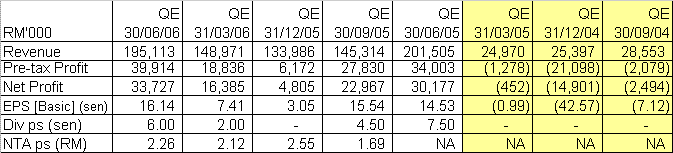
Pelikan’s net profit for QE30/6/2006 has doubled to RM33.7 mil from RM16.4 mil achieved in the preceding quarter i.e. QE31/3/2006. Turnover has increased by 31% during the same periods. The better performance was mainly attributable to the higher sales recorded in the current quarter and operational efficiency due to higher sales volume. The latter was resulted from the “back to school” season in Europe and Latin America.

When compared to the previous corresponding quarter, net profit has increased by 12% while turnover has declined marginally by 3%. For more details, see the table below.


(Note: The changeover of business operations i.e. from the previous logistics operation to the current manufacturing opeartion is clearly demarcated in the table above. The yellow portion is for the previous loss-making operation.)

Valuation

Based on the past 4 quarters' basic EPS of 35.1 sen (amended to reflect the 1:5 Bonus completed in September) and the trading price of RM2.95 as at 10.30 a.m. today, Pelikan is now trading at a PE of 8.4 times. Pelikan's diluted EPS for the same 4 quarters is 24.2 sen, and this means that Pelikan's PE is 12.2 times (based on diluted EPS).

Technical Outlook

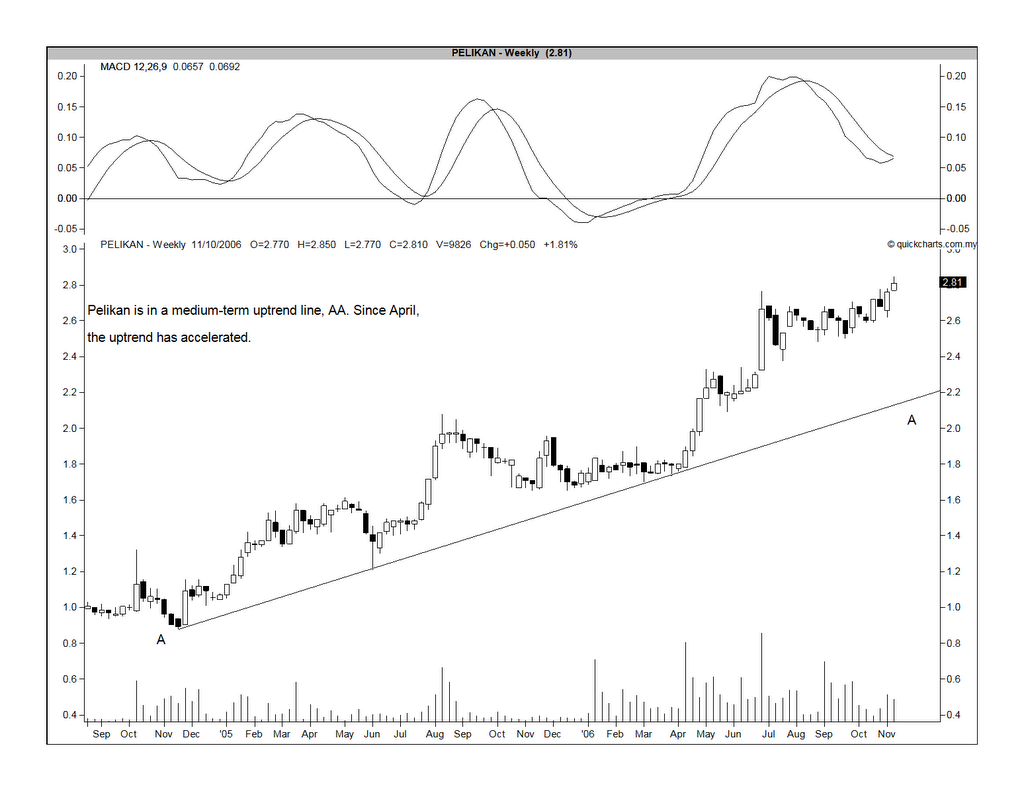
Pelikan has broken above its resistance of RM2.78/80 yesterday. This could be the beginning of the next leg up for this stock. See the charts below.


Chart 1: Pelikan's daily chart as at Nov 6


Chart 2: Pelikan's weekly chart as at Nov 6


Conclusion

Based on attractive technical set-up & reasonable fundamentals, I believe Pelikan is a good stock for a medium-term investment (or, even a trade).

MAS- Idris Jala must be doing something right

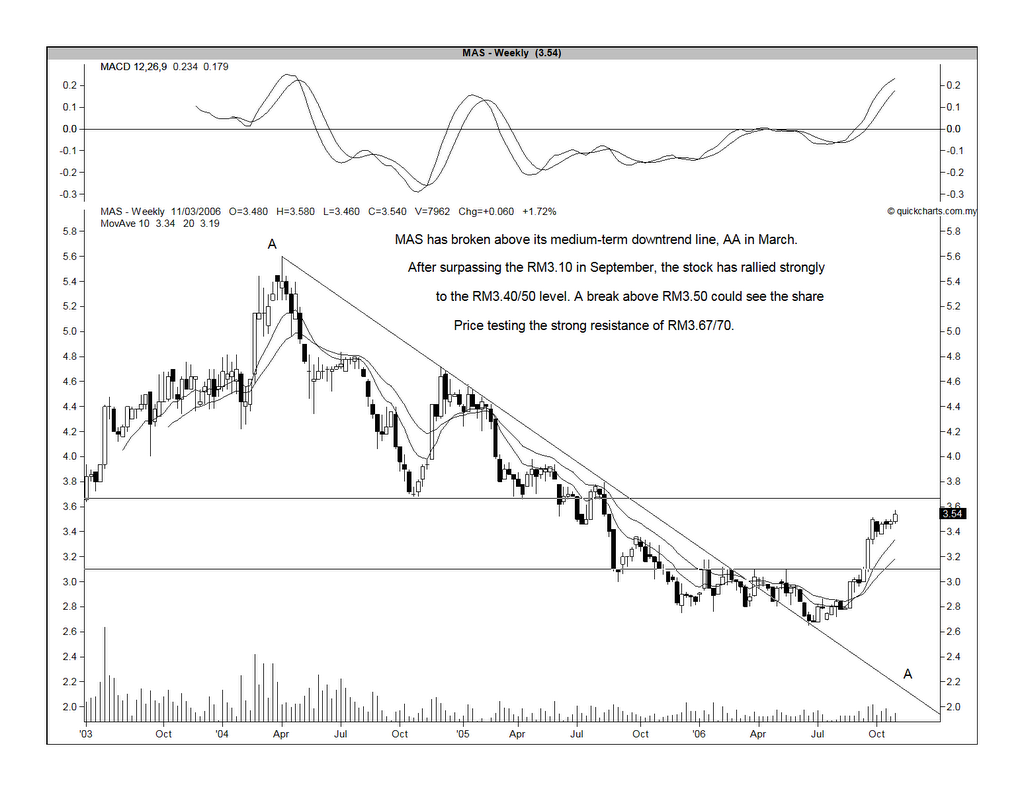
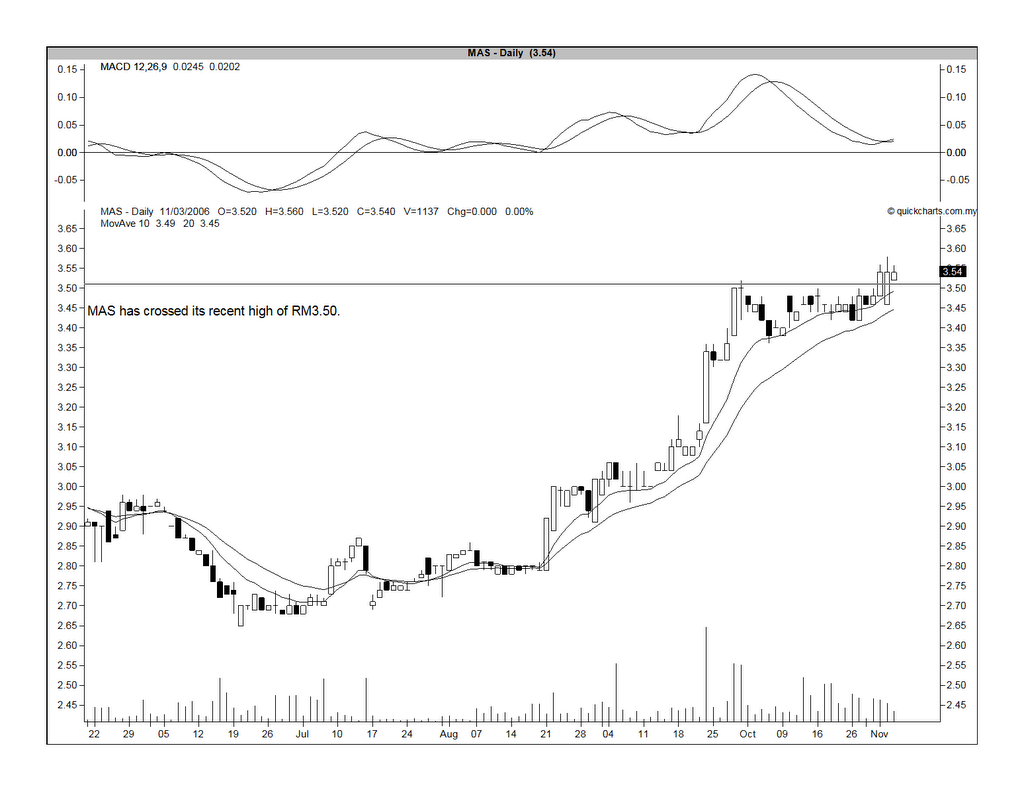
MAS' share price performance has been pretty good in the past 3 or 4 months. From Chart 1 below, we can see that MAS' share price was bottoming between RM2.70 & RM3.10 for about 6 months after breaking above its medium-term downtrend line in March. In September, MAS broke above RM3.10 & moved to a high of RM3.50. Since then, its has been consolidating between RM3.40 & RM3.50. 3 days ago, MAS broke above RM3.50, probably the beginning of the next leg up (see Chart 2).


Chart 1: MAS' weekly chart as at Nov 3


Chart 2: MAS' daily chart as at Nov 3

From the share price movement, it appears that MAS is beginning to win back investors' confidence. Idris Jala (MAS' CEO) must be doing something right.

Covered Warrants Update as at Nov 3

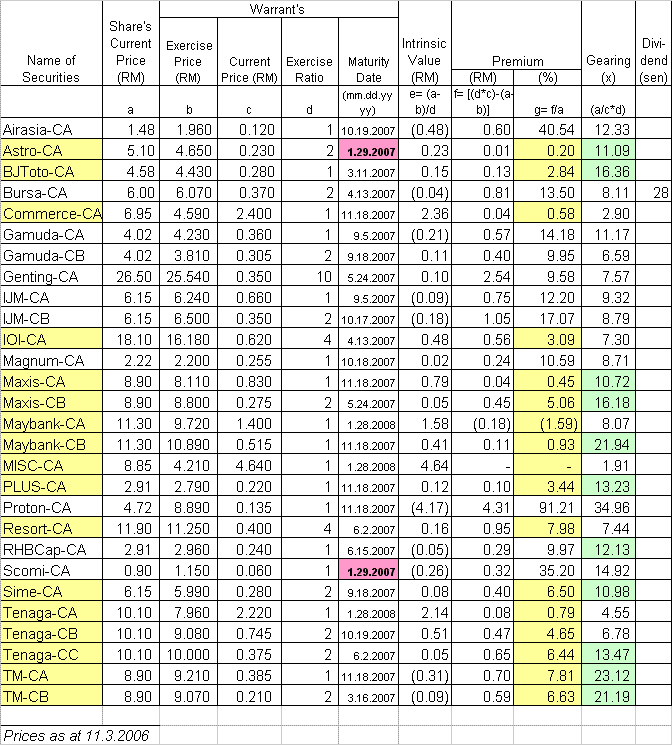
I've posted below the updated list of Covered Warrants based on prices as at November 3. Those warrants with low premium has been highlighted in yellow and, amongst them, those with high gearing, their gearing multiples are highlighted in green. Two warrants i.e. Astro-CA & Scomi-CA have less than 3 months to expiry. Their expiry dates are highlighted in pink.

Airasia may re-test the RM1.40 level.

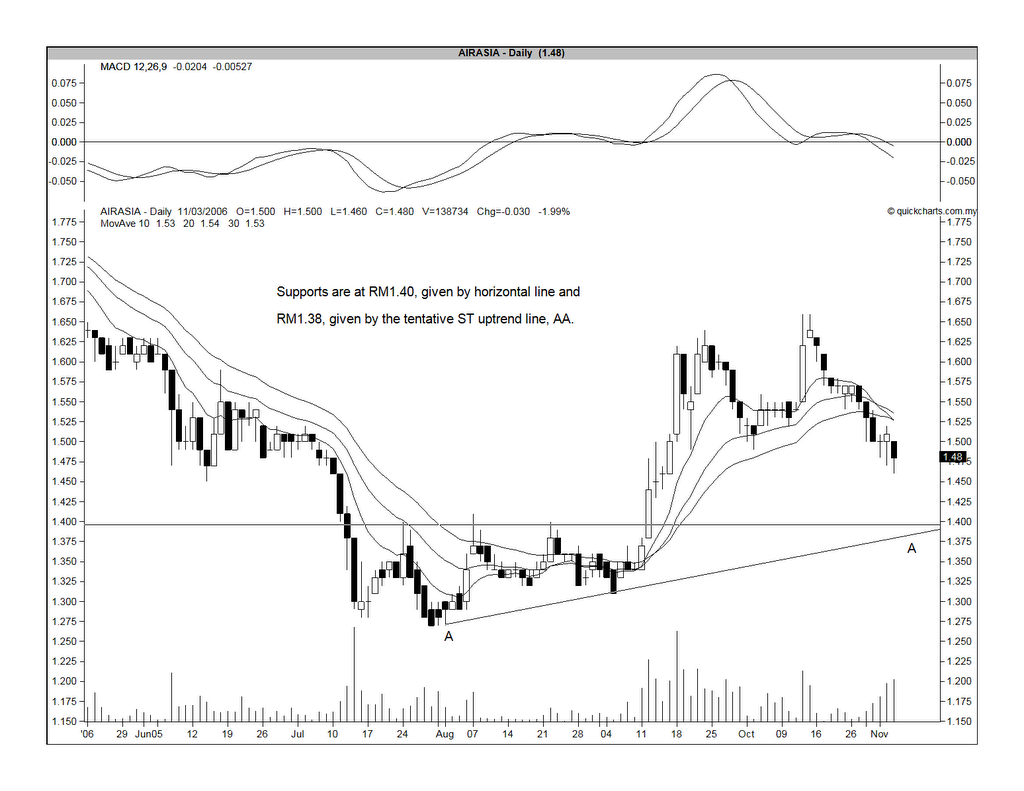
After a sharp run-up in its share price to a high of RM1.66 on October 12 & 13, Airasia is now undergoing some correction. It may drop back to find support at the RM1.40 horizontal line or the tentative uptrend line support at RM1.38 (& rising). This support area may be a good entry to this stock. See the chart below.
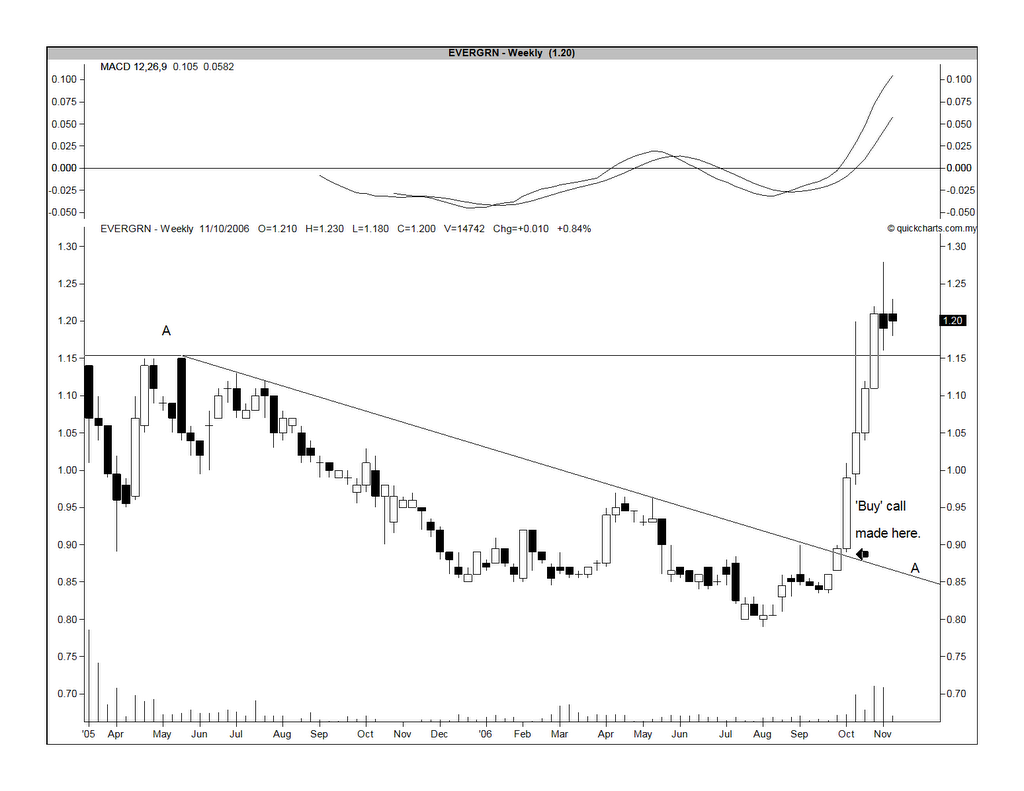


Chart: Airasia's daily chart as at Nov 3

Friday, November 03, 2006

Hume entering a bullish phase

Background

Hume Industries (M) Bhd is involved in the manufacturing and sale of concrete products, pre-cast pipes, fibre-cement products & concrete roofing tiles as well as medium density fibreboard.

Recent Financial Results

Hume’s net profit for the QE30/6/06 increased by more than 2 folds to RM12.5 mil from RM3.7 mil recorded in the preceding quarter, while its turnover for the same periods has increased by 10.6% from RM135.8 mil to RM150.2 mil. When compared to the previous corresponding quarter, its net profit is lower by 38.8% while turnover declined by 3.4%.

Hume’s latest 4 quarters’ turnover has inched up by 1.8% to RM600 mil when compared to the turnover of the preceding 4 quarters. At the same time, the net profit for the latest 4 quarters, which totaled RM27.9 mil, is 66.1% lower than the earlier 4 quarters. Consequently, its EPS dropped 65.2% from 43.7 sen to 15.2 sen. See the table below.


Valuation

Based on the last 4 quarters’ EPS of 15.2 sen & yesterday’s closing price of RM3.32, Hume is now trading at a PE of 21.8 times. This is fairly expensive unless Hume’s financial results is about to change substantially in the near future. This cannot be ruled out as its EPS in the preceding 4 quarters were quite high at 43.7 sen. At this EPS number, Hume would only be trading at a PE of 7.6 times.

Technical Outlook

Hume has broken above its medium-term downtrend line in September. Since then, it has been moving in a sideway manner with the strong horizontal resistance at RM3.18/20 level. Yesterday, it has broken above this resistance and this could be the beginning of the bullish phase for Hume. See the weekly chart below.


Chart: Hume's weekly chart as at Nov 2

Conclusion

Based on the positive technical outlook, Hume could be in for a bullish phase. Its fundamentals are still not very convincing but I expect further improvement with more projects in the pipeline due to the 9MP.

CI has crossed the 1000 mark... finally

Bring out the champagne. The CI has finally crossed the 1000 mark at 11.55 a.m. Unfortunately, it did not manage to hold above the 1000 mark for long. We will have to wait & see whether it can re-test the 1000 again today. My hope is that we can cross & stay above the 1000 mark at the end of today's trading.

Thursday, November 02, 2006

Jotech may have a bullish breakout

Background

Jotech is involved in the design, fabrication & commissioning of equipment and systems for semiconductors & electronic industries as well as manufacturing of high precision tooling die sets, semiconductors’ moulds and parts. The group’s operation is organized into 3 divisions, namely the Precision Stamping, Semiconductor & Electronics divisions.

Recent Financial Results

Jotech’s latest financial results is for QE30/6/06, where its topline & bottomline have shown significant improvement. When compared to the preceding quarter, Jotech’s net profit increased by 6 folds to RM2.6 mil while turnover increased by 23% to RM63.6 mil. Its net profit has also increased by almost 3 folds when compared to the previous corresponding quarter while turnover increased by 41%.

When comparing the latest 4 quarters’ results with the preceding 4 quarters’ results, we note that turnover increased by 40% from RM166 mil to RM233 mil while net profit has jumped from RM1.4 mil to RM6.7 mil. See the table below.


Valuation

Based the last 4 quarters’ EPS totaling 10.4 sen and its closing price of RM1.39 as at Nov 1, Jotech is trading at a PE of 13.4 times. This is probably above what some may consider to be the fair valuation for a small-cap stock.

Technical Outlook

From the weekly chart below, it appears that Jotech has broken above its medium-term downtrend line at RM1.20 level. It is in a short-term uptrend, which will provide support at RM1.10. Its immediate horizontal support & resistance are at RM1.10 & RM1.50, respectively. The breakout above the medium-term downtrend line may be the beginning of the bullish phase for this stock.


Chart: Jotech's weekly chart as at Nov 1

Conclusion

Based on positive technical outlook & improving financial performance, Jotech could be a good investment for the medium-term.

Wednesday, November 01, 2006

Pentamaster may have a bullish breakout

Background

Pentamaster is involved in the provision of manufacturing automation solutions, specializing in the production of tailor-made systems and automated equipment. One of the main markets for its systems & equipment is the semiconductor assmebly sector.

Recent Financial Results

Pentamaster’s latest financial result is for QE30/6/06. Its net profit has increased by 83.9% q-o-q from RM3.2 mil to RM5.9 mil on the back of a 31.7%-increase in turnover from RM25.8 mil to RM33.9 mil. When compared to the previous corresponding quarter, its net profit has declined 12.3% while turnover was up 6.5%.

When comparing the latest 4 quarterly results with the preceding 4 quarterly results, we can see that net profit has increased by 9.3 % from RM15.1 mil to RM16.5 mil, while turnover was up 24.1% from RM99.4 mil to RM123.4 mil. EPS for the 2 periods was up 6.6% from 11.6 sen to 12.4 sen. See the table below.


Valuation

Based on the latest 4 quarterly EPS totaling 12.4 sen & its closing price of RM1.00, Pentamaster is now trading at a PE of 8.1 times.

Technical Outlook

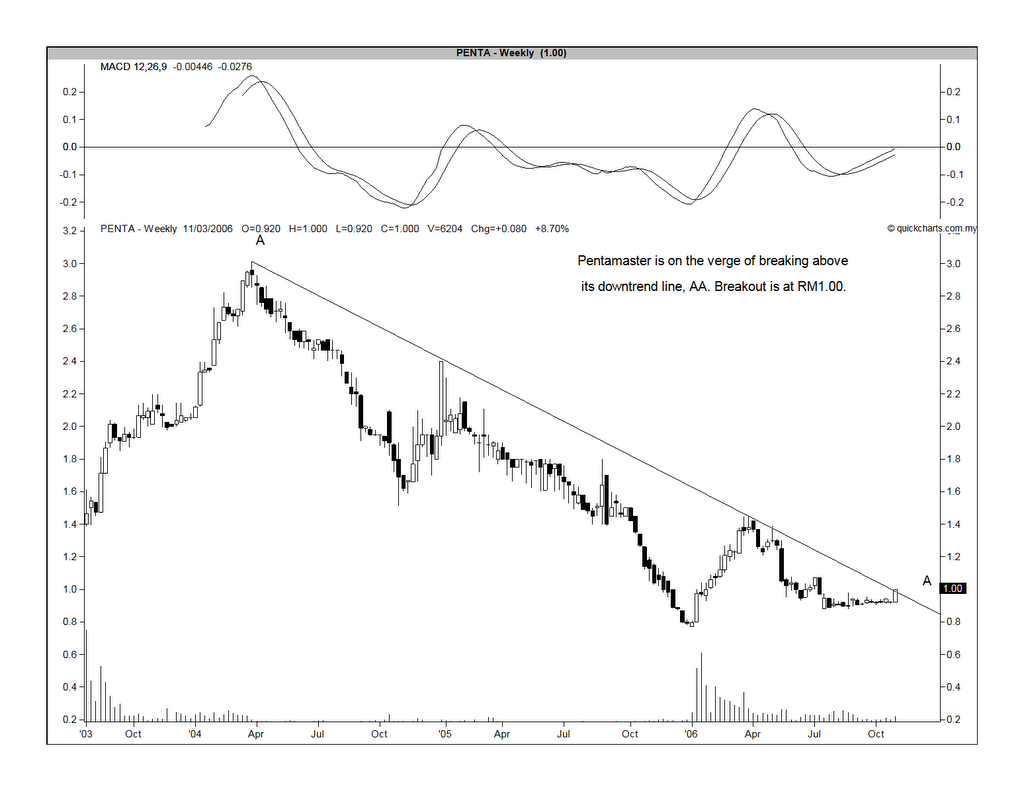
Pentamaster has been in a downtrend after achieving a high of RM3.01 in March 2004. Yesterday, the share price gained 6.5 sen to close at RM1.00, which is right on the downtrend line itself. At the close of this morning, Pentamaster share price has broken above the downtrend line when it rose 5 sen to RM1.05. See the chart below.


Chart: Pentamaster's weekly chart as at Oct 31

Conclusion

Based on positive technical outlook, I believe Pentamaster could be a good medium-term investment.

Courts is on the run

After a sharp selloff, Courts has finally staged a strong & sustained rebounce. In the past 3 days, the share price has risen from RM0.515 as at Oct 26 to RM0.725 as at yesterday (Oct 31). In early morning trading today, Courts has gone as high as RM0.82 at 9.40 a.m.

How far can it go? The immediate medium-term downtrend line may post some resistance at RM0.90 and after that, it has to overcome the psychological RM1.00 mark. The market is probably awaiting the announcement of the sale of the majority stake in Courts, which will almost certainly trigger a MGO at the price agreed upon.


Chart: Courts' weekly chart as at Oct 31

MPI again surprises with a very good results for QE30/9/06

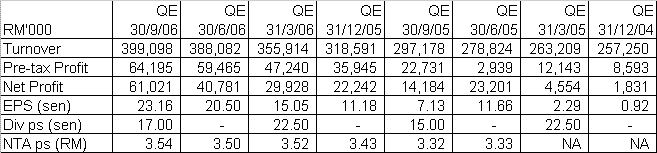
MPI has just announced its results for QE30/9/06. MPI’s net profit increased by 49.6% q-o-q or 330% y-o-y to RM61.0 mil. This was achieved on the back of a turnover of RM399 mil, which represents a marginally 2.8%-increase over the preceding quarter’s turnover but a jump of 34.3% over the turnover of the previous corresponding quarter. See the table below.


The biggest contribution to MPI's big net profit jump is its improving gross profit. The gross profit margin has increased from 12.2% for QE31/12/05 to 14.4% for QE31/3/06 to 16.3% for QE30/6/06 to finally to 22.4% for QE30/9/06.

Based on the latest quarterly EPS of 23.16 sen, MPI's full-year EPS is estimated to be about 92.64 sen. At a closing price of RM9.90 yesterday (Oct 31), MPI is trading at a PE of 10.7 times.

Technically speaking, MPI has broken above its downtrend line in September but the stock has been drifting sideway. Maybe, the continuous flow of good results would act as a catalyst for a re-rating of MPI.


Chart: MPI's weekly chart as at Oct 31

Tuesday, October 31, 2006

Suiwah has a very poor QE31/8/06

Latest Financial Results

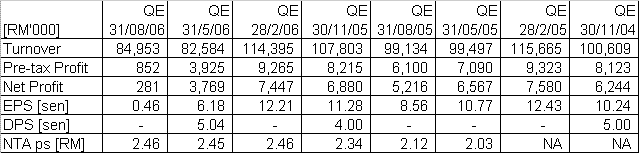
Suiwah has reported its results for QE31/8/06 yesterday. Its net profit plummeted by 94.6% y-o-y or 92.5% q-o-q to RM281k. Turnover of RM85.0 mil represents a 14.3%-decline when compared to the previous corresponding quarter’s turnover but 2.9% higher than the turnover of the preceding quarter. Suiwah attributed its poor result to intense competition in the Flexible Printed Circuit ("FPC") boards sector, one of the group’s two main core business. The other core business is retailing. See the table below.


Technical Outlook

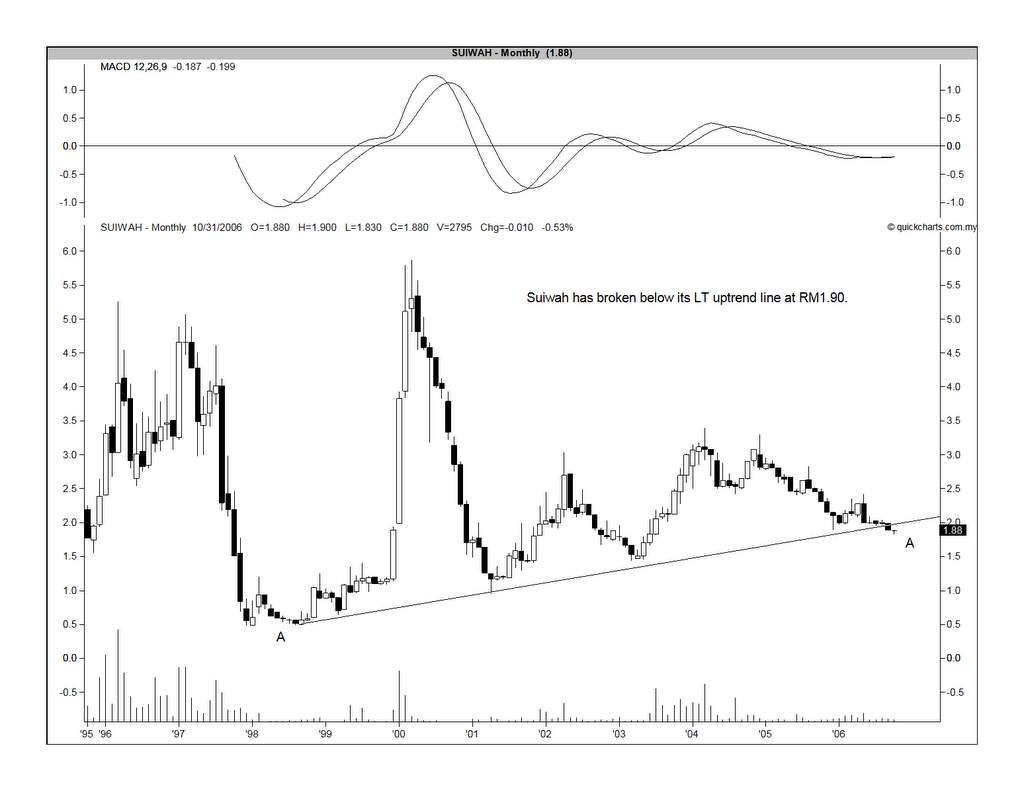
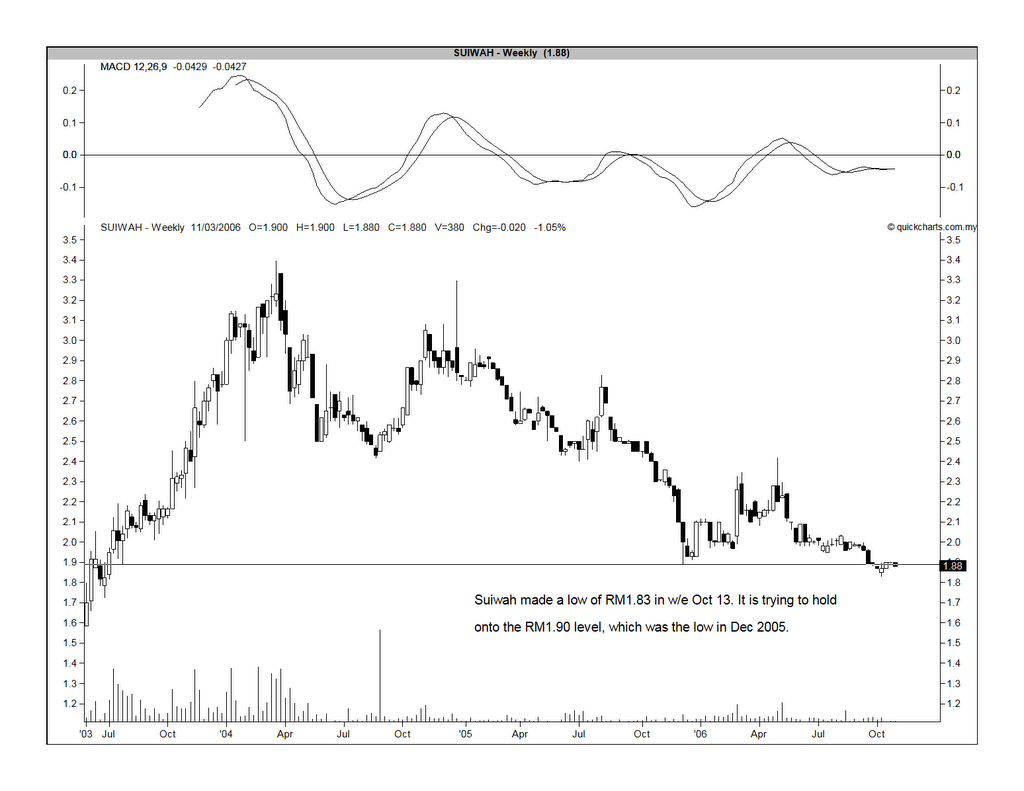
Suiwah is barely holding onto its long-term uptrend line at RM1.90 (see the monthly chart, Chart 1 below). From the weekly chart (Chart 2), we can see that Suiwah has momentarily made a low of RM1.83 in w/e Oct 13, which is lower than the low of RM1.88 made in December last year.


Chart 1: Suiwah's monthly chart as at Oct 30


Chart 2: Suiwah's weekly chart as at Oct 30

Conclusion

With the sharp deterioration in the financial performance, Suiwah may not be able to hold onto its current support of RM1.90 (or, marginally below that). A convincing break would see a sharp selloff in Suiwah. It maybe prudent to dispose of Suiwah at this stage & wait for the dust to settle.

Monday, October 30, 2006

Covered Warrant Update as at October 27

I have posted here an updated Table of Covered Warrants for your reference. After careful study, I've noticed that I've made 2 errors with regards to the computation of the gearing multiple & intrinsic value of the warrants.

For gearing multiple, I have previously used a formula of share price divided by warrant price. It has been revised to share price divided by the product of the multiplication of warrant price & warrant's conversion ratio. Intrinsic value, which was previously calculated based on the formula of share price less warrant's exercise price, has been revised to share price less the product of the multiplication of warrant price & warrant's conversion ratio. In addition, the premium of the warrant has now been presented in a slightly different format.

Those warrants with low premium has been highlighted in yellow and, amongst them, those with high gearing, their gearing multiples are highlighted in green. Two warrants i.e. Astro-CA & Scomi-CA have less than 3 months to expiry. Their expiry dates are highlighted in pink.


For those who are interested to learn more about covered warrants (or, call warrants), you may check out this link (here).