Mycron has achieved a net profit of RM7.6 million on a turnover of RM84.2 million for QE30/6/2006 (the latest available result). Its EPS fro that quarter amounted to 4.3 sen; giving a full year EPS of 17.2 sen. Based on its closing price of RM0.83 today, Mycron is trading at a PE of only 4.8 times.
The weekly chart (Chart 1) shows that Mycron share price is in a downtrend with a possible breakout at RM0.80. It has tested that level yesterday (Nov 23) but failed to stay above the RM0.80 mark (see the daily chart, Chart 2). Today, Mycron has again broken above this level & closed at RM0.83. If this breakout can hold, the share price may go higher, with horizontal resistances at RM0.85, RM0.95 & RM1.00.
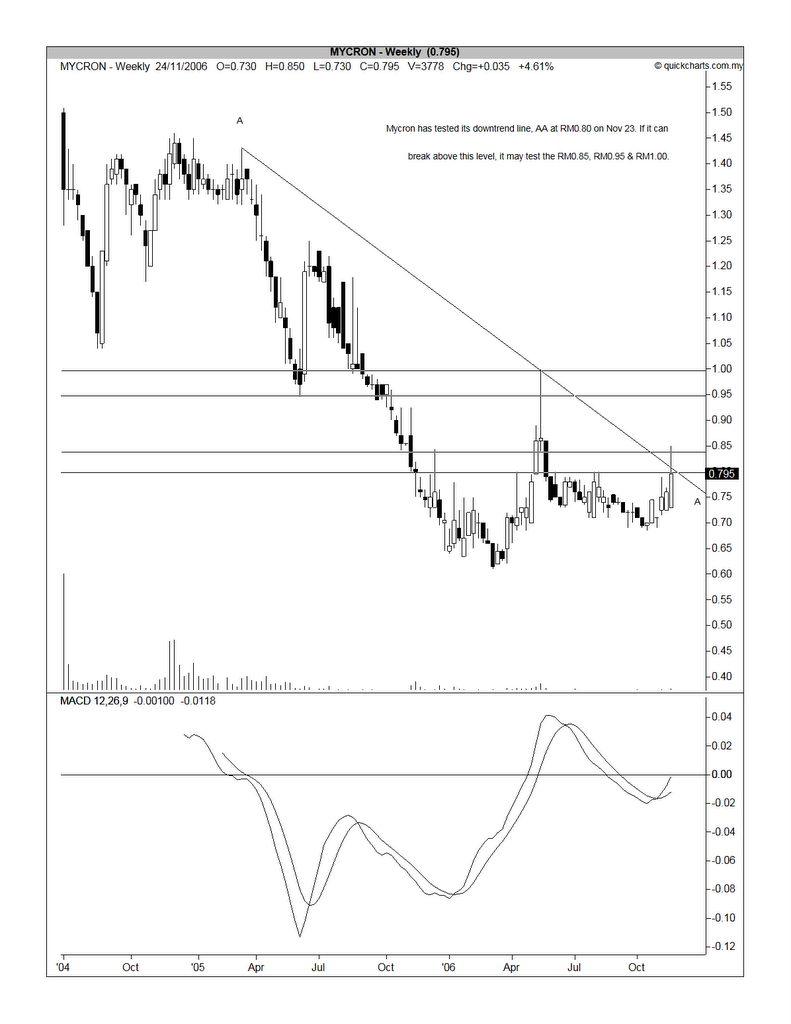
Chart 1: Mycron's weekly chart as at Nov 22

Chart 2: Mycron's daily chart as at Nov 22
Based on relatively cheap valuation & possible bullish breakout, Mycron could be a good trade.
No comments:
Post a Comment