Wednesday, September 20, 2006

Courts reported a big loss for QE30/6/2006

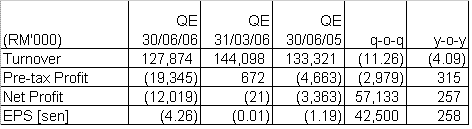
Courts has recently announced its result for QE30/6/2006. Its turnover dropped 11.3% q-o-q or 4.1% y-o-y to RM127.9 mil. Net loss jumped to RM12.0 mil from RM0.02 mil recorded in the immediately preceding quarter or from RM3.4 mil reported in the corresponding quarter last year (see Table 1 below). The poor result was attributed to lower credit sales & service charge income in Malaysia & higher group operating expenses such increase in bad debt charge and forex losses.


Table 1: Courts' quarterly results for QE30/6/2006 compared

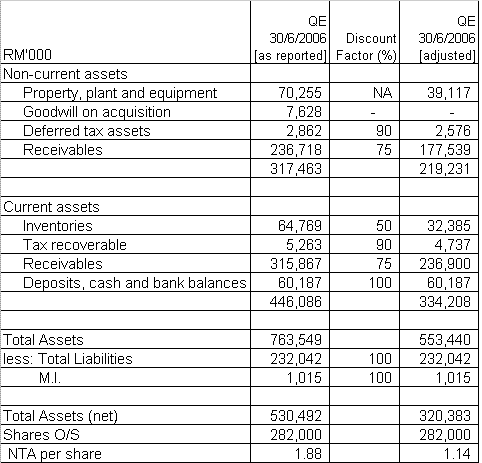
As noted in my first post on Courts, the proper valuation method to adopt is the break-up valuation. I've re-evaluated Courts again using the latest balance sheet as at 30/6/2006. Despite the poorer result, the fair value is about the same at RM1.14 per share (see Table 2 below).


Table 2: Courts' value as per break-up valuation method


Technical outlook

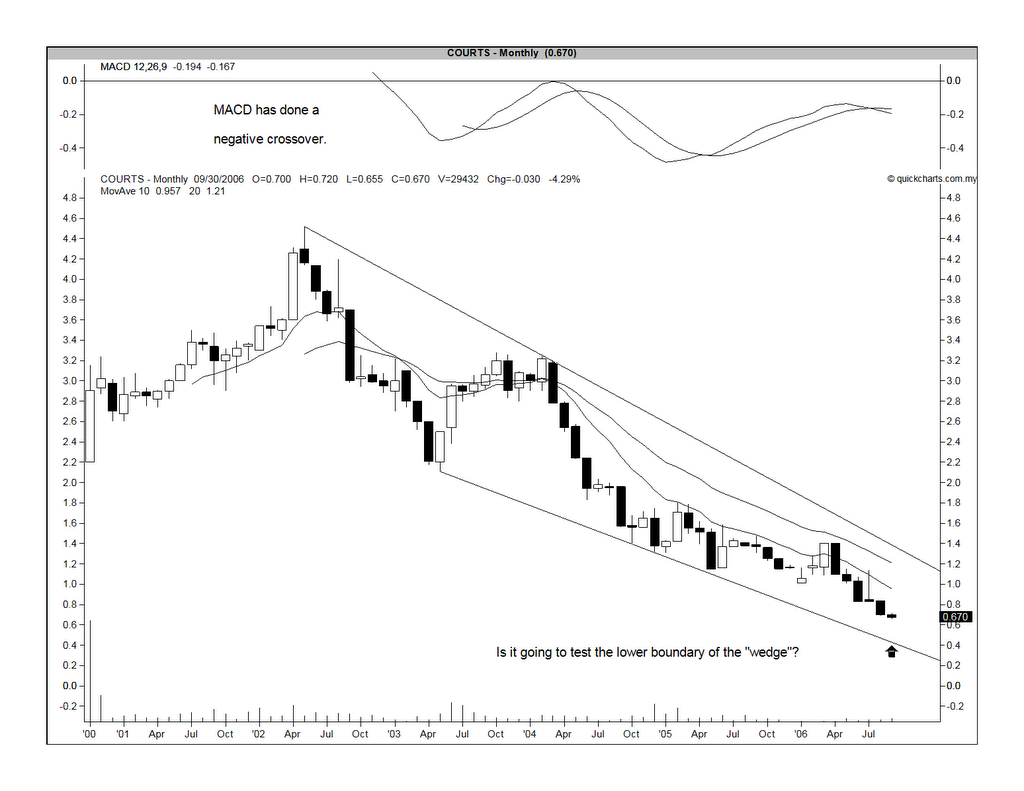
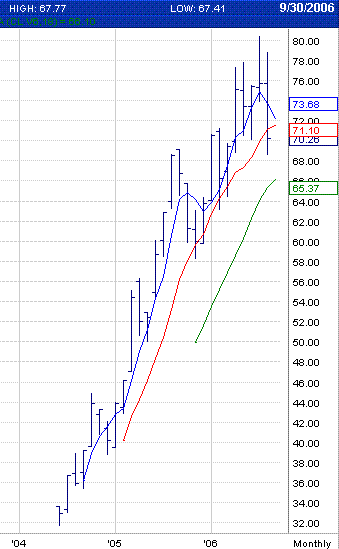
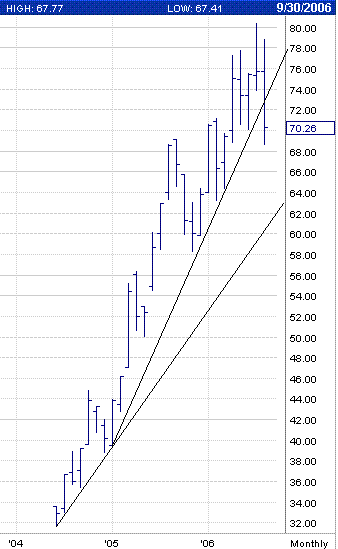
As noted in my second post on Courts that a break of the then-prevailing horizontal support of RM0.80/82 could lead to lower prices. This has indeed happened. A look at the weekly chart (Chart 1) shows that Courts is now at the lower boundary of a downward channel. This boundary should support the share price at RM0.65 level. A break of the downward channel could see the share price going to the long-term downward support line at RM0.45. I see this scenario as not likely & that the channel should hold.


Chart 1: Courts' weekly chart as at September 19


Chart 2: Courts' monthly chart as at September 19


Conclusion

The share is now trading at RM0.67, which is at a discount of 41% to the fair value (of RM1.14) derived from our break-up valuation. The latter is approximately 60% of the NTA per share (of RM1.88) based on Courts' latest balance sheet as at 30/6/2006. An investment at this level is fairly safe as it is a deep discount to the current NTA of the share.

Finally, a decision is expected soon regarding the disposal of Courts plc's majority stake in Courts Mammoth. This disposal would almost certainly lead to a MGO at the transaction price that will be agreed between Courts plc's administrator & the buyer.

Tuesday, September 19, 2006

BJToto-CA is about to make a new high

BJToto-CA (closed at RM0.315 as at September 18) is the call warrant of BJToto (closed at RM4.66 as at September 18) issued on July 11, 2006 by CIMB. A total of 25 mil BJToto-CA were issued at a issue price of RM0.30. The exercise price is RM4.43 & the expiry date is 8 months from the date of issue.

From Chart 1 below, we can see that the price of BJToto-CA has touched its high of RM0.32 recorded on its first day of trading on July 24. BJToto-CA would be considered technically bullish if it can surpass the RM0.32 level convincingly.


Chart 1: BJToto-CA's daily chart as at September 18

However, I must point out that one of the possible reason for BJToto (the underlying share)'s current strength could be the upcoming dividend of 12.5 sen, which will go "ex" on September 22. As a result of the rise in the underlying share, the call warrant has also risen accordingly. Unfortunately, the holders of the call warrant are not entitled to any dividend.

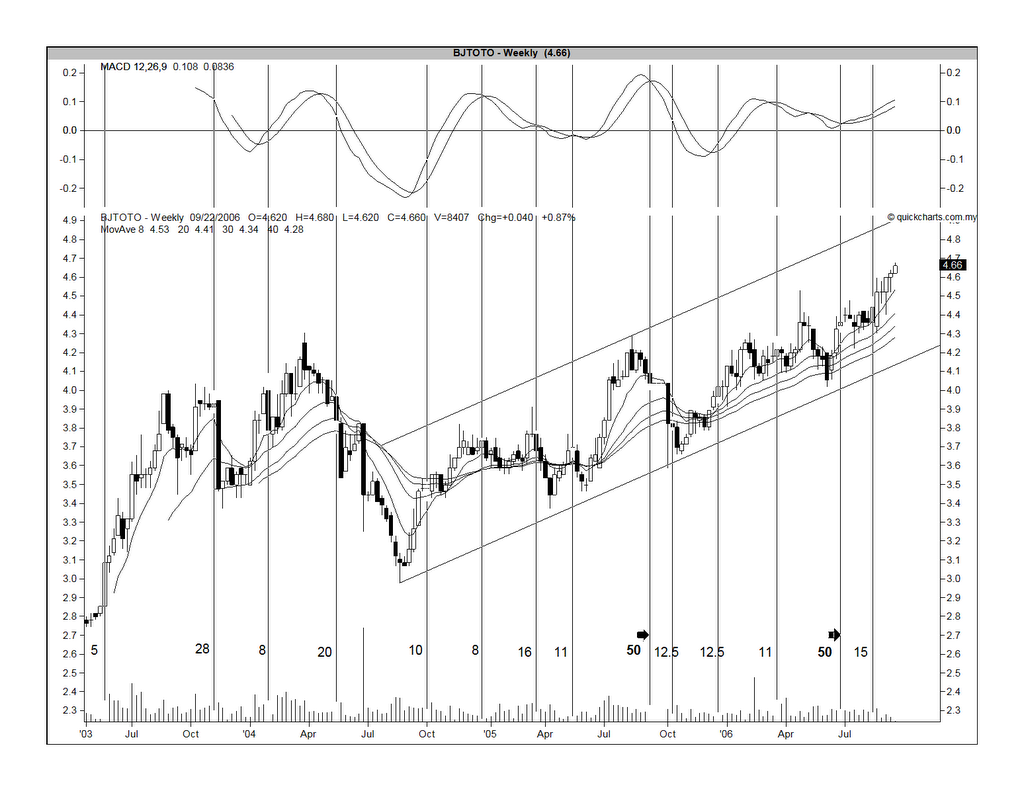
From Chart 2 below, you will see the track record of BJToto's dividend payment for the past 3 years noted down at the bottom of the price chart. You may note that BJToto has paid out dividend totaling 46 sen for calender year 2004; 52 sen for calender 2005; and 25 sen for the year todate. In addition, it has also made 2 capital repayments of 50 sen each; once in Sep 2005 & again in July 2006.


Chart 2" BJToto's weekly chart as at September 18 (with dividend payments [in sen] noted at the bottom of the chart)

Many analysts are calling a BUY on BJToto because of its steady stream of dividend. Based on last calender year's dividend of 52 sen, the stock's dividend yield is 11.16% (using yesterday's price of RM4.66).

It is noticeable that the call warrant of an underlying share that pays good dividend would normally trade at very little premium. The reason could be because investors tend to prefer the underlying share to the call warrant. The same can also be observed in BJToto-CA, which trades at a premium of 1.8% only. Nonetheless, a call warrant would move in the same direction (or, trend) like that of the underlying share.

The recommendation for BJToto-CA is strictly based on technical consideration & for trading purposes only. If you are worried that the current technical set-up may have been skewed by the upcoming dividend payment, then you should wait until the dividend payment's ex-date has passed before committing. As always, any investment in call warrants has to be tracked regularly and if it doesn't work out as you have envisaged, you must be prepared to pull the plug fast to prevent further decay due to the passage of time.

Monday, September 18, 2006

MPlant broke above it medium-term downtrend

Business Activities

Malaysian Plantations Bhd (“MPlant”) is mainly involved in the provision of financial services such as commercial banking, financing, merchant banking, stock broking, unit trust management & investment advisory services. The main subsidiary is Alliance Bank Malaysia Bhd.

Recent Financial Performance


MPlant has gone through a period of consolidation in the first half of FYE31/3/2006 (after Temasek has taken over the driving seat in the company). A spring clean of its books has resulted in loan loss provision and impairment loss of RM478 million being booked into its accounts during that period. The impact was very noticeable for 2Q2006, which ended 30/9/2005, where the specific provision and impairment loss of RM415 million were recorded & this has resulted in a net loss of RM229.9 mil.

In 4Q2006, which ended 31/3/06, MPlant has again reported a net loss of RM11.6 mil, which was “mainly due to lower net interest income and other operating income, coupled with higher operating expenses and loan allowances.”

For 1Q2007, MPlant has reported a 65.5%-jump in its net profit y-o-y to RM39.6 mil which was achieved on the back of a 9.4%-increase in turnover to RM360 mil. The turnover recorded in this latest quarter is one of the highest in the past 8 quarters (except for 4Q2005). The company attributed the improved performance to “higher net income, including net income from Islamic Banking business which improved by RM11.2 million or 73.2% and lower specific allowances being made coupled with stronger recoveries for the period under review.”

Valuation

Based on the EPS for 1Q2007 of 3.39 sen, MPlant’s annualized EPS for FY2007 is about 13.56 sen. Based on its closing price of RM2.16 as at September 15, MPlant is now trading at a PE of 16 times. This is not a cheap price to pay for a small bank in Malaysia.

If MPlant is subject to a speculative takeover play (which is unlikely given that Temasek has plans for MPlant), then the likely valuation is the 'Price to Book' method. Using this method & assigning a multiple of 1.95 times (same as what Commerce paid for Southern Bank), then MPlant may be valued at RM3.00 (i.e. RM1.54 multiplied by 1.95). As such, some may still find MPlant to be inexpensive at the current level.

Technical Picture

From Chart 1 below, we can see that MPlant has clearly broken above the downtrend line at the RM2.15 level. With this breakout, it is now fairly safe to buy into MPlant.


Chart 1: MPlant's weekly chart as at Sept 15

In addition to the share, we can also look at MPlant-WA (closed at RM0.95 as at September 15). This warrant has an exercise price of RM1.21 and expiring in June 2007. Based on the closing price on September 15, the warrant is trading at its intrinsic value without any premium. This could be attributable to its short remaining tenor to expiry. The technical outlook for the warrant is similar to that's of the mother share, which is a positive breakout.


Chart 2: MPlant-WA's weekly chart as at Sept 15

Recommendation

Based on the above, I believe MPlant is a safe LT investment. For those who like some leverage, you can look at the warrant. But, be forewarned that the warrant shall expire in 10 months' time.

Sunday, September 17, 2006

Linkfest time

For this week, I have the following links for your reading:

1. In recent years, private equity funds have started springing up to cater for sophisticated wealthy investors. What these funds do- at outrageous fees- are to look for undervalued public companies, or promising new companies looking to go public, and buy them up at a price higher than the current stock-market price (sometime, at a premium of up-to-20%). These acquisitions are often financed by the issuance of junk bonds, at high interest rates. The new owners would often offer fat new pay packages to the managers of the company they've just acquired, to give them even greater incentive to maximize the value of the company, so it can be taken public again.

This development raises troubling questions about the fiduciary duties of public companies’ managers. Who do they owe their allegiance to: the existing public shareholders or the potential new owners? Read more about it here.

2. Most investors are fairly confused by the on-going market correction. Are investors disappointed with the recent Budget? Or, is it a case of “buying on rumor and selling news”? Well, it could be something simpler; something to do with the time of the year that we’re operating in. It seems that September has historically been “the most difficult month for stocks”. That’s the bad news. The good news is “the strongest upward bias in stocks has historically occurred during the November-January time frame”. Go here for the chart that says it all.

3. Investing is hard. It requires a lot of hard work & discipline and a strong self-belief system. On top of all these, you need to have a fair dose of humility, that sometime you could still get it wrong. So, when someone comes along & starts to show you that you can improve your investing skill by “paper-trading” as well as using tools of “back-testing”, you could be telling yourself “This is it! This is what I've lacked all these years.” Well, think again.

4. The Capital Spectator takes a look at a research paper published on the St. Louis Fed's web site entitled “When Do Stock Market Booms Occur? The Macroeconomic and Policy Environments of 20th Century Booms”, which makes “a timely reminder that equity bull markets tend to thrive under a particular set of conditions…that appear to be on the wane these days”. "We find that booms generally occurred during periods of above-average economic growth and below-average inflation, and that booms typically ended when monetary policy tightened in response to rising inflation," write authors Michael Bordo (an economics professor at Rutgers) and David Wheelock (an economist at the St. Louis Fed). "Most booms were procyclical, arising during business cycle recoveries and expansions, and ending when rising inflation and tighter monetary policy were followed by declining economic activity.” Read more about here.

5. Despite the positive price action in the US equity market, Contra Hour still remains "cautiously pessimistic". Why? Read about it here.

6. Bob Bronson of Bronson Capital Markets Research shares the same view. Read about it here.

7. From Hello Trader, we have a set of 12 trading rules
to guide you in your trading:
Rule # 1: Let your winners run, cut your losers short
Rule # 2: Don’t add to losing positions
Rule # 3: Don’t fight the trend / tape
Rule # 4: Buy strength and sell weakness, not the other way around.
Rule # 5: Trade your personality
Rule # 6: Plan your trade and trade your plan
Rule # 7: When the reason for entering a trade is no longer valid, get out
Rule # 8: Don’t be the weak money
Rule # 9: Keep a trade diary
Rule # 10: Never risk more than 5 percent of your account equity on a trade
Rule # 11: Risk a fixed percentage of capital on every trade
Rule # 12: Focus on market selection


That's all for this week. Have a good weekend.

Friday, September 15, 2006

Plantation broke its short-term uptrend line

I've pointed out in a post
dated September 7
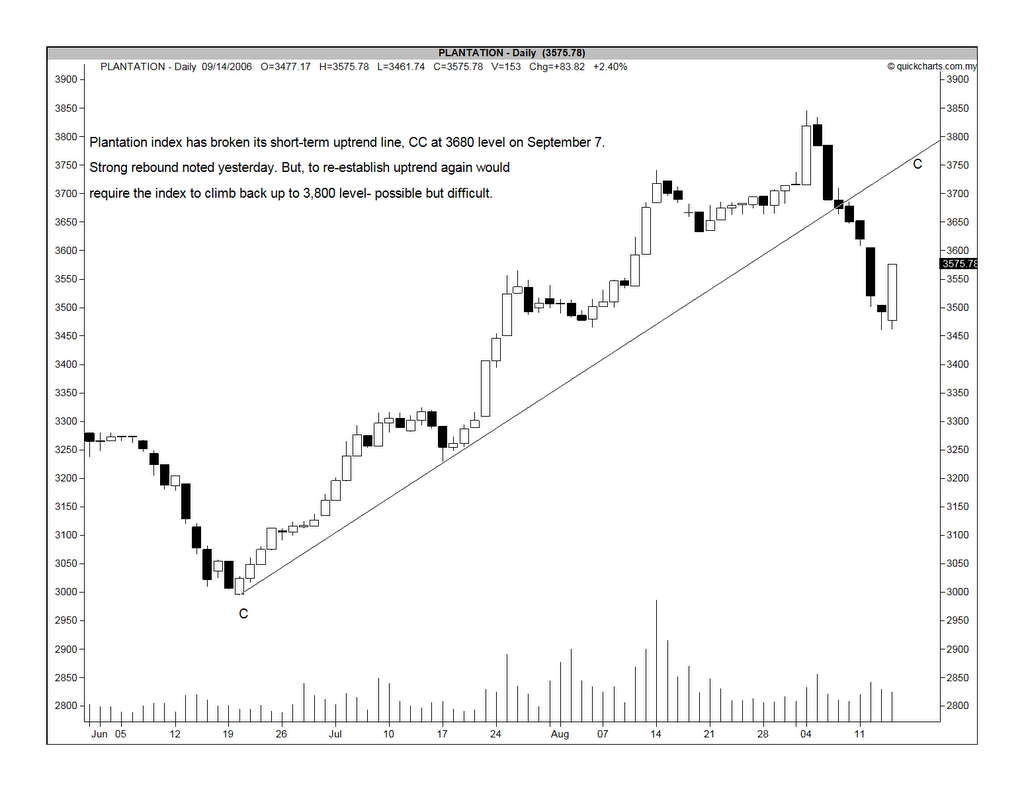
that the Plantation index was about to test the short-term uptrend line (the critical level then was 3688) & it might break below the uptrend line. The index did just that (see Chart 1 below).


Chart 1: Plantation's daily chart as at Sep 14

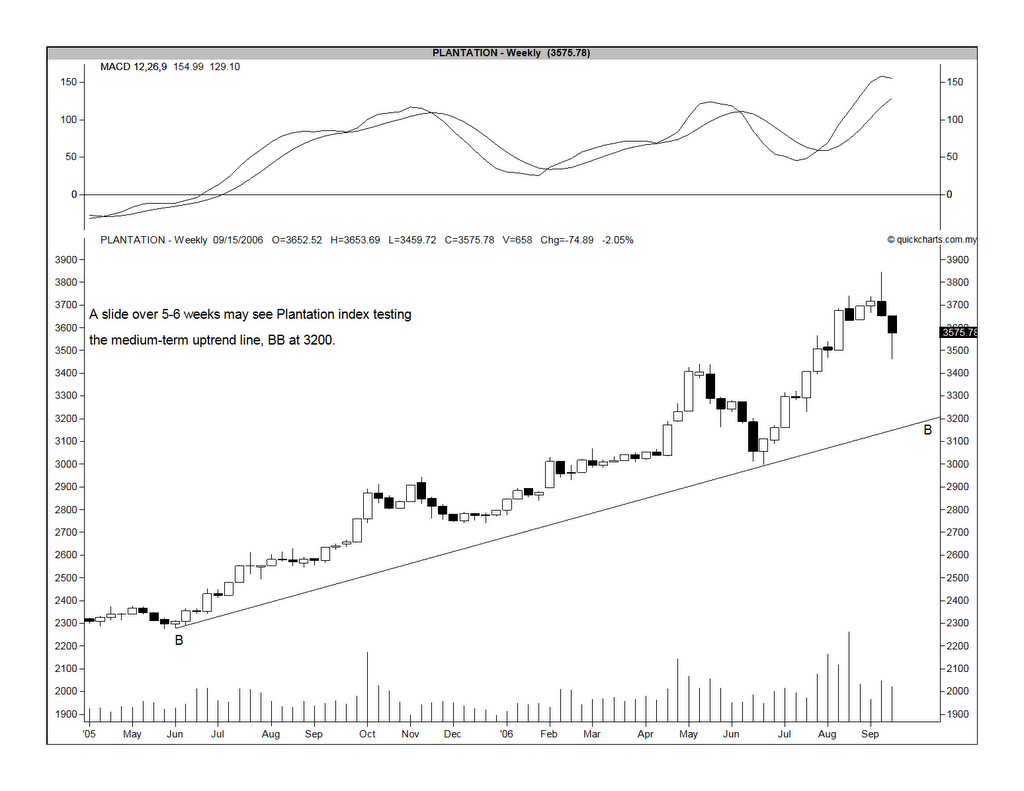
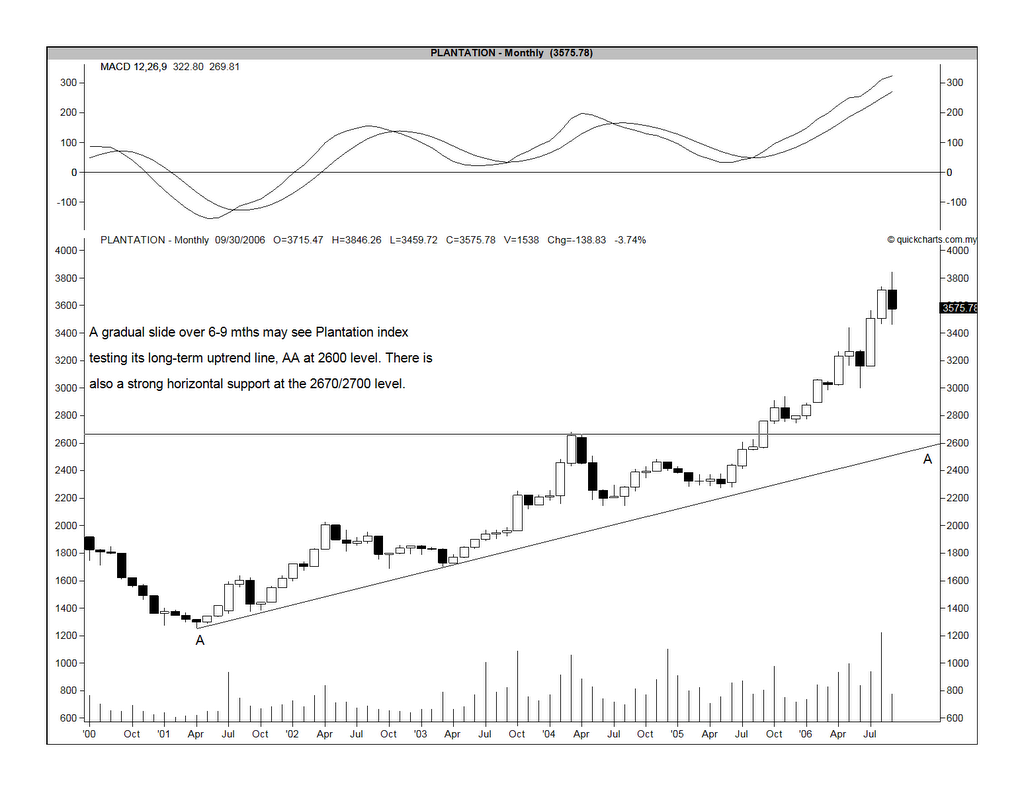
I believe that the Plantation index has put in a temporary top. Despite yesterday (Sep 14)'s healthy rebound of 83.82 points to close at 3575.78, the next few weeks would likely to see the index drifting lower until it tests the medium-term uptrend line at the 3200 level (see the weekly chart, Chart 2 below). It is likely that a rebound would happen at this 3200 level but how strong would this rebound be? If this medium-term uptrend line were to be broken, then the next support would be at the 2600-2700 level, given by the long-term uptrend that dates back to Mar 2001 (see the monthly chart, Chart 3 below).


Chart 2: Plantation's weekly chart as at Sep 14


Chart 3: Plantation's monthly chart as at Sep 14

As the Plantation sector is dominated by palm oil companies and the current plantation rally is driven by a rally in the price of CPO, it is good to take a look at CPO Futures. In an OSK Securities report dated Sep 11, the technical analyst wrote:

The major breakout rally of CPO Futures from the giant “Ascending Triangle” was capped at the RM1660 / tonne level, which has been tested twice lately. A “Double Peak” formation has been constructed as a result of the market action. The market has been trending down since then. While it may look like the CPO Futures has been well supported by the RM1555 / tonne level, another bearish reversal pattern of “Tower Top” has just been detected.

It is the first time we bring up the “Tower Top” candlestick pattern in this column. “Tower Top” is a type of bearish formation which looks like a “V” shape tower. The formation has sharp rally on the left side of the tower and another sharp retracement on the other side. The bearish reversal pattern will be completed if the foundation of the tower is cracked, or the RM1,555/ tonne level is this case. We expect a quick breakdown from the RM1555 / tonne level which would provide a “swing trading” opportunity for the CPO Futures traders. Cut-loss point is pegged at above the RM1,555/ tonne level. Should the RM1,555/ tonne level is violated decisively, look for the RM1,500-RM1,520/tonne zone as the immediate strong support floor. The resistance zone was previously a formidable upside hurdle for the market.

All in, the immediate technical outlook of the CPO Futures is now aligned with a bearish bias. Nevertheless, mid-term outlook of the CPO Futures is still bullish as long as the market will not retrace back below the support line of the “Ascending Triangle”.


The critical RM1,555/ tonne level has in fact been violated. CPO Futures for the month of September closed yesterday at RM1,526/tonne.


Chart 4: CPO Futures as at Sep 8

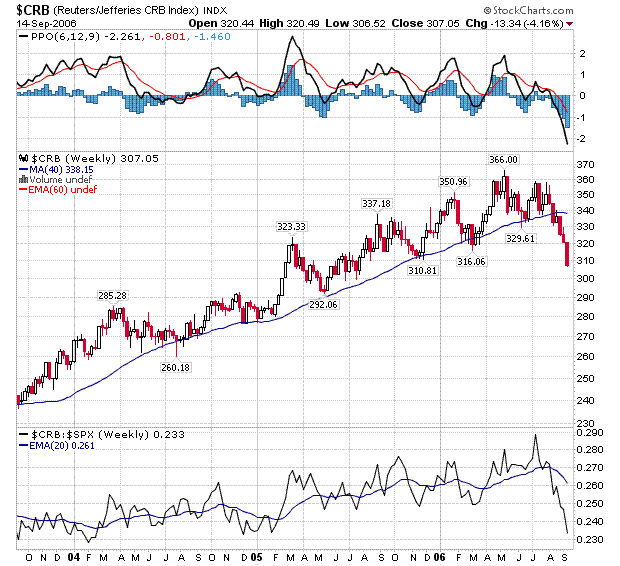
Finally, the trend of CPO Futures is partly reflective of the trend for commodities as a whole. On that count, we can say that the medium-term outlook for commodities is not good. From Chart 5 below, you can see that CRB index's medium-term uptrend has been broken.


Chart 5: CRB's weekly chart as at Sep 14

In conclusion, you may want to use any rebound in the Plantation sector to reduce your position in that sector. Entry into this sector can be deferred until the Plantation index has found a convincing support at either the medium-term or long-term uptrend line. You should also look at the technical outlook for CPO Futures to confirm your technical reading of the Plantation index.

Thursday, September 14, 2006

ZA-OSKSB- What is it?

In last weekend's issue of the Star Bizweek, you will find a good article entitled "Modifying to increase interest" contributed by Allan Voon, which touches on the attractiveness of buying ZA-OSKSB.

Allan explained that ZA-OSKSB actually stands for OSK Big 20 Basket Warrant. This basket warrant is "a tracker certificate (which is) another form of securitized derivative which belongs to the same family as covered warrant. As the exercise price of (this basket) warrant is close to zero (actually, it is a negligible 1 sen), this is no different than just buying the underlying share."

Based on the closing price as at September 13, 2006, 10 lots of ZA-OSKB [or 1000 units] is theoretically worth about RM1,013. This amount will yield a gross dividend of about RM45.85 or net dividend of RM24.76. Net dividend is arrived at by deducting 28% tax and thereafter 25% service charges levied by the management. See the table below.


While 10 lots of ZA-OSKSB [or 1000 units] is theoretically worth about RM1,013, the market is valuing it at RM900 only. This represent a discount of 11.2% to the theoretical value. In addition, these 10 lots of ZA-OSKSB [or 1000 units] would yield a net dividend of RM24.76, giving a fairly decent dividend yield of 2.75%.

Some believe that ZA-OSKSB is trading at a big discount because of its current mode of exercise. This warrant can only be exercised at the expiry date. OSK had proposed to modify the mode of exercise whereby this warrant can be exercised on a number of pre-determined occasions. In the article, it was stated that "the Securities Commission has already approved its application to modify the style of exercise and would be informing its warrant holders at a later date".

I believe that the immediate effect of this modification exercise is the narrowing of the discount that the market asks for owning ZA-OSKSB. Even if this warrant does not trade at a discount, it is still a very interesting investment instrument that allows the holder to invest in a diversified portfolio of the top 20 blue chips in Malaysia at a very small upfront cost.

Mieco- a turnaround story in the making

Business Activities & Recent Development

Mieco Chipboard Bhd ("Mieco") is involved in the manufacturing of chipboards.

Mieco has completed its new plant, which led to an increase in its production capacity from 300,000 cu meter p.a. to 940,000 cu meter p.a. The new plant will also enable the company to produce chipboard that meets the European standard i.e. the highest international standard. However, the expansion also coincided with similar expansion by other chipboard manufacturers in Malaysia & around the region (especially, Thailand), which led to a sharp drop in the selling price (due to a jump in supply) & under-utilization of production capacity.

Recent Financial Performance


From the above table, you can see that Mieco’s financial performance was badly affected since QE 30/6/05 when the new plant was completed. The poor selling price coupled with the higher overhead has led to Mieco reporting net losses for 3 quarters i.e. QE31/3/06, QE 31/12/05 & QE 30/9/05.

Mieco has finally turnaround in the last quarter, QE 30/6/06 with a net profit of RM2.9 mil (as compared to a loss of RM0.3 mil in QE 31/3/06) achieved on the back a turnover to RM86.1 mil, which is 27% higher than the immediately preceding quarter’s turnover of RM 68.0 mil. The better result was attributed to improved selling price and increased sale volume as chipboard has benefited from higher selling price of plywood. The sharp rise in the prices of plywood is expected to continue due to sustained rebound in Japanese demand & fall-off in Indonesia logs & plywood supply.

Valuation

Assuming that the performance of Mieco fro the near future shall be similar to that of QE 30/6/06, then the annualized EPS will amount to 5.52 sen. Based on this & Mieco’s closing price of RM0.93 as at Sep 13, the company is now trading at a PE of 16.8 times. This is fairly high but we must bear in mind that future earnings could be better than the last quarter’s earning. In addition, the share price should be well supported by Mieco's high NTA per share of RM1.69. This give the stock a Price to Book of 0.55 times.

Technical Outlook

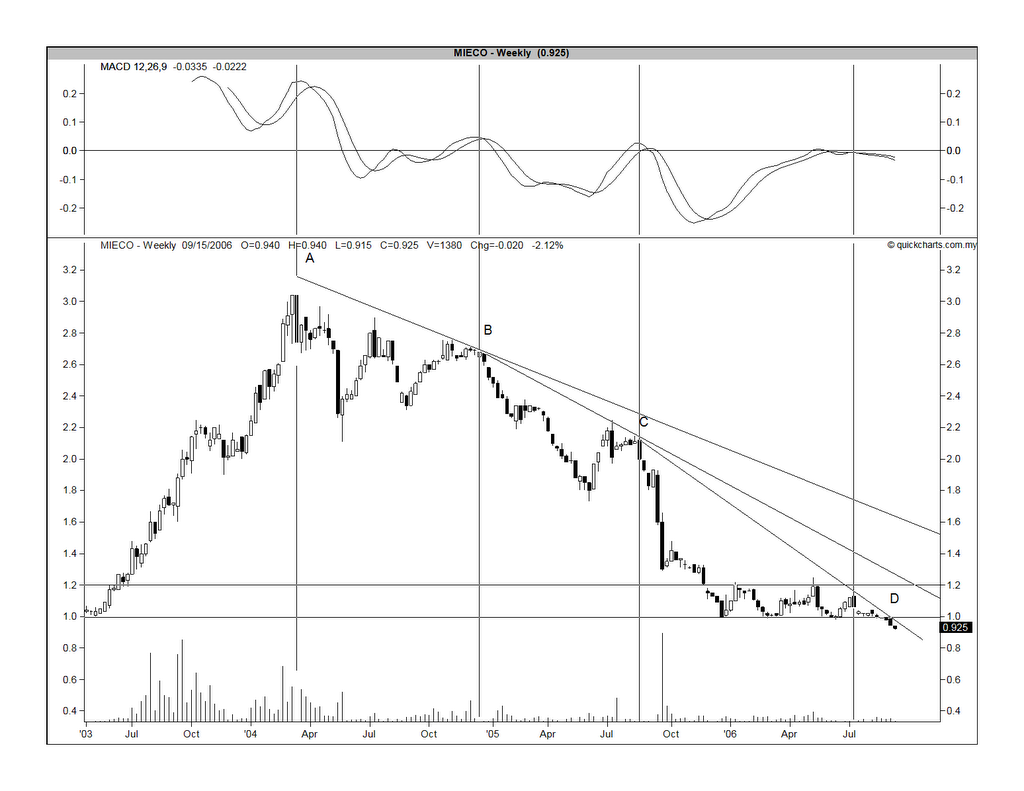
From Chart 1 below, you can see that Mieco's share price hit a high of RM3.16 in w/e Mar 12, 2004. Thereafter the stock started to slide. The downtrend accelerated twice; first from December 2004 and then from August 2005. Since January this year, Mieco seemed to have found a support at the RM1.00 level & traded sideway for 8 months. During that period, its prices were range-bound between RM1.00 & RM1.20. 2 weeks ago, Mieco broken below the RM1.00.


Chart 1: Mieco's weekly chart as at Sep 12


From Chart 2 below, you can see that RM0.91/92 level is a good horizontal support level & if that failed, the next levels will be RM0.80 & ultimately, RM0.70.


Chart 2: Mieco's monthly chart as at Sep 13


Weaknesses noted

2 clear weaknesses have been noted:

(1) The technical picture is not good since it has broken below the strong support of RM1.00.
(2) The turnaround is based on 1 quarter of profitable result. It is possible that this performance may not continue.

Recommendation

Based on improving fundamental & attractive price to book, I would recommend Mieco as a LT investment. Slow accumulation would certainly be adviseable as the technical picture is still bearish.

Wednesday, September 13, 2006

Bandaraya testing the strong horizontal support of RM1.00

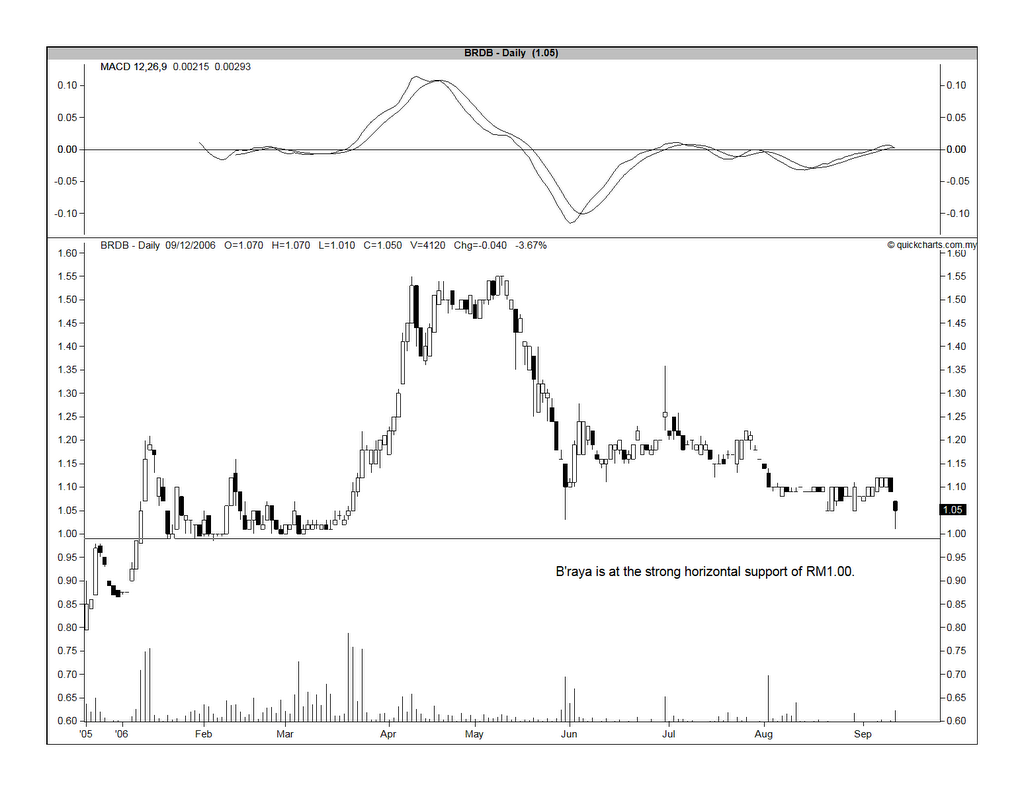
Bandaraya's share price has dropped yesterday & today, probably in reaction to the current market weakness. It is likely to test the strong horizontal & psychological support of RM1.00 (see the Chart below). I expect this support to hold & it may present a good BUY opportunity.


Chart: Bandaraya's daily chart as at Sep 12

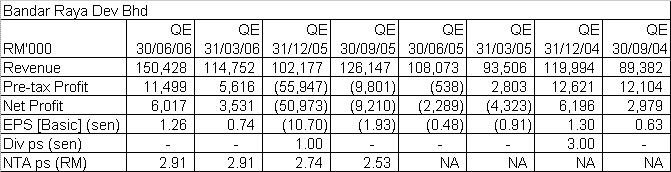
Bandaraya has announced its financial result for QE30/6/06 recently. Its net profit has increased by 70% q-o-q to RM6.0 mil on the back of a 31%-increase in turnover to RM150.4 mil. The improved net profit is attributable to the higher sale of its property division as well as its chipboard manufacturing division (carried on by Mieco). See the table below for Bandaraya's last 8 quarterly result.


Based on the annualized EPS of 5.04 sen (using the EPS for QE30/6/06) & the closing price of Sep 12 of RM1.05, Bandaraya is now trading at a PE of 21 times. While this PE multiple looks high, I believe that it is likely to drop to a more moderate level due to the turnaround in Mieco & the good sale of its new property launch in Bangsar (known as "One Menerung"). Also, you may notice that the share is currently trading at a Price to Book of 0.34 times only. So, take a look at Bandaya.

Tuesday, September 12, 2006

Airasia has a bullish breakout

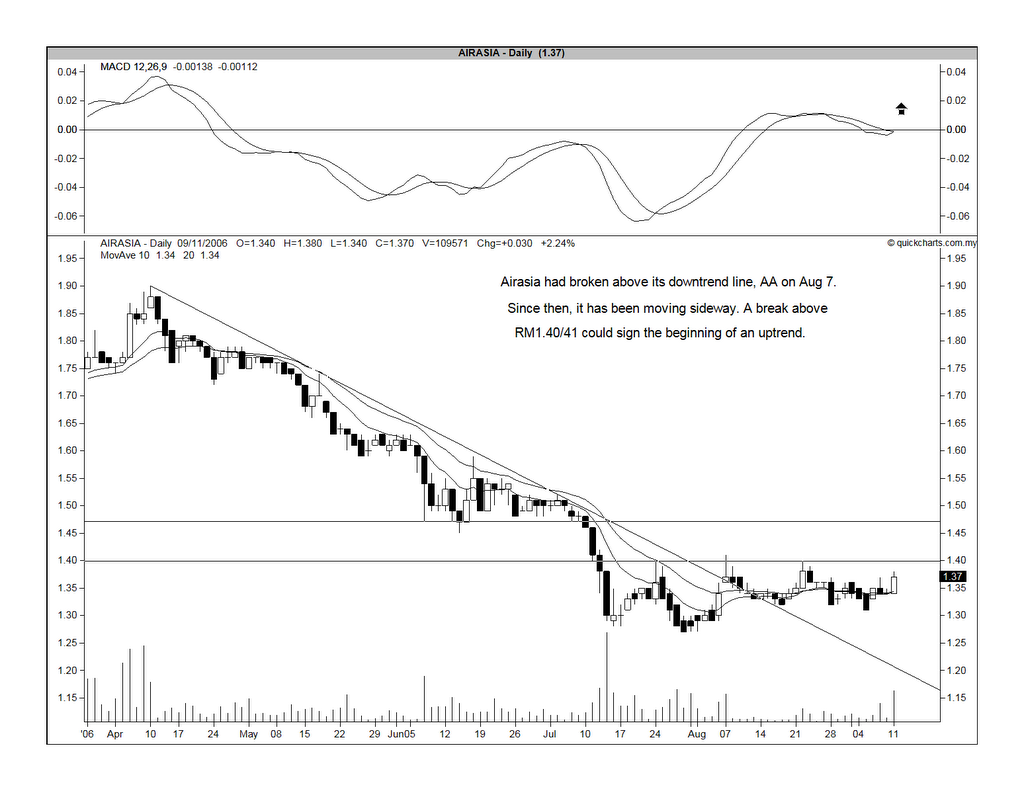
Airasia has been moving in a sideway manner since breaking above its recent downtrend on August 7. The RM1.40/41 horizontal resistance has checked 3 recent advances but this morning, it was overcome. If Airasia can hold above this RM1.40/41 resistance-turned-support, then there is a good chance that Airasia is commencing an uptrend move (see the chart below).


Chart: Airasia's daily chart as at Sep 11

Monday, September 11, 2006

KLCCP & Kassets- Error noted

On August 30, I've posted a piece entitled KLCCP & Kassets- Which is more attractive?

Subsequently, I've discovered that the background information for Kassets was incorrect. In the earlier post, I have stated:

Kassets is the owner of the Mid-Valley Megamall as well as a few other buildings located next to it. In total, the properties owned by Kassets are valued at RM1.68 billion (valuation was carried out in QE 31/3/2006). While the value of Kassets’ properties owned maybe smaller, this will be given a boost when the new phase of Mid-Valley Megamall is completed in 2008.

I have learned from the current issue of The Edge newsletter [w/e Sep 11] that Kassets owns only the Mid-Valley Megamall. The other components of the Mid-Valley project such as the 4-star Boulevard Hotel, 3-star Cititel Hotel, Menara IGB, Centrepoint North & South office towers plus the Phase 2 of the Mid-Valley project such as the upscale shopping mall (known as The Garden), another 2 office blocks, a 5-star hotel & a block of upmarket service apartment are all held directly under Kassets' parent company i.e. IGB.

I regret making this error & will strive to do better in the future.

Road Builder is likely to test its medium-term uptrend at RM2.20

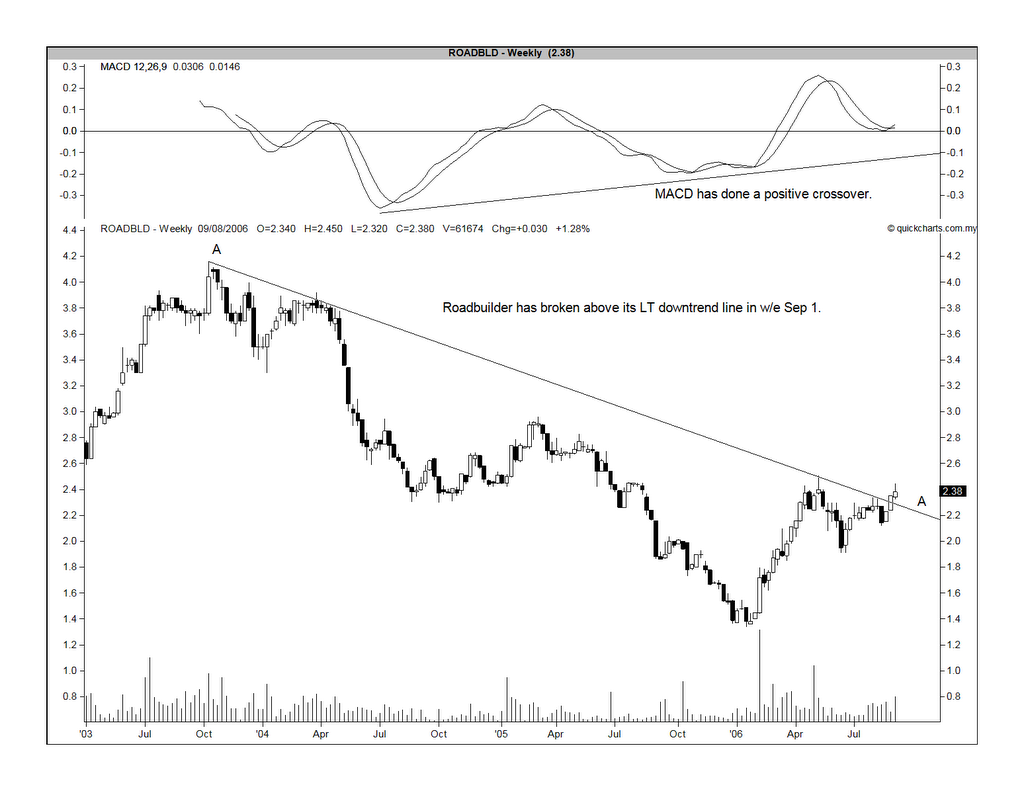
Road Builder's share price, like Gamuda's, has also dropped a bit today. From Chart 1 below, we can see that the stock has broken above its long-term downtrend line at the RM2.30/33 level in w/e Sep 1. It is also in medium-term uptrend, with support at the RM2.20 level (see Chart 2 below). Today, the stock dropped to a low of RM2.24 before closing at RM2.30 at the end of the day. If the stock can hold above the RM2.20 level, it would be a good long-term BUY.


Chart 1: Road Builder's weekly chart as at Sep 9


Chart 2: Road Builder's daily chart as at Sep 9

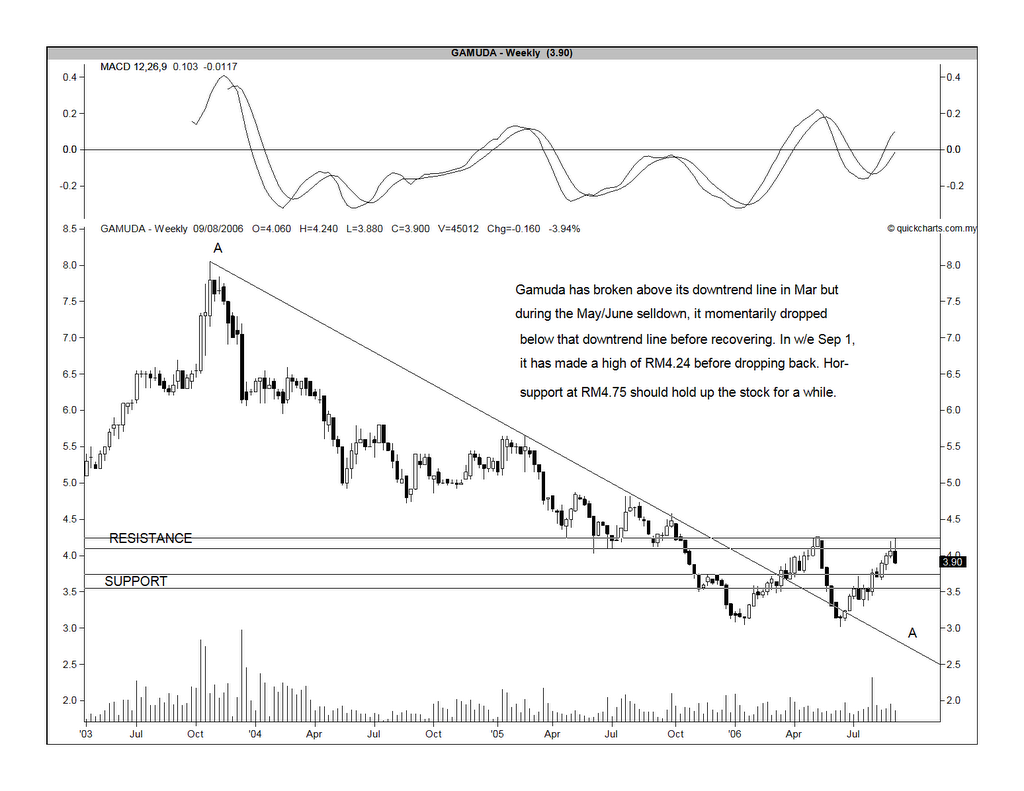
Gamuda has just tested its ST uptrend

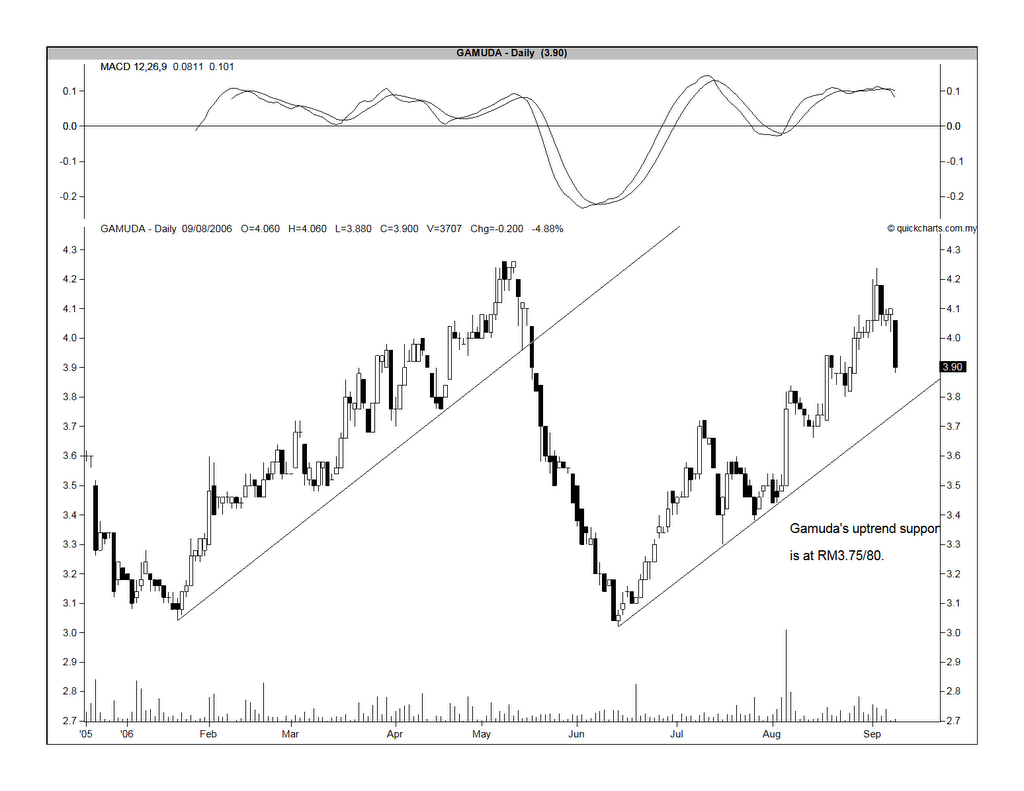
Gamuda has tested its current short term uptrend line at the RM3.75/80 level today. It dropped to a low of RM3.76 before closing at RM3.80 at the end of today's trading (see the Chart 1 below).

It is interesting to note that Gamuda is in a fairly similar position today as it was on May 16 when it hit the then uptrend line at RM3.96 & re-bounded. But, 2 days later, it broke below that earlier uptrend line & slide all the way to a low of RM3.02 on June 14. This may not be a likely scenario today given the many projects that have been bandied about under the 9MP. Nevertheless, it is fairly important that the share price does not break below the current uptrend line at RM3.75/80 anytime soon.


Chart: Gamuda's daily chart as at Sep 8

Also, take a look at the weekly chart below i.e. Chart 2.


Chart 2: Gamuda's weekly chart as at Sep 8

Green Packet may have put in a temporary top

Background

Green Packet is involved in the research, development, manufacturing, marketing & distribution of wireless networking & telecommunication products, networking solution & other technology products & services.

Recent Development

Recently, one of Green Packet's associate company, GMO Limited ("GMOL") was listed on the Alternative Investment Market of the London Stock Exchange on Wednesday, 6 September 2006.

Past 4-year Financial Performance

Since the listing of this company on the Mesdaq Board in May 2005, Its financial performance has been very impressive. From Table 1 below, you can see that its turnover has grown from RM5.1 mil in FYE2003 to RM39.4 mil in FYE2005. Net profit has increased from RM2.9 mil to RM31.7 mil during the same periods.


Table 1: Past 4-year Financial Performance

Recent Financial Performance

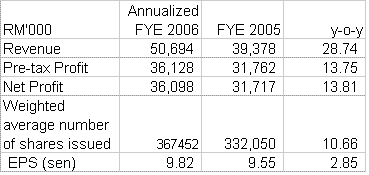
The latest 2Q2006 results shows a net profit increase of 27.6% q-o-q to RM10.1 mil which was achieved on the back of a 21.2% q-o-q increase in turnover to RM13.9 mil. When compared to the corresponding quarter in FYE2005, the net profit has increased by 51.5% while turnover has increased by 57.8%. See Table 2 below.


Table 2: Latest quarterly results compared

However, if you compared the annualized FYE2006 with the actual FYE2005 (see Table 3 below), you would notice that the scorching growth rate has moderated from 117% in FYE 2005 to a more comfortable 29% while pre-tax profit margin has eroded somewhat from 81% in FYE2005 to 71% in FYE2006. The slide in pre-tax profit margin plus the slower growth in turnover are clear indications that competition is picking up. Over the next few quarters, we will see whether Green Packet can weather the tougher operating environment and stay ahead of the competition.


Table 3: Annualized FYE2006 & Actual FYE2005 compared

Technical Outlook

The technical outlook of Green Packet has turned a bit cloudy of late. This may in part be due to the on-going correction in the Mesdaq Board. It is also likely that some investors in Green Packet may be taking profit on the stock in view of its slower growth in turnover & a slight contraction in pre-tax profit margin.

From the chart below, we notice that the MACD has a bearish divergence when compared to the upward movement of the share price. The share price has pulled back to the 30-day MA of RM3.74 at 10.00 a.m. this morning. Further weakness will put Green Packet below its 30-day MA, which happened in June this year. However, the -5% displaced 30-day MA has been supportive in the event of a correction & I expect this may do the same again. That level is at RM3.50/60 now. However, a break below RM3.50 could mean a more severe correction for this stock.


Chart: G Packet's daily chart as at Sep 8


Conclusion

Green Packet may have put in a temporary top recently. Look out for the test of the 30-day MA [at RM3.74] & the -5% displaced 30-day MA [at RM3.50/60]. Be forewarned that a break of the latter could have serious consequences for the stock.

Carotec may show the way forward for the Biofuel play

Carotec is involved in the production of phyto-nutrients & oleo-chemicals. The former consists mainly of food supplements such as Vitamins while the latter will be dominated by the production of Biofuel.

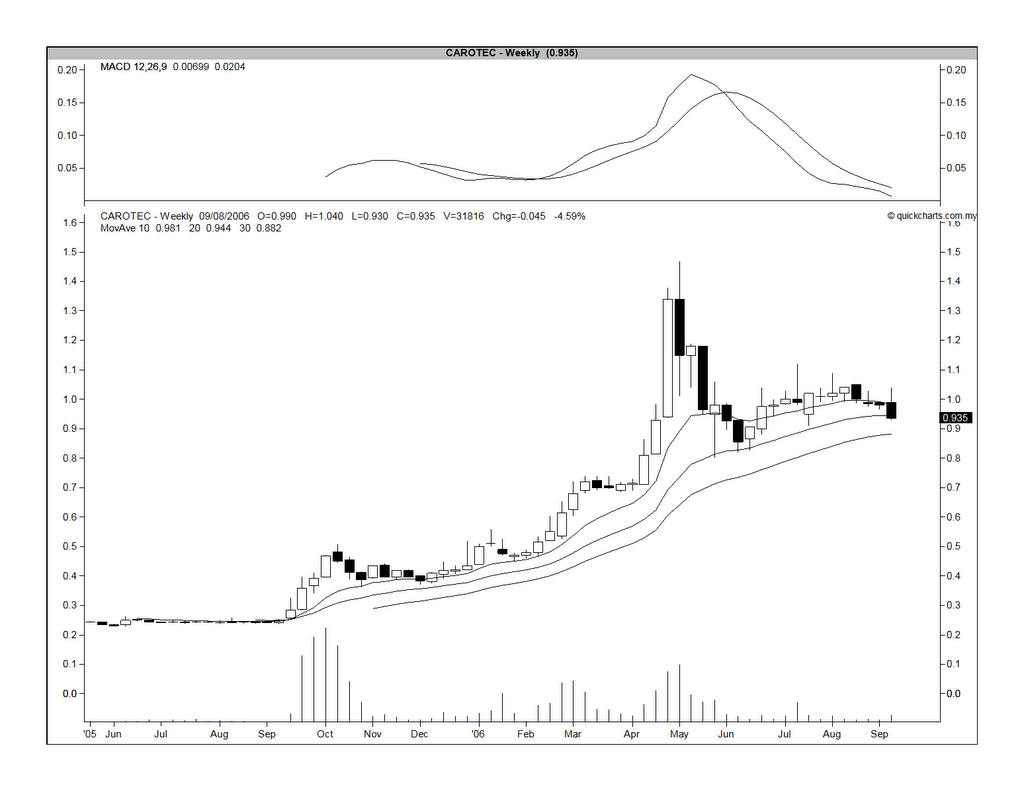
One can say that Carotec was the first company for which the share price has gained substantially due to its involvement in the Biofuel sector, thus benefitting from the recent Biofuel theme play (see Chart 1 below).


Chart 1: Carotec's weekly chart as at Sep 8

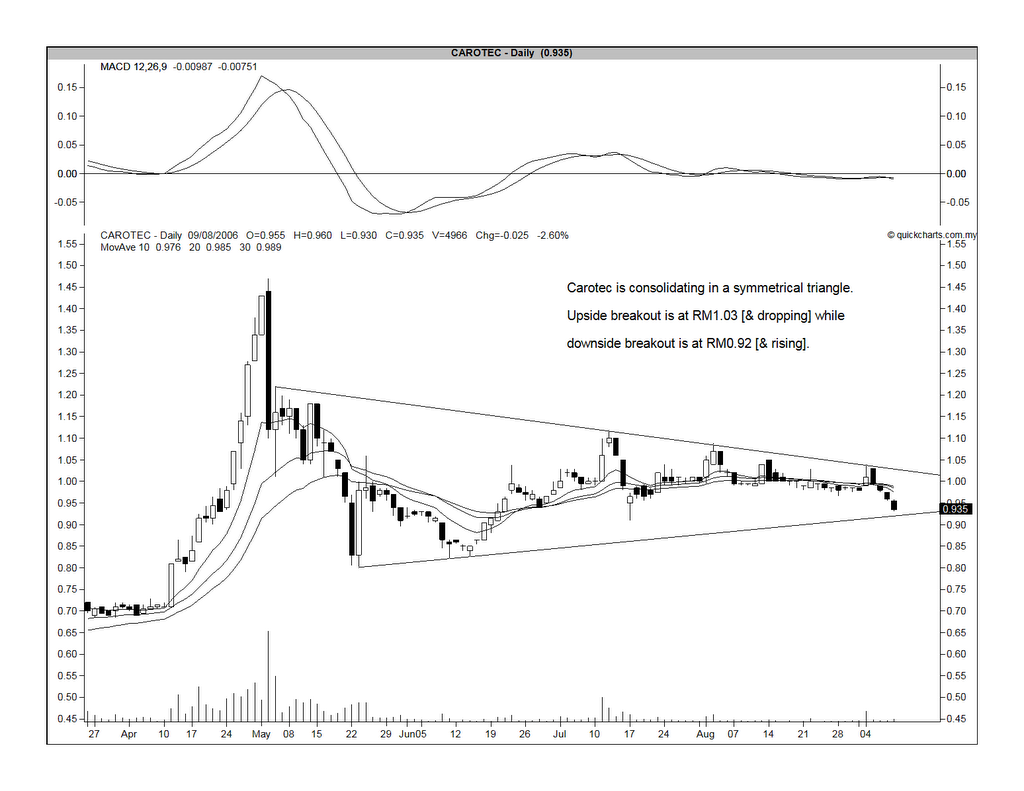
The share price has been consolidating since the May & June selldown. From Chart 2 below, you will notice that the consolidation will only come to an end once the price has broken out of the symmetrical triangle pattern that the share is currently trading in. This morning, the share has broken out of that pattern on the downside [breakout level: RM0.92] when it dropped to a low of RM0.865 at 9.50 a.m. At the time of writing this post [at 11.45 a.m.], the price is at RM0.88. Unless a recovery happens swiftly & the price can recover back to the RM0.92 level, the technicians would view this as a SELL signal.


Chart 2: Carotec's daily chart as at Sep 8

Update made on September 13

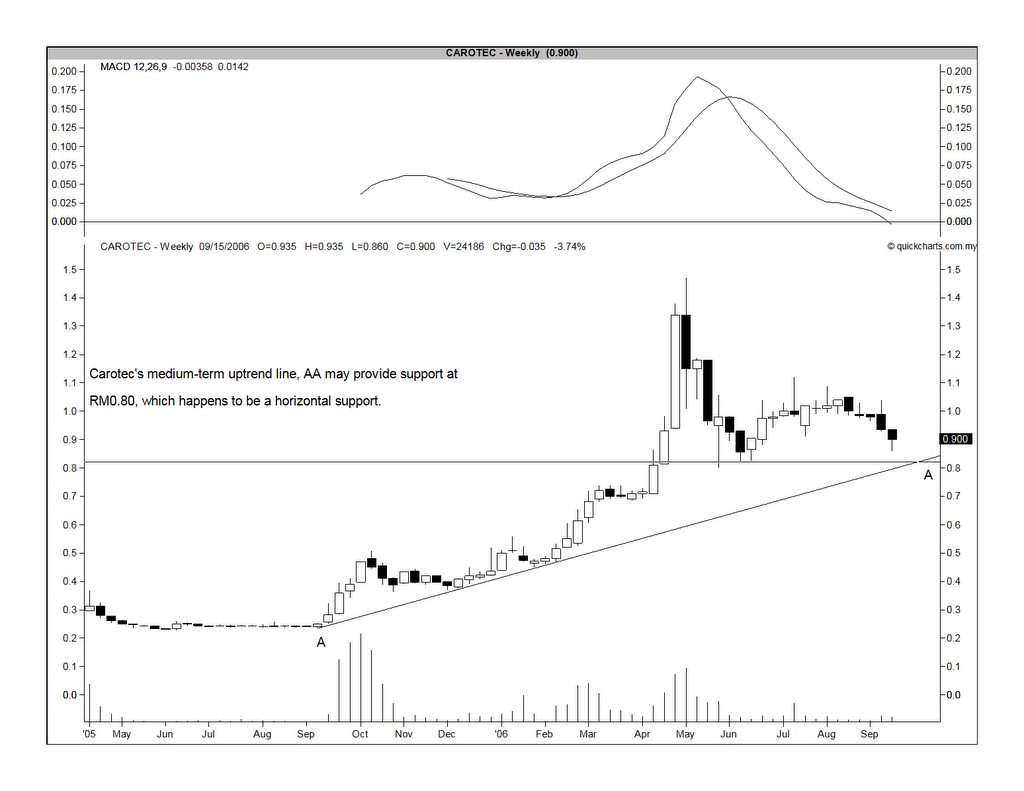
After further study of Carotec's weekly chart, I would revise my assessment of the stock's outlook slightly. The short-term outlook remained unchanged i.e. bearish. Medium-term outlook is still good as its uptrend is still in tact. Only when the share price has broken below RM0.80/82 level would the uptrend line be broken (see Chart 3 below).


Chart 3: Carotec's weekly chart as at Sep 13

Saturday, September 09, 2006

Linkfest

The linkfest for the weekend...

1. Last week, we’ve learned about the discovery of a vast oil deposit roughly four miles beneath the ocean floor in Gulf of Mexico. The discovery has coincided with the on-going correction in the price of crude oil. Some analysts had questioned the impact the discovery on the market sentiment. Roger Conrad of The Utility Forecaster was noted in The Stock Advisors as saying "... even if the deepwater Gulf does ultimately become the North Sea of this generation - which will only be possible if production costs come off sharply and reserves wind up exceeding even today’s most optimistic projections - we still have years to wait before any of its output comes to market. Read more about here.

2. Ticker Sense & Market Talk with Piranha had noted that crude oil had closed below its 200-day moving average on Sep 7. While technicians consider this a bearish sign, they had shown that such prior occurrences, at least going back to 2002, had turned out to be buying opportunity. Go here & here.

3. The best offense is a good defense, especially in the event of an economic slowdown. Here is five ways to recession-proof your portfolio.

4. What do George Lindsay, Terry Laundry & Tom Henderson have in common? They all have their creative way of analyzing the market. Brett Steenbarger has highlighted the work of these 3 persons in an article entitled “3 creative approaches to market analysis

5. Recently, I have turned a bit bearish on the Malaysian stock market because I believe it was about to do a short-term correction. But, there are a lot of people out there who are not only not bullish on our stock market; some are downright bearish on the market. My contrarian instincts always tell me that if too many people are bearish on the market, the downside risk is likely to be limited. In TraderFeed, Brett Steenbarger has warned that you have to be a bit wary when it's popular to be a bear.

6. If you find yourself scrambling to follow any commentary on currencies on CNBC or Bloomberg, this may help.

7. 24/7 Wall St. has spent the last four weeks looking at financial blogs and come up with the Top 20 Best Financial Blogs. You may like to check them out.

8. Many commentators & columnists will tell you that calling the market top is a thankless task. If only we have something like this for the stock market.

9. Finally, on the funnier side, check this out.

Thursday, September 07, 2006

REIT- Which of the listed REITs are attractive?

Background

When you look at the performance of the various classes of assets in the US, you will find that REIT has been a consistence performer in recent years (see Table 1 below).


Asset class proxies: Vanguard REIT ETF, iShares Russell 2000, iShares MSCI Emerging Markets, MSCI EAFE, S&P 500 SPDR, Vanguard High-Yield Corporate, PIMCO EM Bond, Morningstar Short Gov't Category, PIMCO Foreign Bond, iShares Lehman Aggregate Bond, Vanguard Inflation Protected Securities Fund, Credit Suisse Commodity Return Strategy Fund.


The Malaysian scenario

In Malaysia, investors’ acceptance of REIT has been slow due mainly to its unexciting return. To spur the development of REIT as a vibrant class of assets, many measures had been introduced over the years. The recent budget has proposed the followings:

(1) Dividends received by local and foreign individual investors and local unit trusts from listed REITs be taxed at 15 per cent, and for foreign institutional investors at 20 per cent. These incentives will be given for five years; and
(2) The tax treatment for REITs is further improved whereby the undistributed income from REITs is exempted, provided REITs distribute at least 90 per cent of their income.

Current REITs & how they stack up

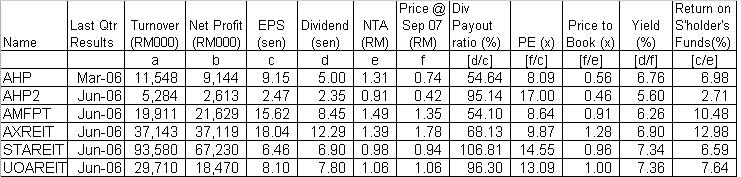
I have tabulated below all the REITs listed on Bursa, except for Tower REIT & Alaqar as their records are too short. The financial results of AHP, AHP2 & AMFPT are based on their latest 4 quarterly results while those of AXREIT, STAREIT & UOAREIT are annualized numbers based on the latest 3 quarterly results in the case of AXREIT & latest 2 quarterly results in the case of STAREIT & UOAREIT.


Table 1: Financial results of all REITs listed on Bursa (excl. TWRREIT & Alaqar)

From this, we can come to the following observations:

1. AHP & AHP2 are trading at substantial discount to their book value. Their Price-to-Book multiples are 0.56 times for AHP & 0.46 times for AHP2.
2. The pricing for AHP2 may reflect its poor Return on Shareholders’ Funds of only 2.71%. This return is computed by using EPS as the numerator & NTA as the denominator. The poor return for the case of AHP2 can also be seen by its high PE of 17.0 times.
3. In term of Return on Shareholders’ Funds, AMFPT & AXREIT are way above the field with 10.48% & 12.98%, respectively. Despite the high return, these 2 REITs are not among those giving the highest Dividend Yield because their Dividend Payout ratios are fairly moderate at 54.10% for AMFPT & 68.13% for AXREIT.
4. STAREIT & UOAREIT, the newest REITs on this table, have very high Dividend Payout ratio of 106.81% & 96.30%, respectively. Because of this, their Dividend Yields at above 7.3% are higher than those of AMFPT (of 6.26%) & AXREIT (of 6.90%).

So, which REITs have good value

I think we can use 2 approaches to pick the better REITs. The first approach is to select those that have the high Return on Shareholders’ Funds i.e. AMFPT & AXREIT. Between them, AXREIT has a slightly higher Dividend Yield of 6.90% as compared to AMFPT’s 6.26%. This is due to AXREIT’s higher Return on Shareholders’ Funds & higher payout vis-à-vis AMFPT. Because of these, the market is prepared to accept a higher Price to Book of 1.28 times to own AXREIT when compared to AMFPT’s Price to Book of 0.91 times.

The second approach is to select those that have low Price to Book i.e. AHP & AHP2. We have already noted the poor Return on Shareholders’ Funds on the case of AHP2. This is not true for AHP, which has a moderate Return on Shareholders’ Funds of 6.98%. This Return on Shareholders’ Funds is comparable to those of STAREIT & UOAREIT but yet, AHP is trading at a Price to Book that is about half of those of STAREIT & UOAREIT. Because of the low Price to Book that the market is prepared to pay to own AHP, AHP’s Dividend Yield of 6.76% is almost at par with that of AMFPT (of 6.9%).

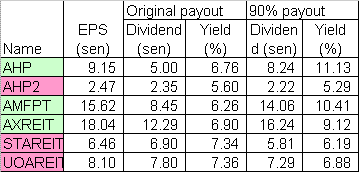
I believe that by using the above approaches, you will find AMFPT, AXREIT & also, AHP are the better REITs. Lastly, I have done a table, where I’ve equalized the dividend payout ratio of all the REITs to 90% of earning and you can see that the Dividend Yield of 3 REITs marked out in green (AHP, AMFPT & AXREIT) would move up sharply while that of AHP2, STAREIT & UOAREIT (marked out in pink) would decline. This shows that AHP, AMFPT & AXREIT have the potential to surprise on the upside.
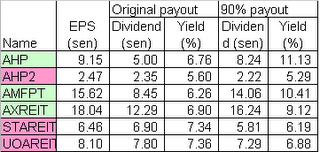


Table 2: REITs' dividend yield (currently & assuming 90% payout)


What if KLCCP & Kassets are REITs?

Some analysts have suggested that KLCCP or Kassets may be used as a benchmark for determining the performance of the REITs listed on Bursa Malaysia. Here, I would like to look at how their bottomlines would look like if they were REITs instead of being normal property investment & development companies (see the Table below).

The table below was computed based on 2 important assumptions i.e. the dividend payout ratio is at 90% & no tax is payable. The original results & the amended results are tabulated together, with the amended results marked out in yellow.



Table 3: KLCCP & KAssets' financial result & projection

From the above, we can observe the following:

1. KLCCP's Return on Shareholders’ Funds (of 10.73%) is about the same as those of AMFPT (of 10.48%) & AXREIT (of 12.98%).
2. Based on a dividend payout ratio is at 90% of earning, KLCCP's dividend yield would be about 11.56%. This would match the dividend yield of AHP (of 11.13%) & AMFPT (of 10.41%), if their dividend payout ratio is at 90%. AXREIT's dividend yield (based on dividend payout ratio is at 90%) would come out slightly short at 9.12%.

Conclusion

AMFPT & AXREIT stand out as the better-managed REITs and more attractively priced. Though AHP's Return on Shareholders' Funds is lower than AMFPT & AXREIT, it is priced accordingly and as such, it is also an attractive REIT.
Crude Oil may go to USD63-65 in the next few weeks

The price of crude oil has continued to slide as geopolitical risk recedes with the conclusion of the senseless war in Lebanon as well as seemingly milder hurricanes in the Gulf of Mexico for this year. The recent discovery of a vast petroleum pool roughly four miles beneath the ocean floor [in the Gulf of Mexico] which could hold between 3 billion and 15 billion barrels of oil and natural gas liquids has not helped the sentiment for crude oil.

From the 3 charts below, we can see that the support for crude oil would lie somewhere between USD63-65 in the comming weeks. From Chart 1, we have plotted the long-term uptrend line for crude oil & we can see support at USD63. From Chart 2 which is overlaid with the Bollinger Bands [20,2] & Parabolic [20,20,200], we see that some support between USD63 & USD65 for crude oil. Finally, the 18-day MA would provide support at USD65.


Chart 1: Crude Oil's monthly chart as at Sep 7


Chart 2: Crude Oil's monthly chart (overlaid with Bollinger Bands & Parabolic) as at Sep 7


Chart 3: Crude Oil's monthly chart (overlaid with 4-, 9- & 18-day MA) as at Sep 7

Plantation may test its ST uptrend at 3688 soon.

Plantation may test its short-term uptrend line at 3688 before the week is out. With bearish divergence in volume as well as the MACD, my gut feeling is that it may break below the uptrend line & thereby, triggering the long-anticipated correction for the sector (see the chart below).


Chart: Plantation's daily chart as at Sep 6

Landmark- what to do next?

Background

On August 21, we have learned that Syed Yusof and parties close to him has sold off their 17% stake in Landmarks at RM2 apiece to Genting Bhd (see my post here). In that post, I’ve made a few assumptions that may not be correct and advised that the better course of action is to take profit on your investment in Landmark. I wonder whether on fuller consideration & better information, I would have recommended a different course of action because the premise of my earlier recommendation to buy Landmark was based on a fight for control. With Genting taking over from Syed Yusof , the fight for control is likely to be over for Genting is unlikely to get into a bidding war in Malaysia. What is left unresolved is why Genting bought into Landmark and that’s a moot point as far as the fight for control of Landmark is concerned.

Technical Outlook

As noted, the share price of Landmark has retraced back quite sharply since August 21 (see the chart below). The followings are noted:

1. Landmark’s medium-term uptrend line, AA may provide support at RM1.40, which also coincides with the strong horizontal support of RM1.40.
2. Landmark’s short-term downtrend line, BB may provide resistance at RM1.58/1.60 in case of rebound.
3. The 10- & 20-day MA may also act as resistance at RM1.65 & RM1.69, respectively.
4. From yesterday’s close of RM1.56, we see the next horizontal support is at RM1.52 while the next horizontal resistance is at RM1.67.

For those who are still long on Landmark & looking to sell, a good level to sell may be given by the short-term downtrend line, BB at RM1.58/1.60 or the 10- & 20-day MA may also act as resistance at RM1.65 & RM1.69, respectively.

For those who are looking for a trading opportunity, you will have to be patient & wait for the price to come closer to the medium-term uptrend line, AA at RM1.40.


Chart: Landmark's daily chart as at Sep 6

Wednesday, September 06, 2006

Public Mutual Fund is the top funds manager

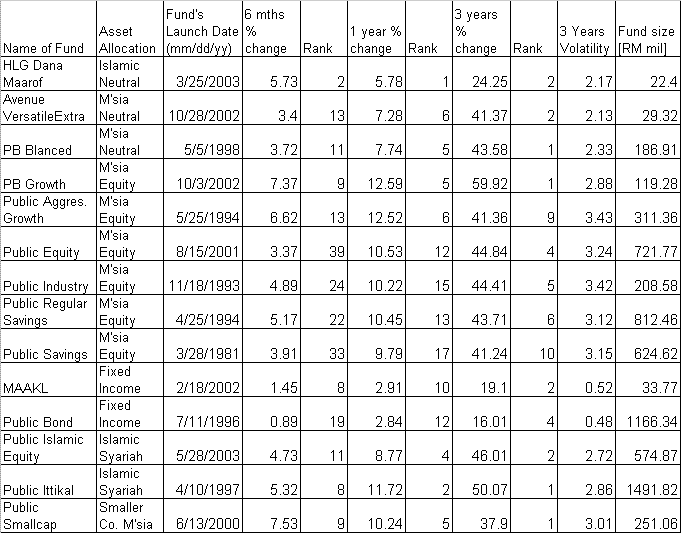
I've looked through the Standard & Poor's Fund Services' weekly table tracking the performance of unit trusts as at August 25, 2006. Something interesting caught my eyes. If you look at the 14 funds that are rated 5-star i.e. the top 10% of their respective sector (see the Table below), you would discover that 11 of them are managed by Public Mutual Funds Bhd. These 11 funds are fairly well distributed in many sectors (or, classes of assets), such as Malaysia Neutral (Equity & Fixed Income), Malaysia Equity, Fixed Income, Islamic Syariah & Smaller Companies Malaysia. Some of the funds were launched long ago, such as Public Savings (launched in March 1981) & some are fairly recent, such as Public Islamic Equity (launched in May 2003).

The out-performance of Public Mutual Funds is even more glaring when you look at the other 3 funds rated 5 stars; they consist are one fund each from MAA, Avenue & HLG. Without doubt, Public Mutual Funds is way, way ahead of its competitors. So, the next time you look for a fund to invest your money, try to pick one from Public Mutual Funds.


Table of Fund's performance as at August 25 from S&P's Fund Services

CI may have put in a top.

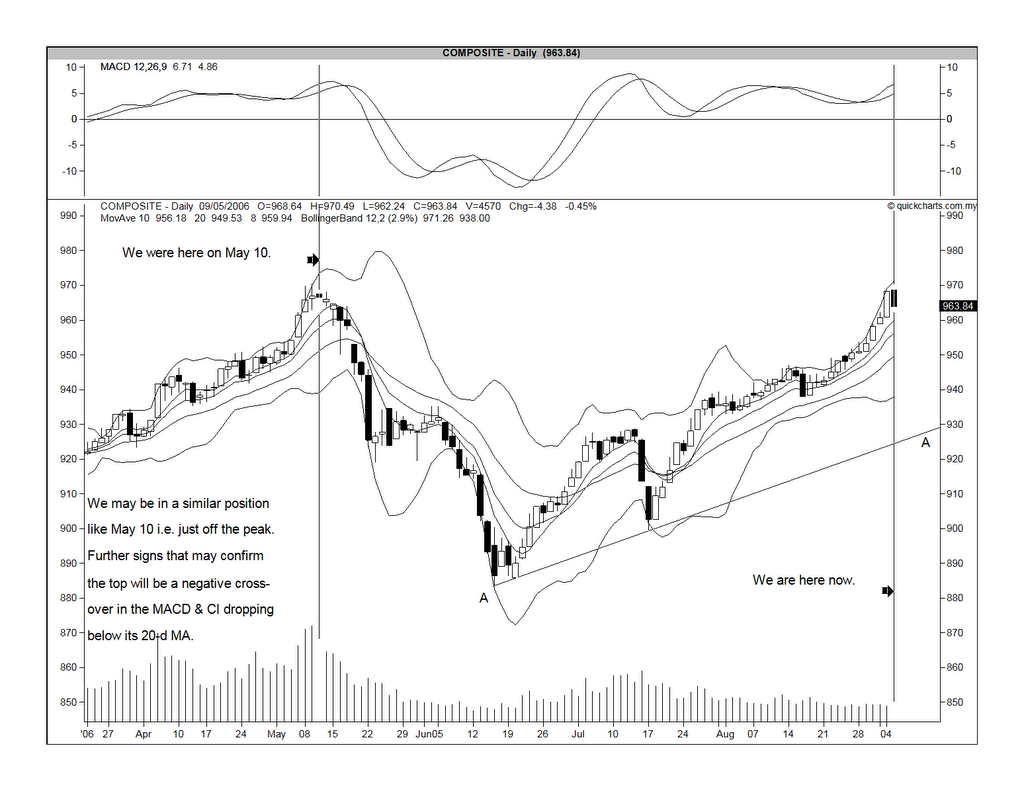
At 11.00 a.m., the CI is down 2.71 points to 961.13. A close study of the chart below has convinced me that the CI is likely to have made a top on Monday & yesterday's market action could be the beginning of a reversal. The CI is currently at a level quite similar to what it was on May 10.

On May 10, the CI had just come off a high of 970, without strong signs that there is any trouble in the horizon other than a slight "hooking-up" of the lower band of the Bollinger Bands. At that point, the CI was still way above its 8-, 10- & 20-day MA. And, the MACD had yet to do a negative crossover. All these are exactly what we have today. So, we can’t say the market has put in a confirmed top but if it follows the same path as before, we may be at the beginning of the reversal.

I have to say that the correction, if it ever happens, may not be as severe as the May & June sell-off. I believe that the likely target for this correction, if it happens, may be around 925-930 levels, given by the tentative uptrend line, AA (see the chart below).


Chart: CI's daily chart as at Sep 5

Tuesday, September 05, 2006

CI is approaching a strong resistance

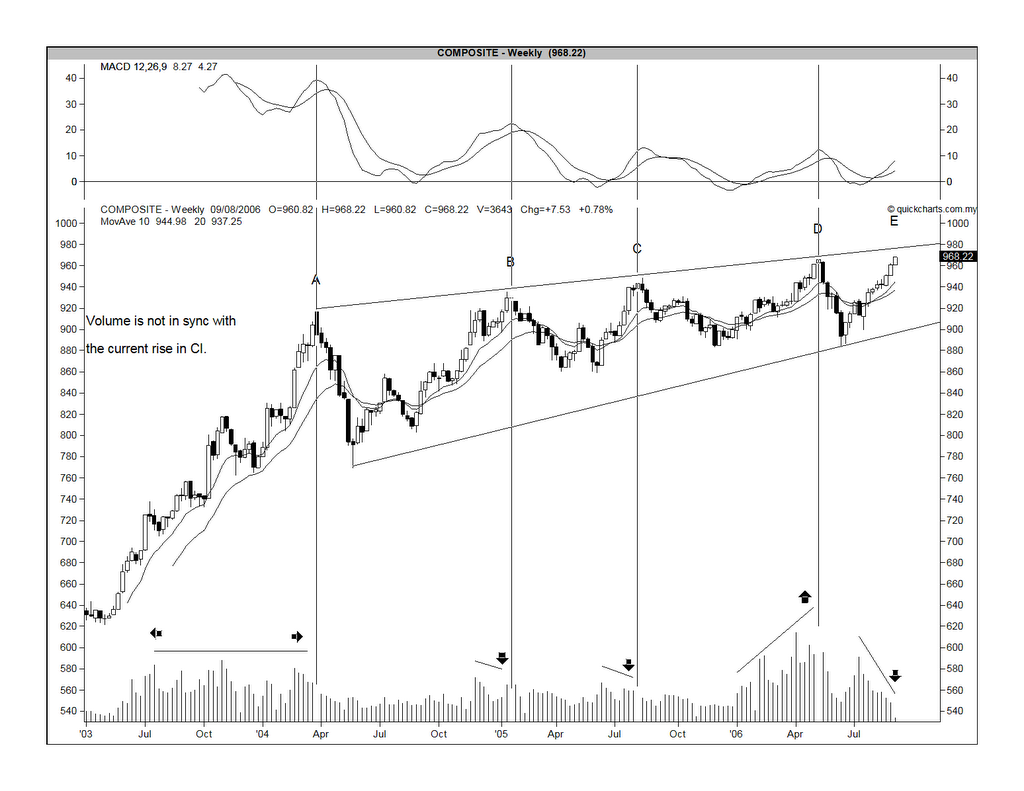
The CI has been climbing a wall of worry for the past 6 weeks. As noted in an earlier post, the CI has been going up on thinning volume (see Chart 1 below). One day after a pretty decent budget that surprises many with a 2%-reduction in corporate tax rate [from 28% to 26%] over 2-year period, the CI responded in a nonchalant manner by doing what it does best i.e. to go up in an unhurried fashion and very little fuss. But, it will have to break out of its current stride soon as it approaches the important level & a pretty strong resistance of 970, which was the high recorded by the CI in May this year. While I am tempted to say that it is quite hard for the CI to break through this level, a quick look at the current CI has convincing me that I am wrong. At 9.10 a.m. this morning, the CI has indeed broken above the 970 level to reach a high of 970.49 before pulling back to 969.84. The CI will go back & forth for the rest of the day & we will have to wait for the final outcome.


Chart 1: CI's daily chart as at Sep 4

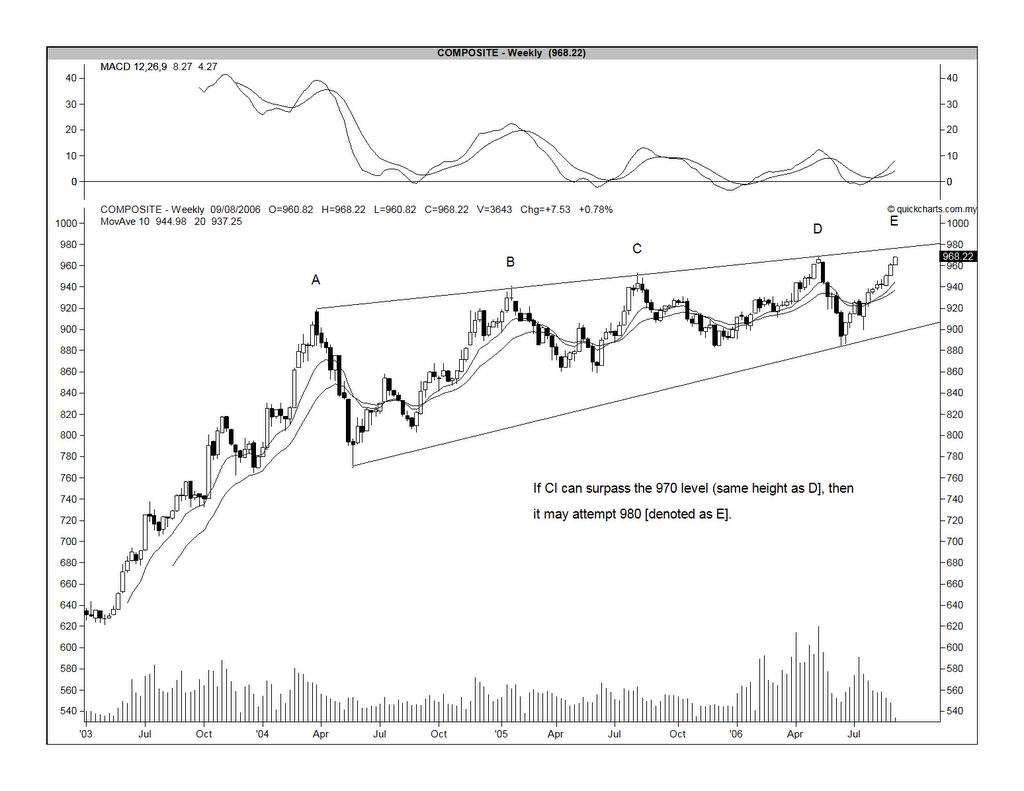
If the CI can surpass the 970 level, it may then test the 980 level. The latter is the resistance posed by the bearish wedge that the CI has been trapped in for the past 2 to 3 years (see Chart 2 below). Also, I have appended Chart 3 where you will see that the divergence between the volume & the index extends to the weekly chart as well.


Chart 2: CI's weekly chart as at Sep 4


Chart 3: CI's weekly chart as at Sep 4

So, for the next few days, we will see whether the CI can surpass the 970 level or not; and if it can do so, whether it will surpass the 980 level or not. I believe that somewhere between 970 & 980, the CI may come to “a bridge too far” & hopefully its retreat will not be too bloody.

Saturday, September 02, 2006

Linkfest

It's weekend and linkfest time again.

1. Most of you must have heard of the term “Peak Oil” and the hypothesis behind "Peak Oil" which basically says that global oil production is now at or near its peak. Once oil production starts to decline, oil shock will follow and the price of a barrel of crude will spiral to $100 or more. Paul Kedrosky presents The Case For and Against "Peak Oil".

2. Bill Gross of Pimco gives an insightful view of the challenging time ahead for American baby boomers.

3. If you have seen the movie “The Perfect Storm”, you will know what rogue waves look like. The Abnormal Returns blog discussed about this in relation to large price movements (in the financial markets), which are more frequent than what the standard finance theory has taught us. “The (excess) returns demonstrate excess kurtosis or ‘fat tails.’ It is in these fat tails where we see destructive market events” or the rogue waves.

4. Todd Harrison, the founder and CEO of Minyanville offers you the five themes that he thinks will manifest in the coming five years.

5. The Confused Capitalist says all you need is a focused portfolio of just 10 stocks. He advises investors “to dive into your own stocks to both cull the weaker positions, and to add to those positions holding the best promise”.

6. Martin T. Sosnoff, the chairman and founder of Atalanta/Sosnoff Capital, which manages assets valued at USD 5 billion, has this to say about “The Inner Game Of Investing”.

Well, that's all for this weekend. Happy reading & Happy Merdeka.

Friday, September 01, 2006

CI going up on thinning volume

The CI has broken above the upward channel at 956 levels on August 30. While the CI may rise to test the May 9 high of 970, there is some concern that this run-up, if it ever happened, would likely to be unsustainable. Why?

The current “rally” since July 18 has been quite different from the rallies in the past 8 months. Unlike the earlier 3 rallies (denoted as A, B & C in the chart below) that were accompanied by increasing volume as the rally progresses, the current rally (denoted as D), is accompanied by decreasing volume. In addition, the MACD indicator has been making lower “peaks” as the index rises. The divergence in both the volume & the MACD indicator when compared to the index raises doubt about the sustainability of the current rally.

As such, I believe that the better strategy is to sell into strength as the CI approaches the 970 levels.


Chart: CI's daily chart as at August 30

Can Java put in another scorching performance like 4Q2006?

Background

Java Inc Bhd (“Java”) is involved in the extraction of timber logs and the downstream activities of manufacturing of wood-based products. This timber operation is located in Sabah, where the group has 2 designated timber concession areas situated into: (1)Kalabakan Forest Reserve, Tawau [measuring approximately 25,000 hectares] and (2)Sungei Pinangah Forest Reserve, Keningau [measuring approximately 6,000 hectares].

Java will be venturing into the cultivation of oil palm in Kelantan when it has completed its acquisition of RSJ Trading, which has signed a 80:20 JV to cultivate oil palm on a piece of land measuring 3,120 acres in Jeli, Kelantan.

Java is the restructured successor of Aokam Perdana. Under the Restructuring Scheme completed in Dec 2004, Java acquired Key Heights (an investment company which owns subsidiaries that are involved in the timber business in the State of Sabah); implemented a 20-to-1 capital reduction; and, undertook a debt-for-share swap, a Right Issue & a Special Issue. After the completion of the Scheme, Java’s ordinary share capital increased to RM141.76 mil. At the same time, it had also issued 23.5 mil ICCPS (or, Preference Shares) and 24.60 mil warrants. Since then, 2.7 mil of the ICCPS had been converted to ordinary shares & as at today, Java’s ordinary shares stands at RM144.46 mil.

Recent Financial Performance

Java has recently announced its results for FYE2006. For the full year, Java’s net profit has declined by 50.8% to RM25.2 mil, which was achieved on the back of a 22.2%-increase in turnover to RM262 mil. The drop in net profit is attributable to an exceptional gain of RM38.6 mil recorded in FYE2005, which resulted from the write-back of provision brought about by the Restructuring Scheme. If this gain is excluded, the net profit has actually improved by 99.6% from RM12.6 mil to RM25.2 mil. I have tabulated Java's past 8 quarterly result in Table 1 below.


Table : Java's 8 quarterly results

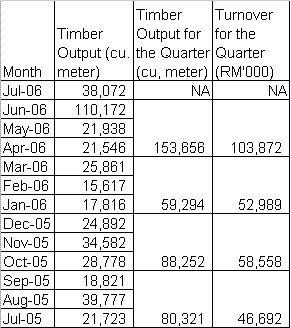
The latest 4Q2006 results show strong improvement in turnover & net profit. Net profit has increased 143% q-o-q or 123% y-o-y to RM13.6 mil on the back of a turnover of RM103.9 mil, which has increased by 96.0% q-o-q or 44.8% y-o-y (see Table 2 below). The good result can be traced to a sharp jump in timber output for the month of June 2006. In that month, timber output was recorded at 110,172 cubic meters, which is almost 3 &1/2 times the average monthly output for FYE2006. The subsequent month of July 2006 saw the output dropped back to 38,072 cubic meters (see Table 3 below). This gives rise to concern that the good result for 4Q2006 may not happen again.


Table 2: Java's latest quarterly results compared.


Table 3: Java's timber output from Jul 2005 to Jul 2006

Valuation

Since there is some doubt as to whether the 4Q2006 performance can be repeated, we shall use the 3Q2006 result as the basis for computing Java's 2007 EPS, which gives an EPS of 15.12 sen. This is deemed conservative since the price of timber logs has firmed up further since 3Q2006. Nevertheless, basing on this figure & Java's closing price at August 30 of RM0.685, Java's PE is only 4.53 times. This compared favorably to its bigger peers like WTK (with PE of 16 times) & Ta Ann (with PE of 13 times). The low PE for Java is probably due to its recent history of being a distressed company. Also, the share may suffer from selling pressure from its former creditors, who were given shares in exchange for debts.

Technical Picture

The chart below shows that Java has been bottoming out since Mar 2006. To go higher, it must surpass the RM0.69/0.70 level convincingly.


Chart: Java's daily chart as at August 30

Recommendation

Java looks like a good Trading stock since it is relatively cheap. Being a timber stock, it may also benefit from the current theme play.