Friday, August 11, 2006

Steel sector theme play may unfold soon

On August 7, I have posted a story from the Edge about the bright outlook for the steel sector. I have looked through the charts of all the big steel players and the following stocks look appealing to me.

1. Southern Steel ("SSteel").

SSteel is still in an uptrend, which began in January this year. The uptrend line support is at RM1.00/1.02. The stock's immediate resistance is at RM1.06. A break above this resistance could signal continuation of its uptrend.


Chart 1: SSteel's daily chart as at August 10

2. Lion Industries ("Lion Ind")

Lion Ind is also in an uptrend, which has commenced in December last year. The uptrend line support is at RM0.83. A break above RM0.90 could signal the continuation of its uptrend.


Chart 2: Lion Ind's daily chart as at August 10

3. Malaysia Steel Works ("Masteel")

Like SSteel & Lion Ind, Masteel is still in an uptrend which began in January 2006. The stock's immediate resistance is at RM0.80. A break above that level could signal the continuation of its uptrend.


Chart 3: Masteel's daily chart as at August 10

4. Ornasteel ("Onastel")

Unlike SSteel, Lion Ind & Masteel, Onastel has broken its uptrend in May this year. It is range-bounced between RM0.80 & RM0.88. Onastel has broken above RM0.88 on August 9. If it can hold above RM0.88, the stock is likely to move higher from here.


Chart 4: Onastel's daily chart as at August 10

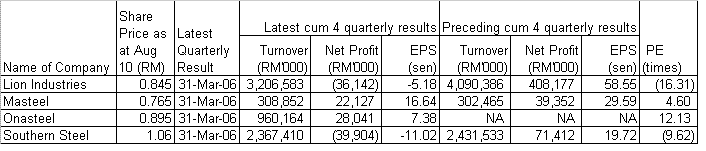
The financial performance of the above stocks are tabulated below:

Golden Hope- a BUY now.

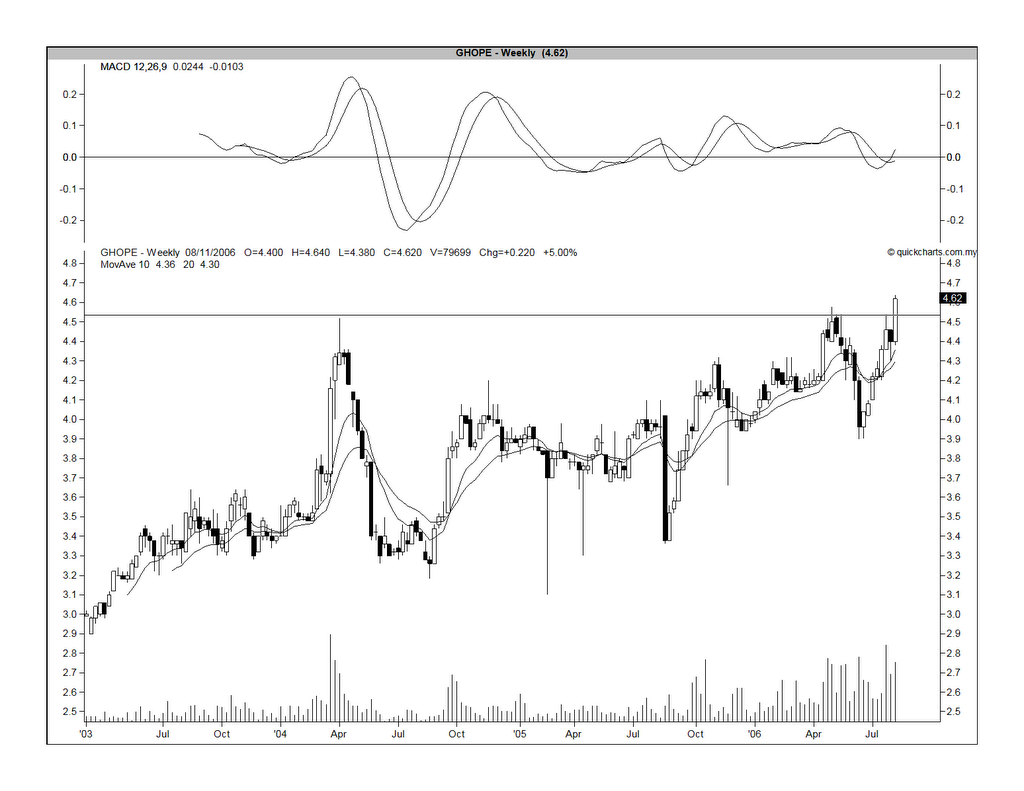
Golden Hope ("GHope") has broken above its strong horizontal resistance at RM4.54 yesterday (August 10). The next resistance will be RM5.30 while the psychological level of RM5.00 will also act as a resistance (see Chart 1 below).


Chart 1: Ghope's weekly chart as at August 10

The monthly chart shows that GHope has actually broken above its long-term downtrend line in January 2004 at the RM3.60 level (see Chart 2 below). With the breaking of the strong horizontal resistance at RM4.54, the stock is likely to go higher.


Chart 2: Ghope's monthly chart as at August 10

Thursday, August 10, 2006

TH Plant- a buy if it breaks above RM2.07

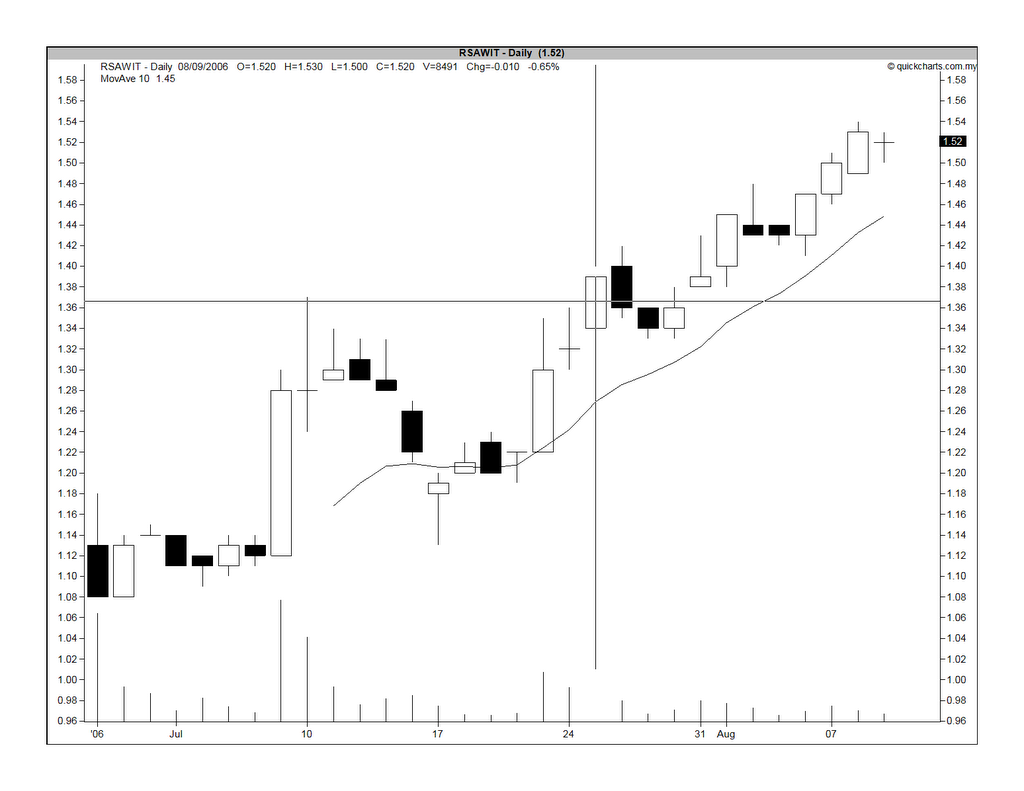
On July 25, I have recommended a trading buy for Rimbunan Sawit after it managed to surpass its recent high of RM1.37 (see Chart 1 below). Since then, Rimbunan Sawit has been inching up slowly. Today, it closed at RM1.54.

Another recently-listed plantation counter that you can look at is TH Plantations Bhd ("THPlant"), which is affiliated to Tabung Haji. THPlant, which has a IPO price of RM1.25, was listed in early May. The stock made a high of RM2.07 on May 8 and today, the share managed to touch that high before retreating to close at RM2.05. I believe that THPlant will soon re-test & surpass this RM2.07 high & then, continue to go higher (see Chart 2 below). Given the current strong play in the plantation sector, I feel that the stock may only pull-back a bit to RM1.98-2.00 level before going again. Then again, it may not pull-back at all. You may choose to buy on a pull-back or on breakout above RM2.07. In any event, it is quite "tradable".


Chart 1: R Sawit's daily chart as at August 9


Chart 1: R Sawit's daily chart as at August 9

Timber stocks are moving up

Timber stocks have been moving upward strongly for the past few weeks. The companies that are likely to do well are those with their own concession areas because demand for logs had picked up strongly and those without concession of their own, would find it hard to get supply for their downstream operation. When you talk about timber stocks, you would be talking about the Sarawak-based companies such as Subur Tiasa, Jaya Tiasa, Ta Ann, WTK & Lingui.

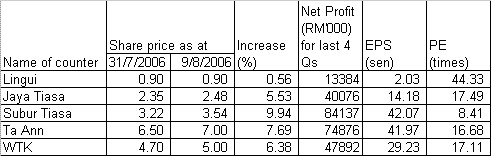
Based on the table below, the stock with the lowest PE is Subur Tiasa (PE of 8.4X) and the one with the highest PE is Lingui (PE of 44X). The reason for Lingui's poor performance vis-a-vis its peer is because it has a planted timber concession in New Zealand which is only beginning to be harvested. This dragged down its net profit but as the trees are now being harvested, its performance may surprise on the upside.

Based on PE consideration, you may want to look at Subur Tiasa. Based on lagged share price performance, Lingui may be a good choice.


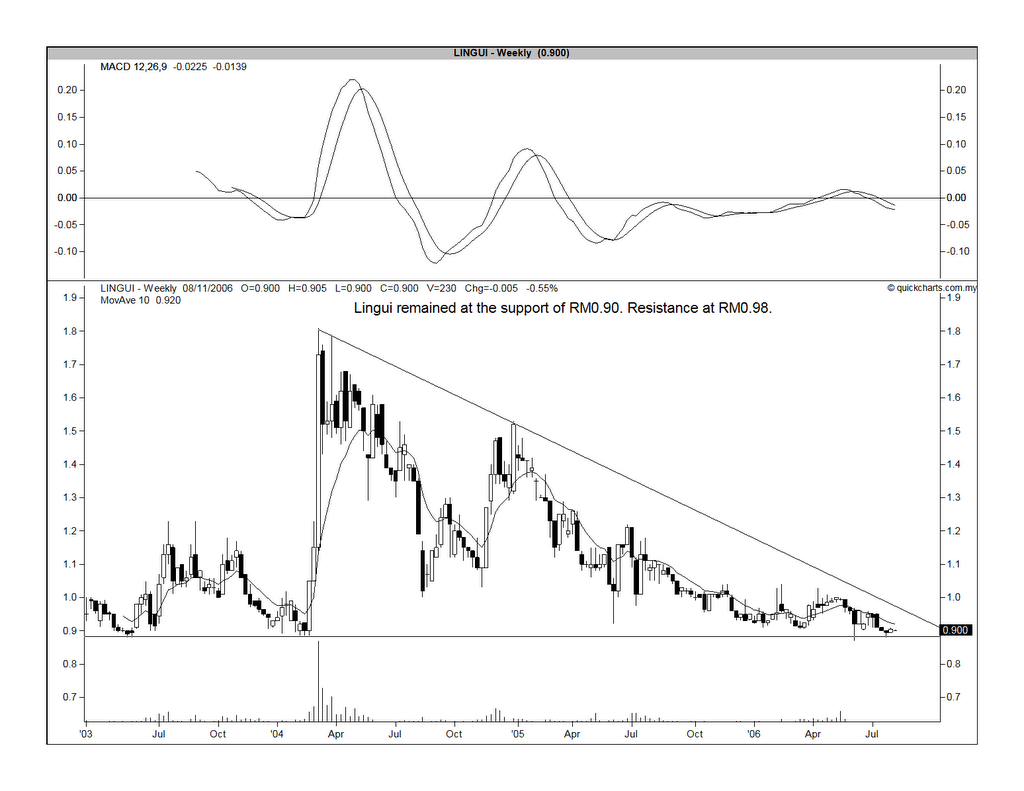
Chart 1: Lingui's weekly chart as at August 9


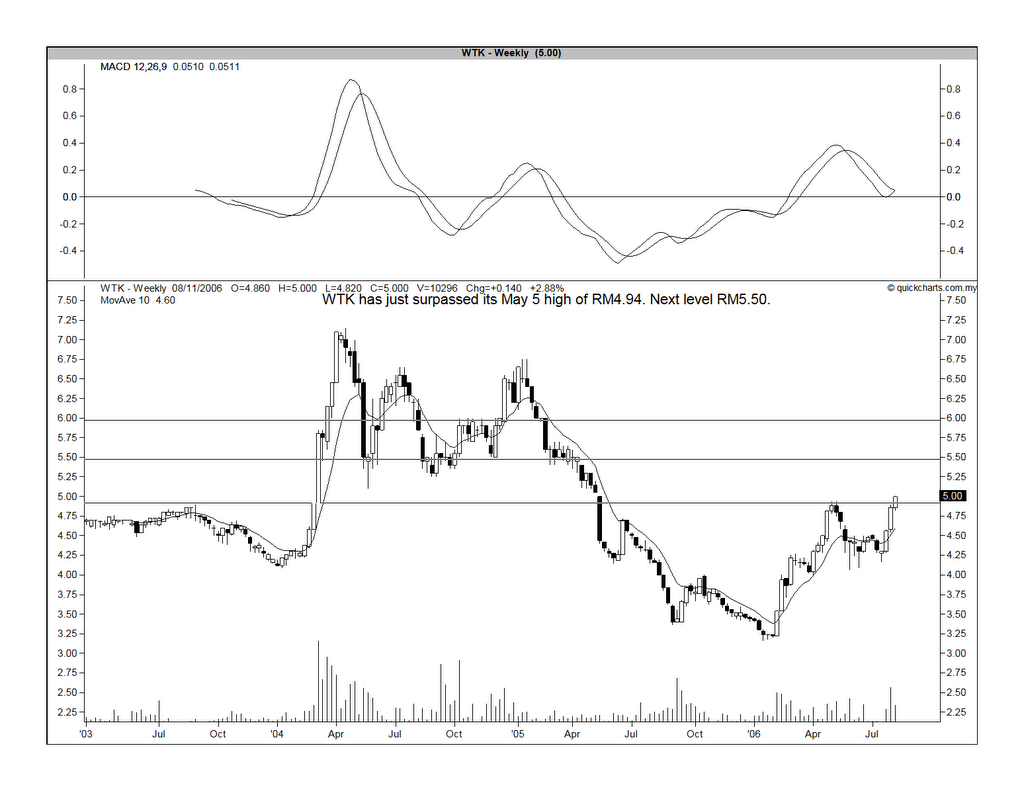
Chart 2: WTK's weekly chart as at August 9


Chart 3: Ta Ann's weekly chart as at August 9


Chart 4: JTiasa's weekly chart as at August 9


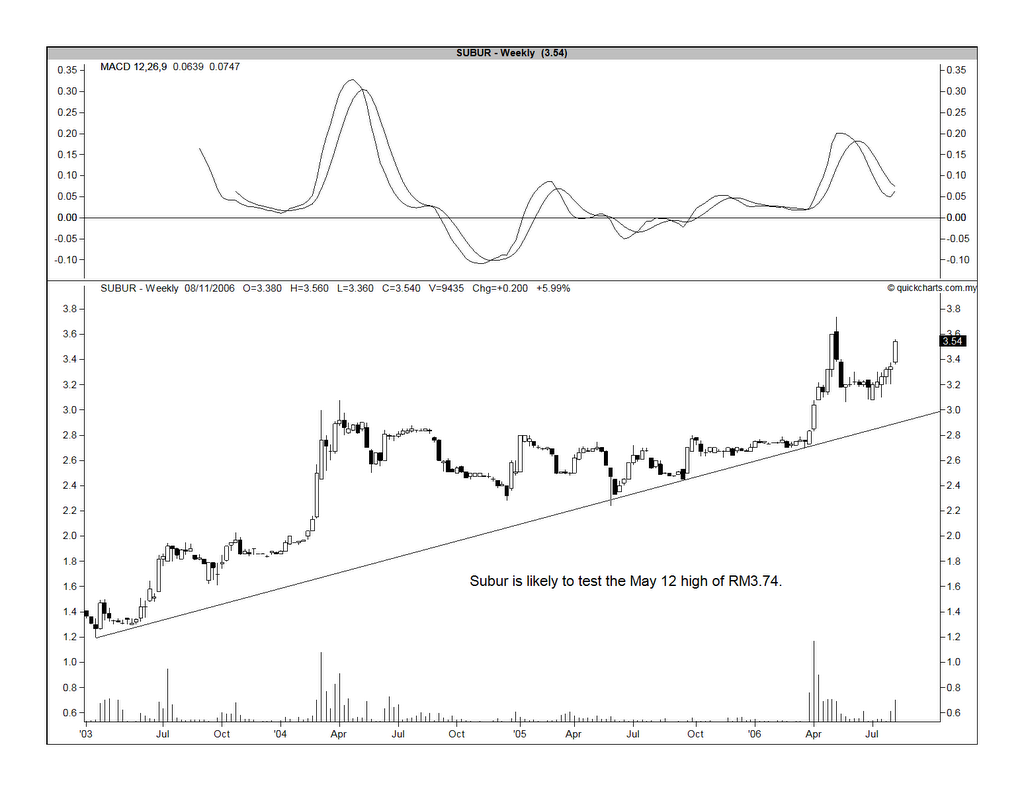
Chart 5: Subur's weekly chart as at August 9

Wednesday, August 09, 2006

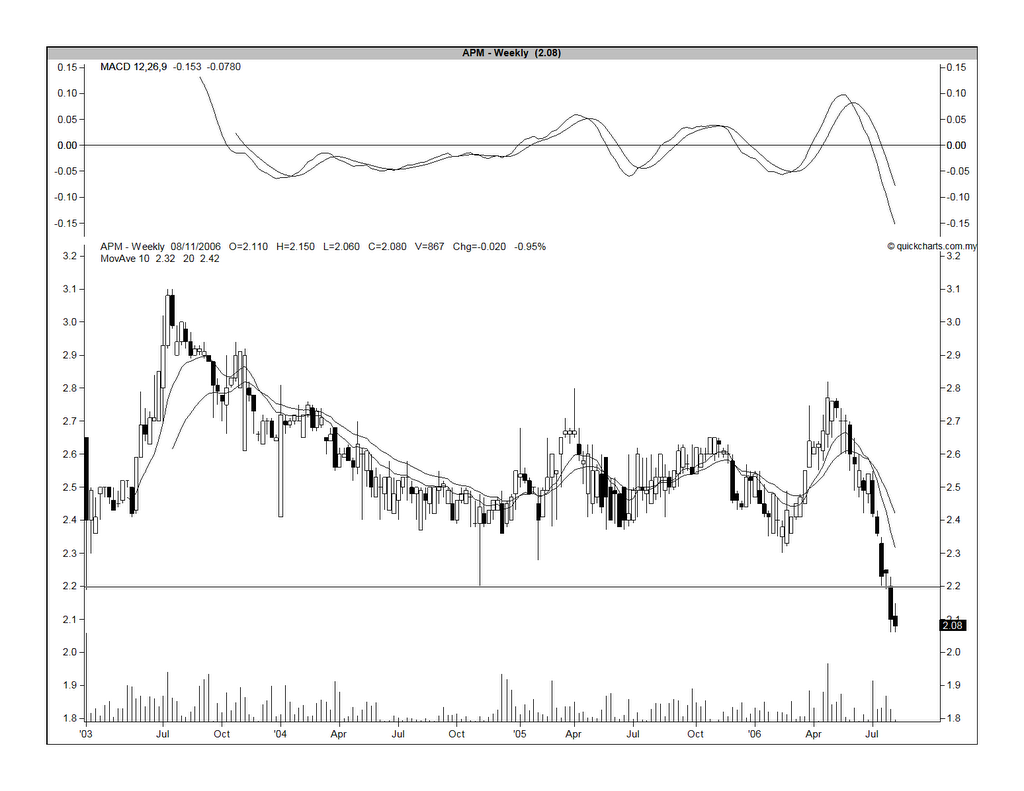
APM broke RM2.20 support, now testing RM2.00 support

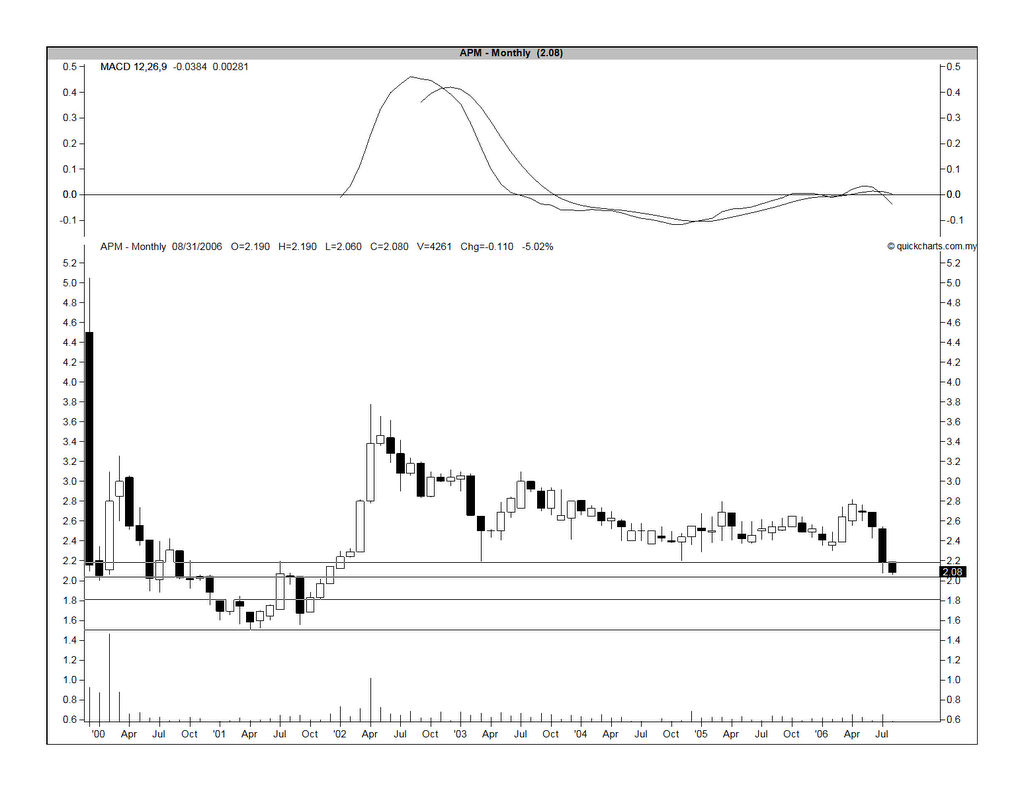
On July 27, I have written about APM coming to a strong horizontal support of RM2.20 and that it might be a good BUY. Unfortunately, APM failed to hold at the RM2.20 level. It has dropped to a low of RM2.00 at 3.00 p.m. today. Looking at the charts below, we can see that the next supports are at RM2.00, RM1.80 and RM1.50.

The decline in APM share price is a reflection of the poor performance of the auto sector in the past few months. For instance, we have a piece of news today in the Edge Daily about Nissan/Edaran Tan Chong Motor Sdn Bhd ("Nissan/ECTM") reporting an 18%-drop in vehicles sales in the second quarter of 2006 (2Q06) to 5,496 units from 6,705 units a year ago due to the instability of used-car prices, more stringent car loan requirements by finance companies, and escalating cost of car ownership. Nissan/ECTM is related to APM. Despite the depressed conditions in the auto sector, a solid company such as APM should be able to survive and, even, prosper. The earlier BUY call, which was based on technical consideration, is however cancelled until clearer signs that the stock has bottomed.


Chart 1: APM's monthly chart as at August 8


Chart 2: APM's weekly chart as at August 8

Fed stops rate hike

The conventional wisdom has it that when the Federal Reserves finally stops its rate hike, the share market will rally. Well, the reality is quite different. In a re-post entitled "Fed Pause Good For Stocks?", the Tinker Sense observed that "...that in the period spanning the Fed's last rate hike to its first cut (average span of six months), the market has an average decline of nearly 7%, and has only risen during two of the nine periods. In the chart below, we created a composite chart of the S&P 500's performance during the 'limbo' period of Fed tightening cycles." See Chart 1 below.


Chart 1: Average S&P 500 Performance from Last Hike of a Tightening Cycle to First Cut in Rates: 1962-2006

Why is that so? In a piece entitled "Betting on Bernanke: Rate Hikes and Reality" in The Stock Advisors, John Bollinger explained that "...both the Fed and the equity markets are forward looking and if the Fed thinks it has strangled the economy sufficiently, the market is not one to argue. A quick check shows that the Fed typically stops raising rates well before the bottom is put in."

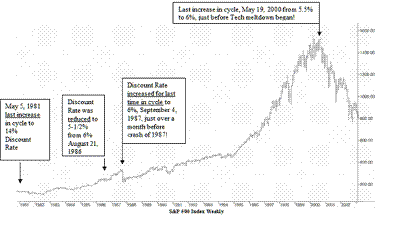
In the same article, John Sheperd cautioned that "...the last increase in a rate cycle is not the time to buy stocks, at least in three of the most dramatic examples in the last twenty-plus years." He has also presented a chart which shows how the market had reacted to a stop in the Fed rate hike in the past 20 years (see Chart 2 below).


Chart 2: S&P 500 from 1981-2003

Tuesday, August 08, 2006

Landmark- The rival removed his gloves?

In the Business Times today, you will find an article entitled "Syed Yusof may reveal bid for Landmarks". As I've said yesterday, Syed Yusof cannot maintain his silence for too long as the proposed private placement could seriously jeopardise his chances of gaining control of Landmark. He needs to come out & stop the proposed private placement. What would be the basis of his objection? Being a shareholder, he has a strong ground to protest a private placement at a big discount of 10% below the market price. However, that will not be enough. He must also protest that the existing shareholders' interest in the company will be diluted by the proposed private placement. Otherwise, the incumbent management can turn around and say "OK, we will do the placement at market price." What then? Well, it is only going to get more interesting over the few days & weeks.

With this latest development, our hope of gaining entry into Landmark at RM1.50/1.52 will likely be dashed. At the end of this morning session, Landmark share price was up 7 sen to close at RM1.69.

Maybulk is poised to do a positive breakout

Maybulk is a shipping company. Its financial performance has been fairly satisfactory but any comparison of its performance in the past 3 quarters with the preceding quarterly results in 2005 will be misleading as the company had locked in a lot of extraordinary profit from the sale of vessels (which value had appreciated considerably) in 2005. The company has been sitting on a cash reserve of RM953 mil as at 31/3/06 and it has just begun to replenish its fleet of vessels after the cost of ship-building has eased off the peak.

From the table below, you can see that Maybulk's past 3 quarters' result, which is free from extraordinary gain from the sale of vessel, has been rising steadily from RM49.9 mil for QE 30/9/05 to RM58.5 mil for QE 31/12/05 to RM67.5 mil for the QE 31/3/06. The result for QE 30/6/06 has yet to be announced but, based on these 3 quarterly results, Maybulk's annualised EPS is computed to be 29.3 sen. At yesterday (Aug 7)'s closing price of RM2.18, the stock is trading at a PE of 7.44 times only.


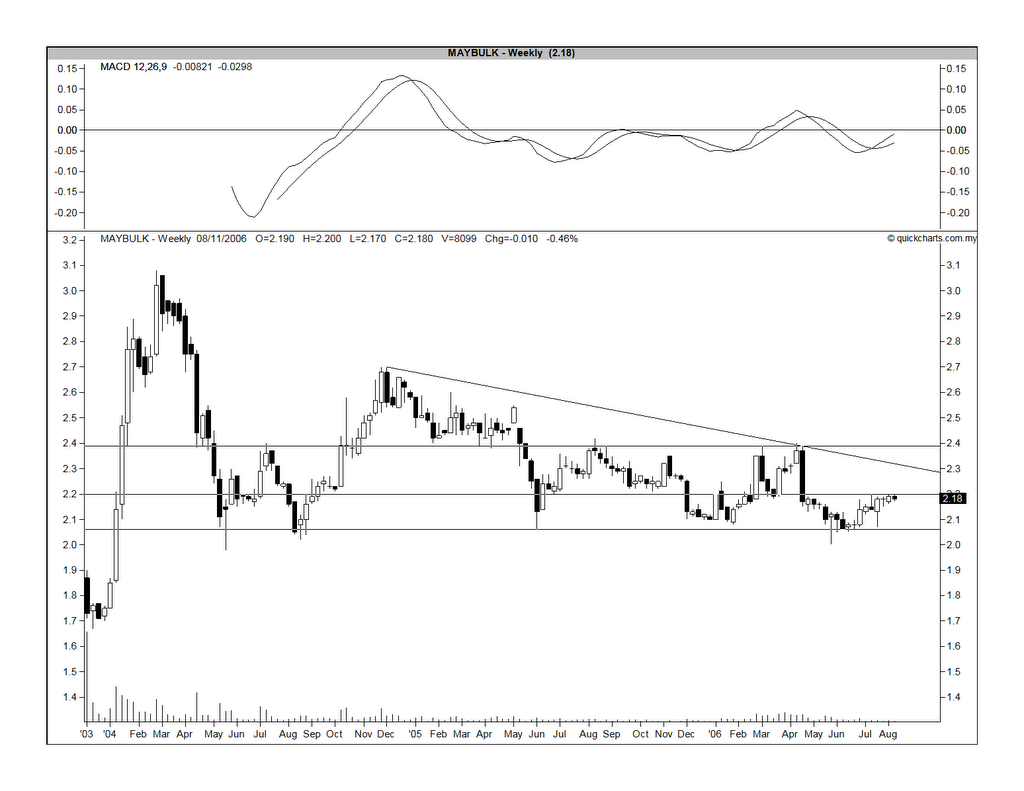
Maybulk gained 11 sen to close at RM2.29 at the end of the morning session. The volume traded is fairly big at 14944 lots as was the volume traded in the past 2 days (8099 lots yesterday & 10546 lots on last Friday). With this morning's price gain, Maybulk has broken above its strong horizontal resistance of RM2.20 (see Chart 1 below). The stock may rise to test the downtrend line resistance of RM2.33 soon (see Chart 2 below). A break above this downtrend line could be the beginning of a new uptrend for the stock. Some horizontal resistances may test this stock at the RM2.35/2.40 level but the critical level to look out for is the RM2.33 level.


Chart 1: Maybulk's daily chart as at August 7


Chart 2: Maybulk's weekly chart as at August 7

Monday, August 07, 2006

From the Edge for w/e 6/13/06

From the current issue of the Edge, we have a story about the positive outlook for the steel players. The steel players are divided into 2 groups i.e. the long-steel products players and the flat-steel products players. In the former group are players like Lion Industries (the owner of Amsteel Mills), Southern Steel, Malayawata, Masteel and Kinsteel. In the latter group are players like Lion Corp (the owner of Megasteel), Ornasteel and Mycron (formerly, Maruichi).

Due to better prices and demand in the past few months, the industry is expected to report better result for the quarter ending June 2006. Long-steel products' prices had increased by more than 10% since March to stabilize at about RM1600 per tonne while flat-steel products' prices had risen by 15% to RM2300 per tonne. So far, only one company has filed in its June quarterly result & that’s Malayawata. It managed to register a 104%-jump q-o-q in its turnover to RM376 mil while its net profit jumped to RM15.7 mil from a mere RM187k in the preceding quarter.

Some of the stocks highlighted are:

1. Masteel

InsiderAsia is positive on Masteel due to its lean balance sheet & above-average operating margins.

2. Southern Steel

Hwang-DBS is positive on Southern Steel as it will benefit the most from the 9MP being the largest long-steel products manufacturer. Also, it produces steel wire-rods which can command better prices as compared to other long-steel products as the selling prices of the latter products are capped by the Government.

3. Ornasteel

This is a favorite of many analysts including iCapital, whose “medium-term buy” call is predicated on greater contribution from the plant expansion, balance sheet strength and good dividend yield of 7%.

Landmark- An epic battle in the making

Not too long ago, a little-known corporate player wanted to sell off his stake in a commercial bank in order to raise funds for the building of a fanciful hotel in a prestigious location in Kuala Lumpur. He approached the major shareholder of the commercial bank with his proposal but the shareholder did not agree to buy his stake (maybe the price was not right). He then offered to sell his stake to an investment bank. The investment bank in question was not any investment bank but it happened to be the most aggressive investment bank on the land. The investment bank accepted the offer and bought the stake from the corporate player and it went on to do something not-so-friendly... it proposed to takeover the commercial bank. Thus, an epic battle followed. After weeks of jousting, the victory went to the investment bank (whose enlarged franchise put it within a stone’s throw of being the biggest financial institution on the land); the commercial banker went into retirement (with a new problem of what to do with his millions) and the corporate player got the money he needed to build his hotel. History buffs will refer to this fight as the Battle for Southern Bank. When the story ended, it seemed like everyone would live happily thereafter.

Now, the corporate player had a change of heart. Why own one fancy hotel when you can own a chain of fancy hotels? Thus, we have another battle in hand…


The Battle for Landmark

What’s the Prize at stake?


An assets-rich company whose assets include a 20%-stake in a Perlis-based IPP (worth about RM160 mil); a 26.6%-stake in Shangri-la (worth about RM195 mil); two 5-star resorts in Langkawi; a 1000-acre tract of land located in Langkawi; and 60% of the floor area of Sg Wang Plaza.

Who are the Players?

The players are divided into 2 camps- the Incumbent Management and the New Investors.

The Incumbent Management includes Datuk Zakaria Abdul Hamid & Lee Tuck Fook, the shareholders of North Symphony Sdn Bhd, which holds 18.65% of Landmark’s shares. Those reported to be allied to them are one Mark Wee Liang Yee from Sarawak (stake in Landmark unknown) and Tan Sri Mohd Razali Abdul Rahman of the Peremba group (whose company, Dynaura Trading Sdn Bhd is reported to be holding a 8%-stake in Landmark). Collectively, the Incumbent controls 26.7% of Landmark.

The new Investors include the corporate player from our earlier story i.e. Datuk Syed Mohd Yusuf Tun Syed Nasir (holding 5.2% of Landmark’s shares). Those reportedly allied to him include one Ong Beng Seng, a property tycoon from Singapore. The New Investors are reported to have more than 25% of Landmark’s shares.

Major Stakes changing hands

Other than the change of ownership in Zimulia Sdn Bhd (which holds the 18.65%-stake in Landmark) from its previous shareholders i.e. Loo Khee Kwong & Harun Halim Rasip to North Symphony Sdn Bhd; the other notable major block changing hands recently include a block of 4 mil shares acquired by the Incumbent from Landmark’s employees (who had acquired the shares earlier under an ESOS). In addition, Landmark is proposing a private placement of 29.53 mil new shares to parties which are believed to be allied to them and, as such, this is looked upon as a move to tighten their grip on Landmark. Another possible avenue for the issuance of new shares may be a deal involving an investment in a gaming resort in Batam. If this gaming deal materializes and if the payment is by way of issuance of new shares, again the Incumbent’s grip may be tightened.

Based on the latest Bursa filing by Landmark, it appears that the company’s public shareholding spread as at 30 June 2006 is 71.48% comprising 24,602 shareholders holding not less than 100 shares each. Obviously, the parties & their associates will not make it too easy for the public to identify how much shares they owned directly or indirectly but the high public shareholding spread clearly indicates that Landmark is not a hard target for a takeover as no particular shareholder has an insurmountable grip on its shares.

If the Incumbent controls enough shares, they may not have to resort to some of the actions that they have undertaken or proposed to undertake such as the buying of employees’ shares or the proposed issuance of private placement shares. On the other hand, the New Investors have yet to make known their intention nor have they shown their hands in anyway including objecting to some of the Incumbent’s moves, which are highly unusual and detrimental to their interests. All in all, I believe the evidence point to a battle for control that could push the share price of Landmark higher than it is currently.

The movement in the share price of Landmark todate says as much about the possibility of a fight to gain control of its shares (see the Charts below). Nonetheless, I think the latest news of the proposed private placement at 10% discount to the market price will cause a temporary depression in the share price and could provide a good opportunity for investors to gain entry into this stock, if they have not done so already.

From Chart 1 below, I have presented the share price of Landmark together with 4 MAs i.e. 10-day MA without any displacement; 10-day MA with -5% displacement; 10-day MA with -8% displacement; and 10-day MA with -10% displacement. In 2 instances of extremely negative events i.e. the non-approval of the Sg Wang REIT on Feb 6, 2006 and the recent selldown of shares by employees in mid-July, we can see that the shares can drop to the level of 10-day MA with -10% displacement. If the current negative news of the proposed private placement is being discounted in the market, I believe the share price of Landmark may again drop to the level of 10-day MA with -10% displacement, which is currently at RM1.50-1.53. I believe this will be a relatively safe entry into Landmark.

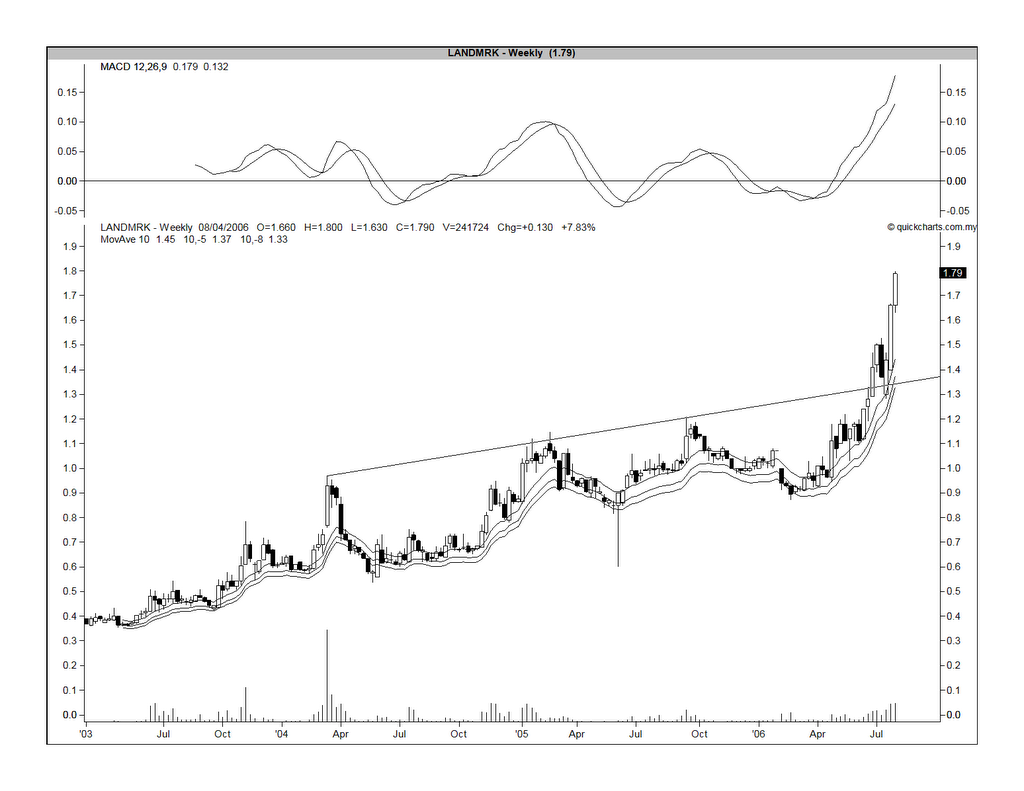
From Chart 2 below, we can see that Landmark has broken above the overhead rising resistance in w/e June 30, 2006. In the event of a sharp correction, this will provide supports to the share at the RM1.35-1.40 level.


Chart 1: Landmark's daily chart as at August 4


Chart 2: Landmark's weekly chart as at August 4

Airasia re-testing its downtrend line

On July 28 & 31, Airasia has re-tested its recent low of RM1.28 made on July 14 & 17; making a marginally lower low of RM1.27 before re-bounding on last Friday (August 4). The downtrend line resistance is at RM1.37 & declining.

Some recent news may be positive for Airasia. Amongst them are:

1. Airasia may tie up with Tiger Air to bid for the KL-Singapore route;
2. Airasia is ordering additional aircrafts;
3. Airasia is targeting to carry 15 mil passengers in 2007; a 67%-increase from 9 mil projected in 2006; and
4. Malaysian Airlines is raising (instead of lowering) their airfares for domestic routes, thus posing less of a threat to Airasia.

A reversal of the current downtrend is deemed completed only if the share price rises above the RM1.37 level. In early trading this morning, the share price rose to a high of RM1.40 before drifting down to RM1.39 at 10.00 a.m. See the daily chart below for the price movement for the past few weeks.


Chart: Airasia's daily chart as at August 4

Friday, August 04, 2006

Linkfest

If it’s weekend, then you know what that means: Linkfest time!

1. In Market Talk with Piranha, you will find a piece about an interview given by Martin “Buzz” Schwart, the author of "Pit Bull: Lessons from Wall Street’s Champion Day Trader". Schwart the trader talked about how he could make “several million” a day by day trading. I must go out & buy his book.
2. There must be times when you don’t feel like participating in a rally, no matter how interesting it may be. Well, Barry Ritholtz (of Big Picture) wrote about a similar experience he is having, right now. He also wrote a piece entitled “Strong Opinions, Weakly Held” which deals with the subject of how a successful investor holds numerous internally conflicting concepts simultaneously.
3. Some morning comments on the trading legend, Jesse Livermore from Ticker Sense. Also, read about Jesse Livermore's 5 money management rules as provided by Leavitt Brothers.

What are we waiting for? Part II

The Medium-term Potential Bullish Case

So the short-term picture is not very exciting for the CI, Mesdaq and Second Board. However, if we look at the Finance & Trading Services indices and the weekly chart for the CI, a slightly different picture would emerge.

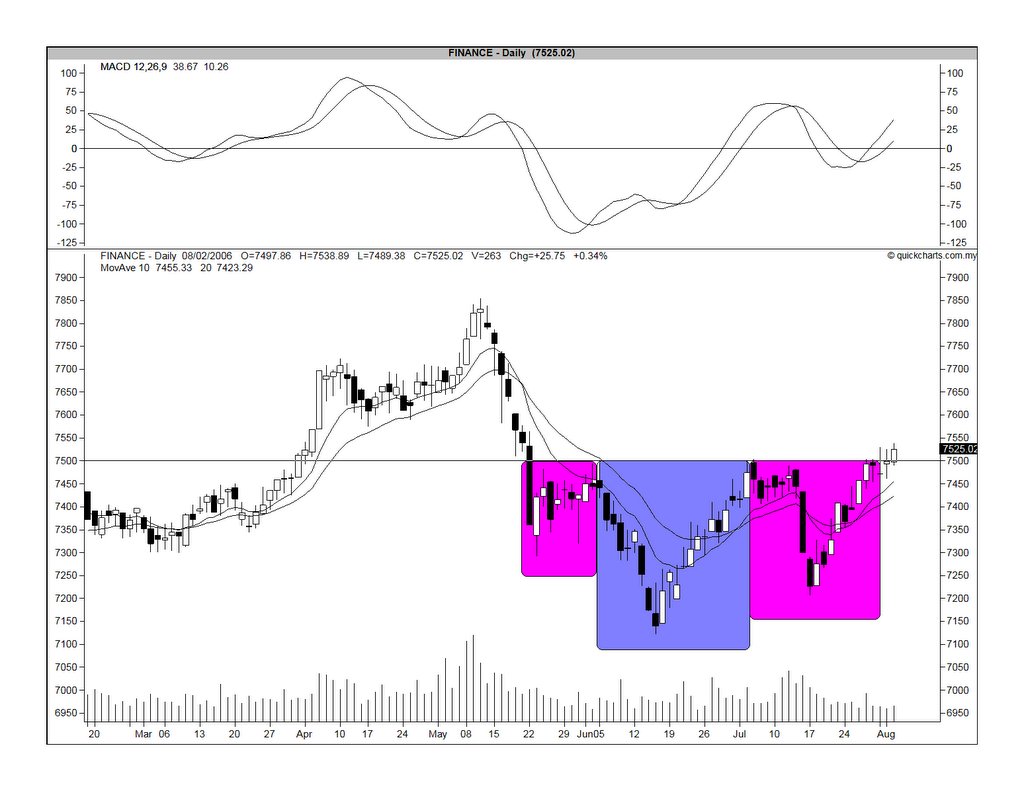
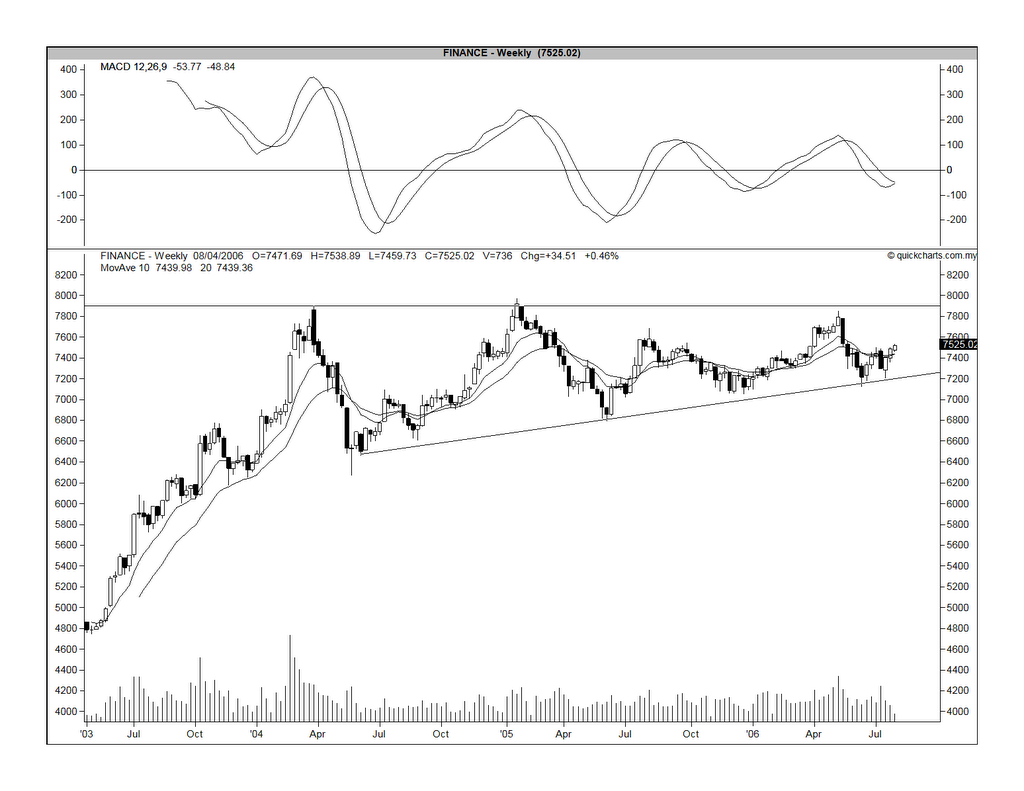
Let’s begin with the Finance sector. Its daily chart (see Chart 1a below) shows a strong resistance at the 7500 level. In fact, this level appears to be a neckline to a potential inverted head & shoulders formation (one of the most reliable reversal patterns). For those who are not too familiar with this pattern, I have highlighted the shoulders in pink and the head in blue. A break above the neckline could send the Finance index to test the 7900/8000 resistance level (see Chart 1b below).


Chart 1a: Finance's daily chart as at August 2


Chart 1b: Finance's weekly chart as at August 2

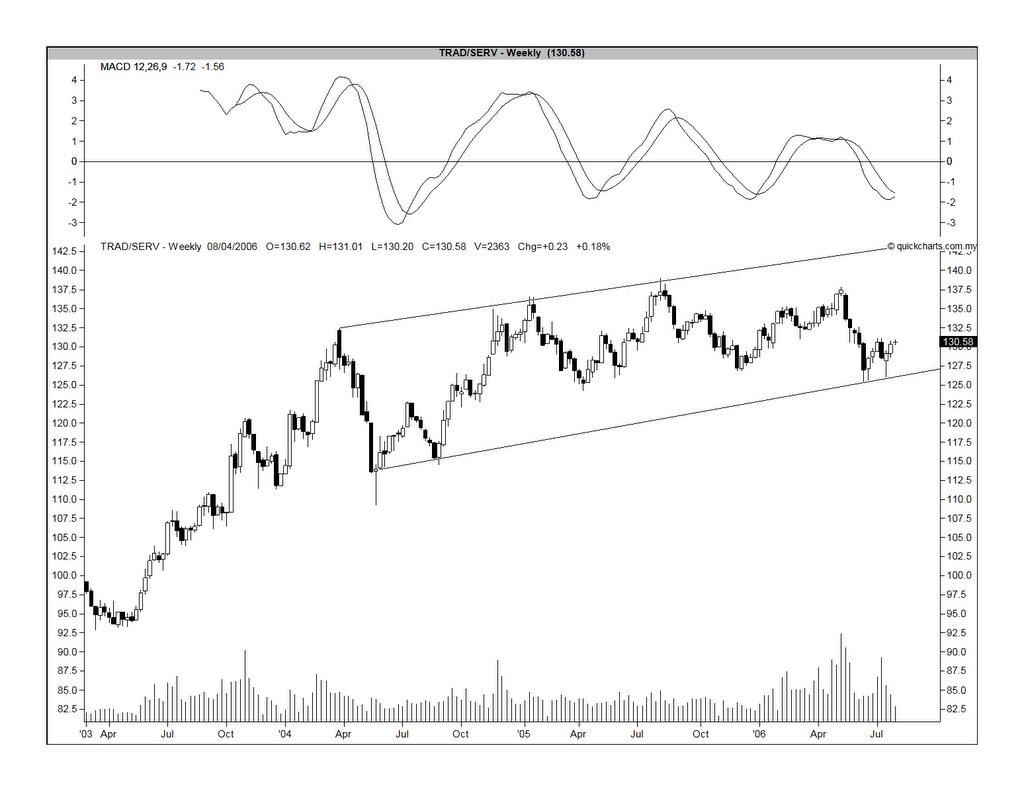
The Trading Services sector appears to be breaking out of an irregular inverted head & shoulders (This may not fit the strict definition of a head & shoulders formation because one of the shoulders is too small, while the other is too big). Nevertheless, any breakout must be accompanied with an increase in volume & that's what is lacking at this moment (see Chart 2a below). It is merely hovering above the breakout level of 131. What's the chart is telling us is that the sellers are not willing to sell at this level (understandable if this is a positive breakout) but the buyers are also not enthusiatic (perplexing if this is a positive breakout). From Chart 2b, it is fairly clear that Trading Services index is relatively weaker than the Finance index. We can see that its recent high in the w/e May 12, 2006 of 137.9 is lower than its preceding high in w/e August 5, 2005 of 139.04 while its recent low in the w/e June 16, 2006 of 125.38 is lower than the preceding low in w/e Dec 9, 2005 of 126.83.


Chart 2a: Trading Services' daily chart as at August 2


Chart 2b: Trading Services' weekly chart as at August 2

The CI's medium-term outlook is shaping up very nicely. From the weekly chart (see Chart 3 below), we can see that the CI's MACD is poised for a positive crossover. This could signal the rally to test the upside of the wedge formation which the CI is in since the w/e Mar 26, 2004. The resistance level would be at 975 and rising.

The next question is how fast will this rally be? You can see from the same chart that a sharp rally, like the Jun-Aug 2005 rally will frizzle out just as quickly. If the rally is slower (like the Sep 2004-Jan 2005 rally or the recent Jan-May 2006 rally), it maybe better as a longer rally allows for greater participation.


Chart 3: CI's weekly chart as at August 3

Finally, let's look at the Plantation index. From the daily chart (Chart 4a below), we can see that the MACD is about to do a negative crossover. The index itself is likely to drift down to test its immediate uptrend line as well as the horizontal support at the 3440 level.

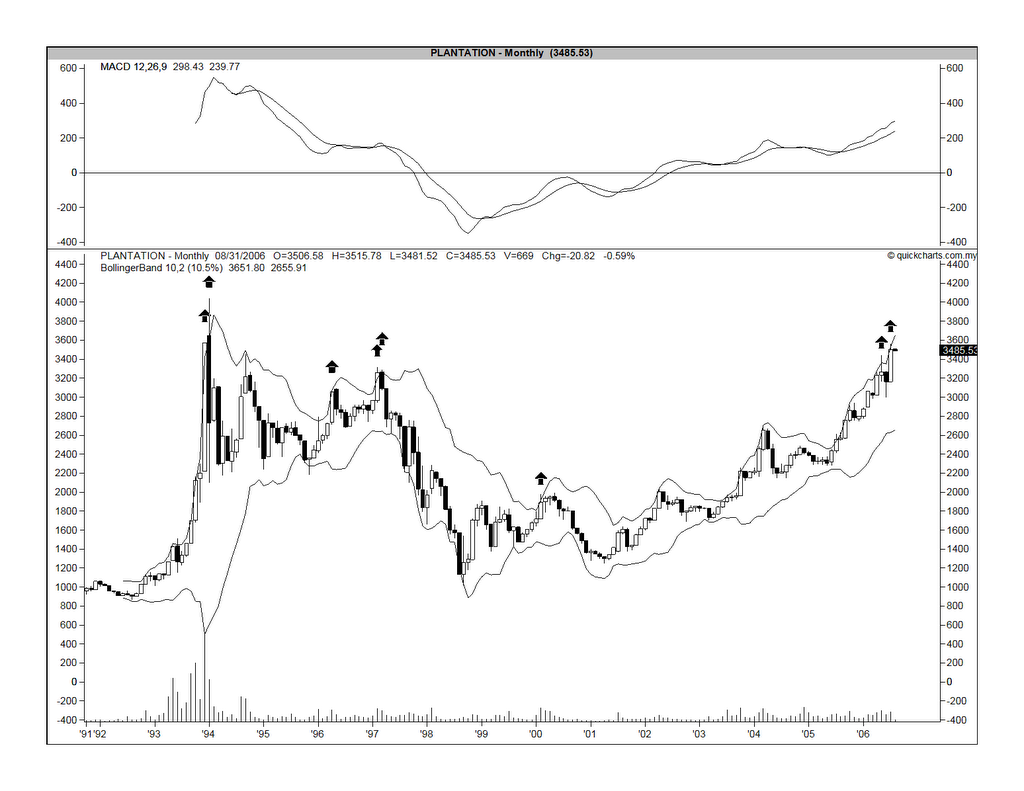
On the monthly chart (Chart 4b), you can see that the Plantation index has overshot the upper limit of the Bollinger Band in May and it is now touching the upper limit again. If you look back over the past 13 years, the few occasions when these had happened, the Plantation index had corrected down soon thereafter. I believe that this time will not be an exception despite the many positive news for the Plantation sector (such as strong prices for CPO and rubber; bio-diesel potential; demand from China & India, etc).


Chart 4a: Plantation's daily chart as at August 3


Chart 4b: Plantation's weekly chart as at August 3

Thursday, August 03, 2006

What are we waiting for? Part I

The Short-term Bearish Case

Someday, the market is so dull that all you can do is just sit there in front of the screen & ponder: "What are we waiting for? What else does the market need? Are we missing something here?"

Before we get to the more interesting (read: speculative) stuffs, let's take a look at the market, now & here.


Chart 1: CI's daily chart as at August 2

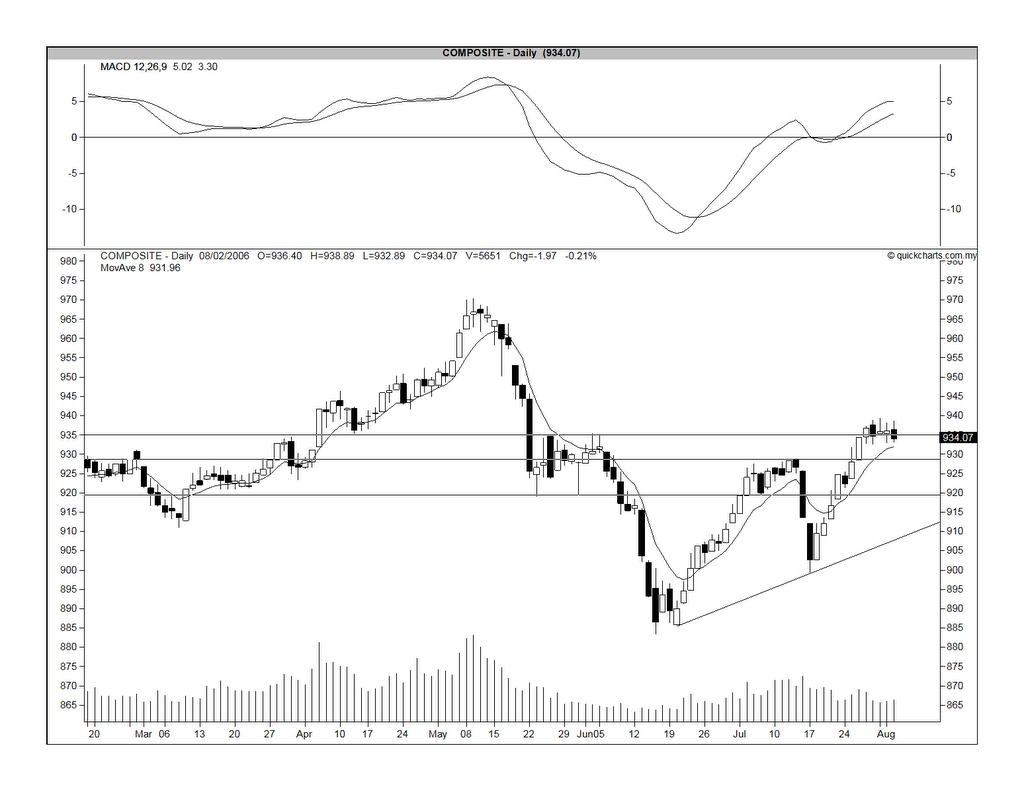
From Chart 1, you can see that the CI is trying hard to stay above the 935 level. It has been here for a good 5 days and it begins to resemble a rounding top. The daily MACD has turned flattish and, any day now, if the CI takes a 5-point drop (or worse), the MACD will do a negative crossover and you will have a SELL signal. The immediate horizontal supports are at 930 & 920. A tentative uptrend line can be drawn & it may provide supports at 915-920.

In Mesdaq, you have a different story. It has pulled back from the recent top but the big question is whether the correction is nearly completed or is there more correction to come. I believe the Mesdaq correction has more room to go. I feel that it is being artificially held up by a few hot stocks; some of which have begun to falter (see Iris, for example) while the rest of Mesdaq counters are devoid of any activity. I would be more comfortable if it were to pull back to the June low of 104 or the immediate uptrend line support near the 100 level (see Chart 2 below).


Chart 2: Mesdaq's weekly chart as at August 3

For some idea of how Mesdaq may perform in the coming weeks, one can take a look at the Second Board (see Chart 3 below). The Second Board is now resting on its horizontal support at the 88 level after making a high of 103.38 on May 9. The next supports are at 83 and 80.


Chart 3: Second Board's weekly chart as at August 3

Unico also has a bullish breakout

Unico-Desa Plantations Bhd ("Unico") is a medium-size plantation company whose share price has been stuck between RM0.48 & RM0.52 for the past 4 months. Its financial performance mirrors its share performance. From the Table below, you can see that the latest 4 quarterly net profit amounts to RM29.4 mil; an increase of only 3.7% from the preceding 4 quarterly net profit of RM28.4 mil. Turnover has in fact dropped 6.9% from RM192.6 mil to RM179.2 mil. As such, EPS has only inched up from 3.28 sen to 3.48 sen.


Based on yesterday (August 2)'s closing price of RM0.54, the share is now trading at PE of 15.4 times. At this multiple & with a dull outlook, Unico is deemed fairly valued. But, the share did a bullish breakout yesterday.


Chart 1: Unico's daily chart as at August 2


Chart 2: Unico's weekly chart as at August 2


From Chart 2 above, you can see that Unico has a strong resistance at RM0.53 level. It broke above this level with very big volume yesterday. Despite these observations, I am a bit apprehensive calling a BUY on Unico because its belated bullish breakout, in the sea of bullish plantation stocks, could well end up as a bull trap. So instead of buying immediately, let's watch it for another day to see whether, on pullback, it can hold above its strong resistance-turned-support level of RM0.53. Only if it can do so, would it be safe to buy into this stock. Target objective is RM0.60-0.65.

Tamcorp did a bullish breakout

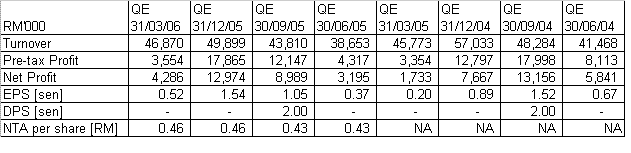
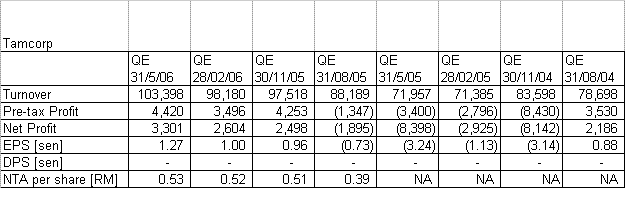
Tamco Corporate Holdings Bhd ("Tamcorp") is involved in the design, manufacturing, installation & distribution of electrical equipment & systems. Its financial performance has improved in the past 1 years (see Table below). Based on the past 3 quarters' EPS that averaged about 1 sen, Tamcorp's full year's EPS would be about 4 sen. Since the share closed at RM0.405 yesterday (August 2), that means Tamcorp is now trading at a PE of about 10 times. That's about fair value for any stock but it may still be considered inexpensive for a Mesdaq counter.


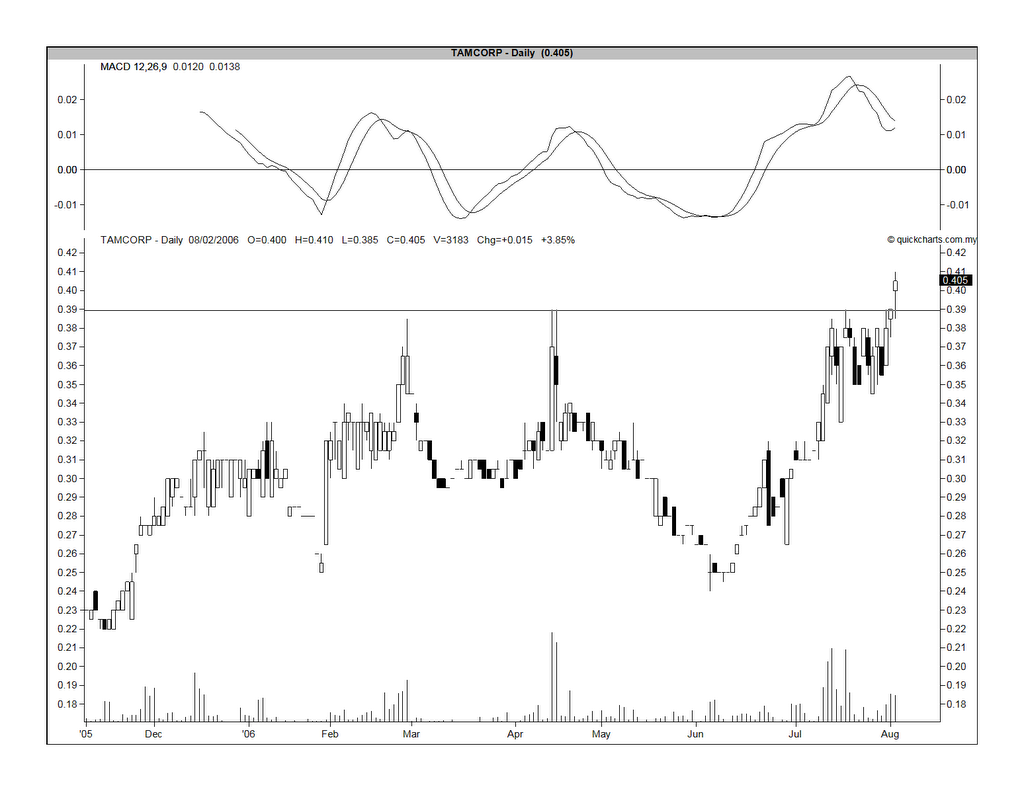
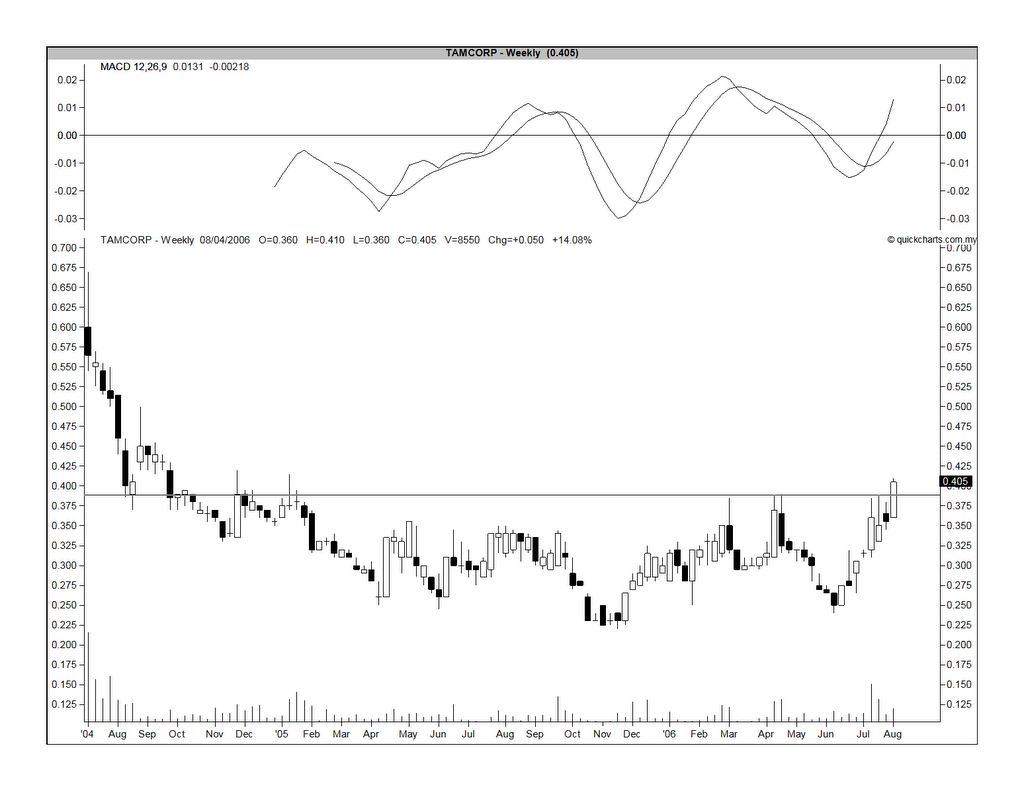
What's interesting is that the share did a bullish breakout yesterday when it surpassed a strong horizontal resistance of RM0.39 (see Chart 1 & 2 below). The only thing lacking is a big increase in volume accompanying the breakout. Nevertheless,based on the bullish breakout, the stock is now a good BUY canditate. Target objective maybe as high as RM0.50-0.55.


Chart 1: Tamcorp's daily chart as at August 2


Chart 2: Tamcorp's weekly chart as at August 2

Wednesday, August 02, 2006

Malayawata posted a substantially better results for 1Q2007

Business Activities & Background Information

Malayawata Steel Bhd (“Malayawata”) is essentially a steel miller producing steel bars & billets. It also has a small oil palm estate and some investment in properties.

Malayawata is a 67.67%-subsidiary of Ann Joo Resources Bhd (“Ann Joo”), a company that is also listed on Bursa Malaysia. Ann Joo has acquired a 30.03% stake in Malayawata in March 2000 from Pernas International Holdings Bhd at a cost of RM201.6 mil (or RM3.33 per share). The stake was subsequently raised to 32.99% as at 31/12/2005 & the average cost was lowered to RM3.06 per share. In October 2005, Ann Joo has made a voluntary offer to acquire all remaining shares in Malayawata at RM1.50 per share. At the close of the offer (in January 2006), Ann Joo has managed to increase it stake in Malayawata to 67.67%. The average cost of Malayawata share in Ann Joo’s book now stands RM2.26.


Past & Future Financial Performance


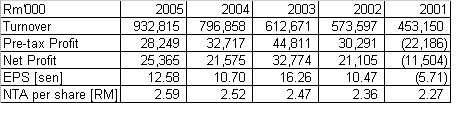
From the above, we can see that Malayawata's turnover has grown at an average compounded rate of 20% from RM 453 mil in FYE 2001 to RM 933 billion in FYE 2005. Except for a loss of RM22.2 mil for FYE2001, Malayawata has been reporting net profit that averages between RM20 mil and 30 mil per annum. Based on S&P's research report dated August 1, Malayawata is expected to report a net profit of RM 33.9 mil for FYE 2007 on the back of a turnover of RM 1.493 billion. 2007 EPS is forecast to be about 16.8 sen.

Current Financial Performance
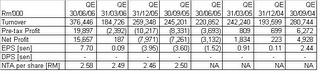


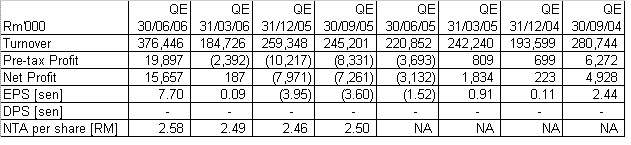
Malayawata reported a substantially better set of result for the QE 30/6/2006. Turnover increased by 104% q-o-q or 70% y-o-y to RM376 mil. Net profit jumped to RM15.7 mil as compared to a mere RM187k in the preceding quarter or a loss of RM3.1 mil in the same quarter last year. Consequently, EPS has also improved to 7.7 sen for the QE 30/6/2006.

From the result announcement, one can see that the jump in the net profit flows directly from the jump in the turnover & it is not due to any extraordinary or exceptional item. The company has also not cautioned the reader that the high turnover may not be sustainable. In fact, the Directors are “optimistic that the Group’s performance for the coming financial period will be better than that of the preceding year”. The only negative things that they have highlighted are the raw material price instability & the impact of the recent electricity tariff hike.

Since the jump in the net profit is so huge; most analysts (including the analyst who prepared the S&P report mentioned earlier) would be hard pressed to raise the net profit & EPS numbers, but by how much? Can Malayawata sustain such a good performance? The S&P analyst has forecast an EPS of 16.8 sen for 2007. Since the EPS for 1Q2007 is already 7.7 sen, the analyst is assuming that the next 3 quarters’ combined EPS to be 9.1 sen or an average of slightly more than 3 sen per quarter. Is that too conservative?

On the other hand, it may be too optimistic to assume EPS for 2007 to be 30.8 sen (4 x 7.7 sen). I am going to assume that the EPS to be the average of this optimistic EPS of 30.8 sen & S&P’s forecast of 16.8 sen. This works out to be 23.8 sen.

Valuation

Based on the closing price as at yesterday (August 1) of RM 1.28 & EPS of 23.8 sen, the stock is trading at a PE of 5.4 times. This is relatively cheap. It is equally cheap when you compare the share price to its book value; giving a price to book of only 0.5 times.

Technical Outlook

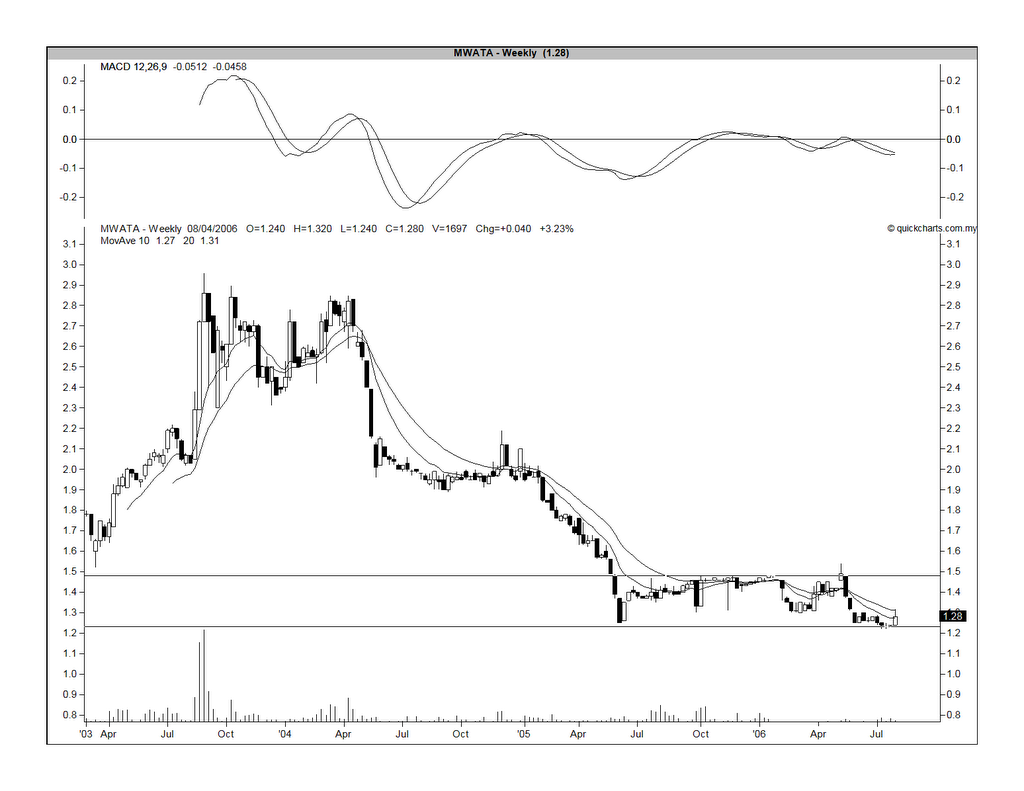
From Chart 1 below, you can see that Malayawata is still in a bottoming process as well as caught in a range between RM1.23 and RM1.48. A break in either direction will point the way forward.


Chart 1: Malayawata's weekly chart as at August 1

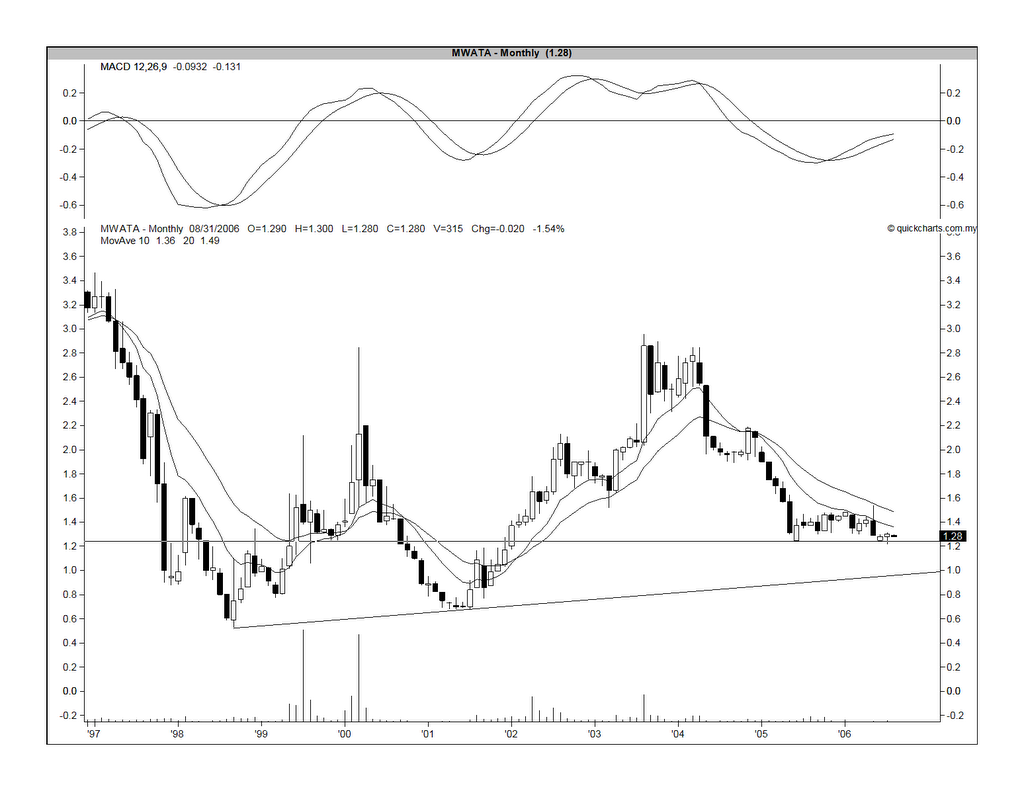
The very long-term chart (Chart 2) saw the stock to be in a gradual uptrend. In addition to the strong horizontal support of RM1.23, the long-term uptrend line support is at RM1.00.
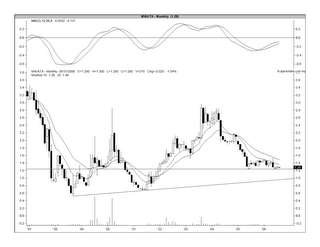


Chart 2: Malayawata's monthly chart as at August 1


Recommendation

Based on relatively cheap valuation, I would recommend a BUY for Malayawata at the current price of around RM1.23. You may do swing trading for this stock i.e. buy near RM1.23 & sell near RM1.48. The stock will only be technically bullish after it has broken above the RM1.48 level.

Tuesday, August 01, 2006

MISC broke above its downtrend line

On June 23, I have highlighted MISC as a stock to watch via an e-mail. To wit,

"MISC has been on an uptrend since July 2003 but this was broken in April 2006. During that period, the share price moved from RM3.70 to a high of RM10.10- gaining RM6.40 or 173%!!! Since the breakdown in April 2006, the share price hit a low of RM7.20 on June 21- giving back 45% of its prior gain of RM6.40. Have the stock reached a level that warrants accumulation?"

Since then, 2 things have happened:

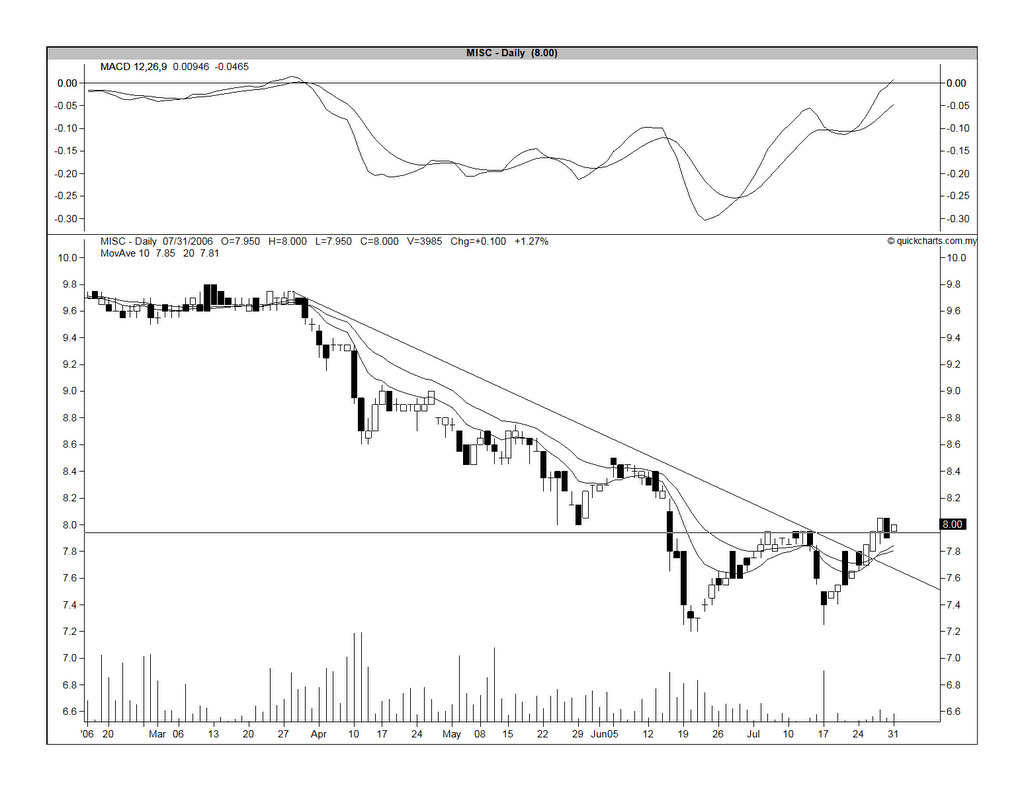
1. MISC has slowly recovered from the low of RM7.20 (done on June 20 & 21) to reach a high of RM7.95 before succumbing to a brief selloff that brought the share price down to a low of RM7.25 on July 1. Thereafter, the share bounced back to break above the downtrend line at RM7.80 on July 25. In the past 4 days, the share has been hovering around the RM8.00 (see the Chart below).


Chart: MISC's daily chart as at July 31


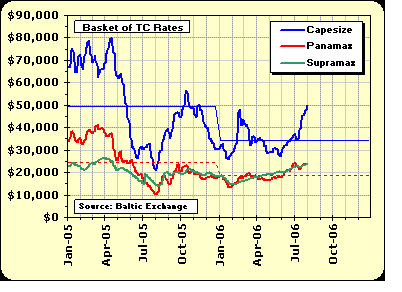
2. The shipping rates have continued to firm up.


Chart for Dry Bulk Markets w/e 28th July 2006


Chart for VLCC/ULCC Markets w/e 28th July 2006

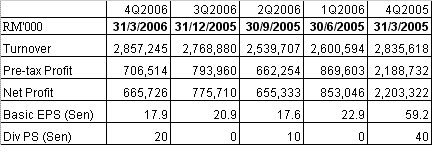
No new financial results were announced since my June e-mail. The latest quarterly result available is for QE 31/3/2006 (see the Table below). To recap, the turnover increased 3.2% q-o-q or 0.8% y-o-y to RM2.86 billion while net profit dropped 14.2% q-o-q or 69.8% y-o-y to RM665.7 mil. The sharp drop in net profit when compared to last year's same quarter is attributable to extraordinary gain in QE 31/3/2005 of RM1.45 billion, which came from the sale of vessels. If this item is excluded, the net profit declined by only 11.1% y-o-y. Based on the cumulative last 4 quarters' EPS of 79 sen and a share price of RM8.05 (closing price on August 1), MISC is now trading at a PE of 10.2 times.


Based on the improving technical outlook for both the share price and the overall shipping rates, I believe MISC share price is likely to go higher.

EON & Proton share a common fate

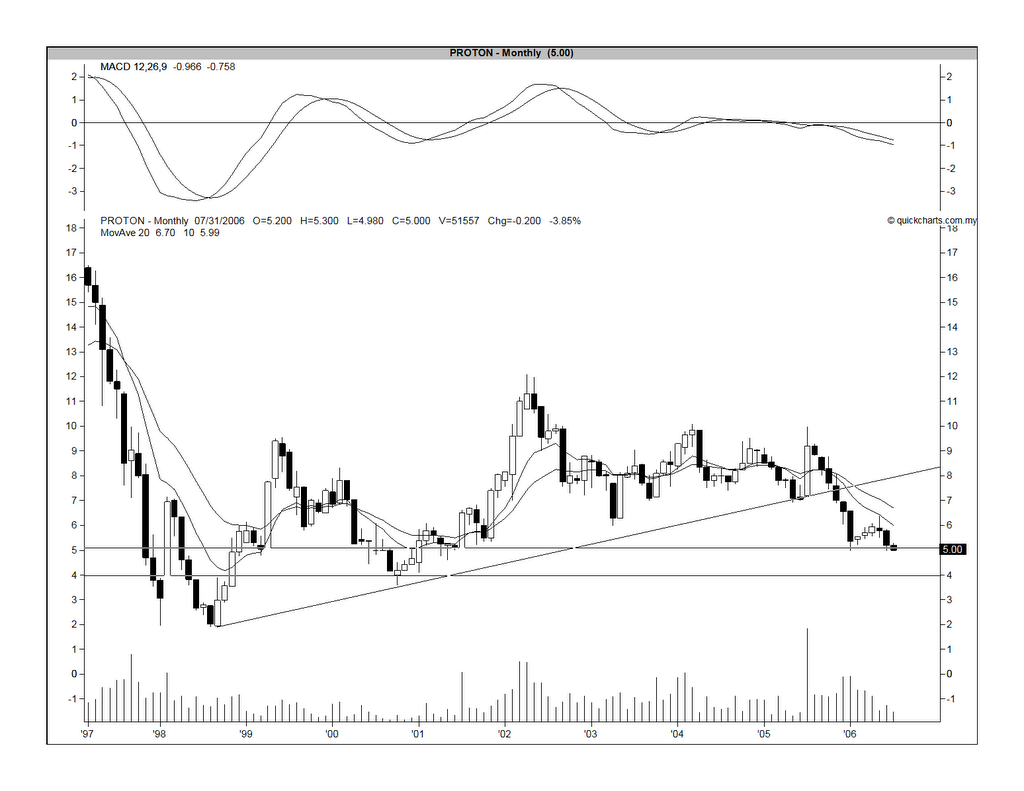
Yesterday (July 31), I've written something on EON & Proton. A study of their charts revealed that investors' perception of both companies are basically negative. Both stocks have broken their very long term uptrend line. For Proton, the break of this uptrend line happened in Nov 2005 while, for EON, the breakdown could have just happened yesterday (see Chart 1 & 2).


Chart 1: Proton's monthly chart as at July 31


Comments: Proton's long-term uptrend that dates back to 1998 was broken in Nov 2005 at the RM7.40 level. The stock has been testing its strong horizontal support of RM5.00 for the past 2 months. A break of the RM5.00 support could easily see Proton going down to RM4.00 or RM3.50.


Chart 2: EON's monthly chart as at July 31

Comment: EON's long-term uptrend also dates back to 1998. The uptrend line support is at RM2.30 but it appeared to be have convincingly broken yesterday when EON dropped 18 sen to close at RM2.07. If no recovery happens soon, we shall consider the uptrend line as broken and the next support would be the horizontal support of RM1.80.

I consider the bulk of the bad news for EON as out while the last shoe may not have dropped for Proton yet. Proton is faced with excess capacity & probably a lot of doubtful assets (i.e. trade debts & investments). A VSS is probably on the way. Further assets write-off is also likely. As such, the share may see further selloff at that point. Only after that, would we see some stability in the share price of Proton. A recovery in the share price of both EON & Proton is however a diferent matter & for that, you would require clearer signs that EON & Proton's futures are built on firmer foundation than what they have today.