So the short-term picture is not very exciting for the CI, Mesdaq and Second Board. However, if we look at the Finance & Trading Services indices and the weekly chart for the CI, a slightly different picture would emerge.
Let’s begin with the Finance sector. Its daily chart (see Chart 1a below) shows a strong resistance at the 7500 level. In fact, this level appears to be a neckline to a potential inverted head & shoulders formation (one of the most reliable reversal patterns). For those who are not too familiar with this pattern, I have highlighted the shoulders in pink and the head in blue. A break above the neckline could send the Finance index to test the 7900/8000 resistance level (see Chart 1b below).
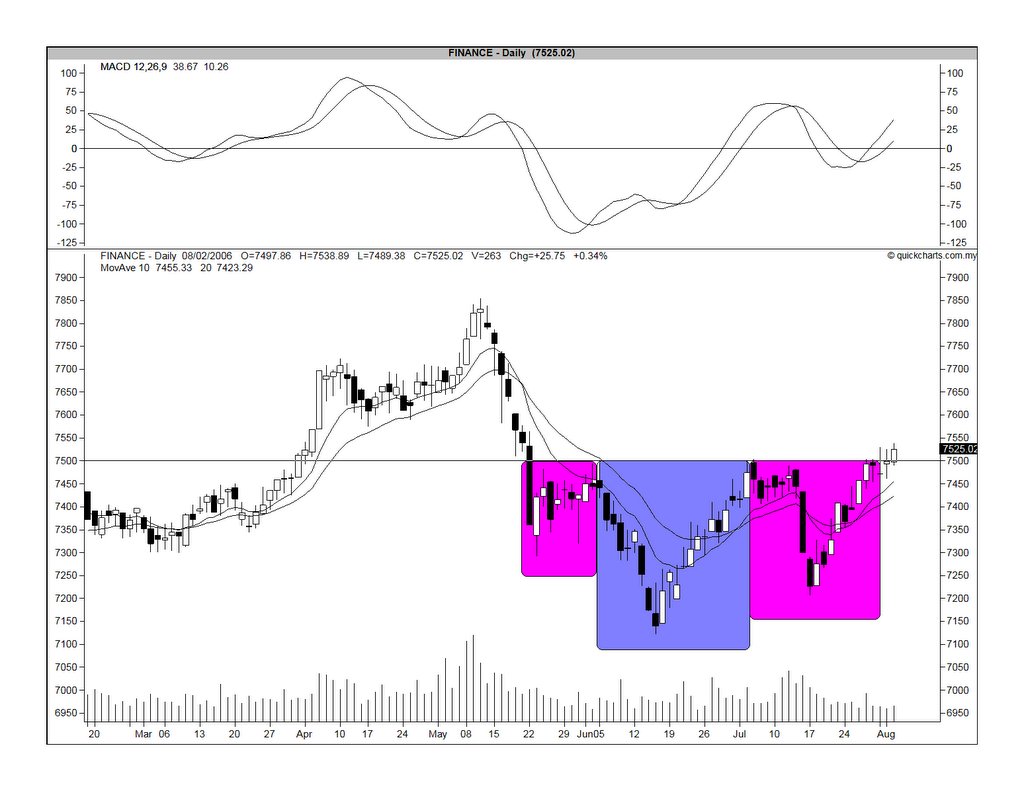
Chart 1a: Finance's daily chart as at August 2
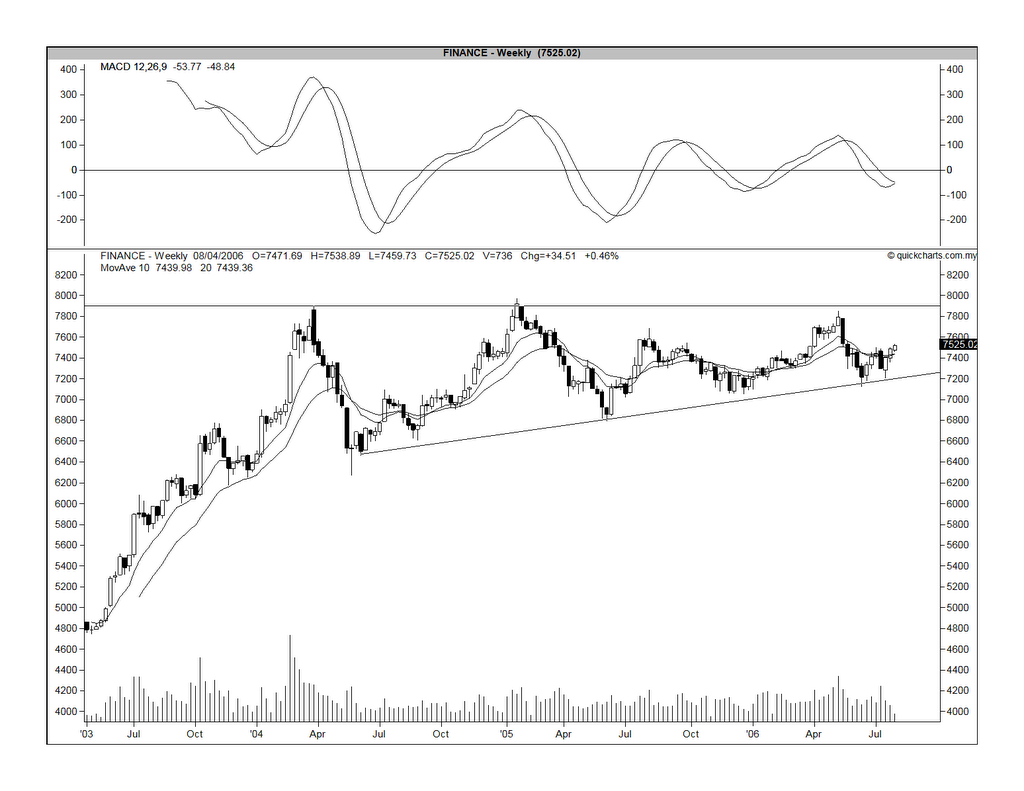
Chart 1b: Finance's weekly chart as at August 2
The Trading Services sector appears to be breaking out of an irregular inverted head & shoulders (This may not fit the strict definition of a head & shoulders formation because one of the shoulders is too small, while the other is too big). Nevertheless, any breakout must be accompanied with an increase in volume & that's what is lacking at this moment (see Chart 2a below). It is merely hovering above the breakout level of 131. What's the chart is telling us is that the sellers are not willing to sell at this level (understandable if this is a positive breakout) but the buyers are also not enthusiatic (perplexing if this is a positive breakout). From Chart 2b, it is fairly clear that Trading Services index is relatively weaker than the Finance index. We can see that its recent high in the w/e May 12, 2006 of 137.9 is lower than its preceding high in w/e August 5, 2005 of 139.04 while its recent low in the w/e June 16, 2006 of 125.38 is lower than the preceding low in w/e Dec 9, 2005 of 126.83.

Chart 2a: Trading Services' daily chart as at August 2
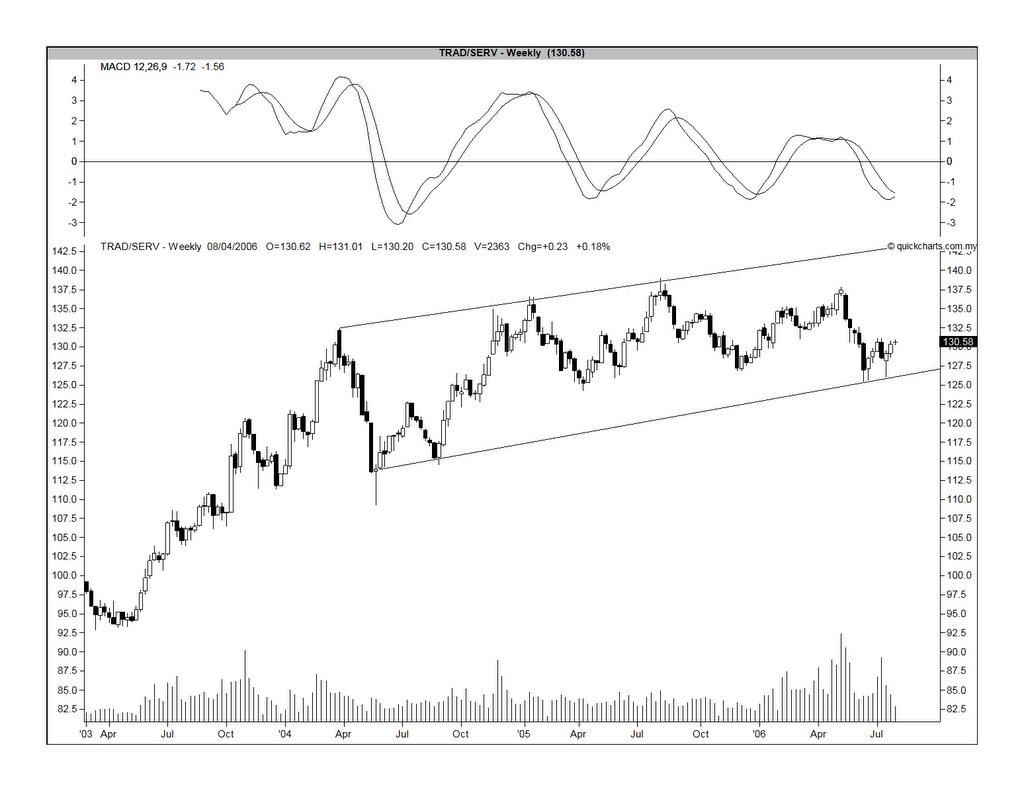
Chart 2b: Trading Services' weekly chart as at August 2
The CI's medium-term outlook is shaping up very nicely. From the weekly chart (see Chart 3 below), we can see that the CI's MACD is poised for a positive crossover. This could signal the rally to test the upside of the wedge formation which the CI is in since the w/e Mar 26, 2004. The resistance level would be at 975 and rising.
The next question is how fast will this rally be? You can see from the same chart that a sharp rally, like the Jun-Aug 2005 rally will frizzle out just as quickly. If the rally is slower (like the Sep 2004-Jan 2005 rally or the recent Jan-May 2006 rally), it maybe better as a longer rally allows for greater participation.

Chart 3: CI's weekly chart as at August 3
Finally, let's look at the Plantation index. From the daily chart (Chart 4a below), we can see that the MACD is about to do a negative crossover. The index itself is likely to drift down to test its immediate uptrend line as well as the horizontal support at the 3440 level.
On the monthly chart (Chart 4b), you can see that the Plantation index has overshot the upper limit of the Bollinger Band in May and it is now touching the upper limit again. If you look back over the past 13 years, the few occasions when these had happened, the Plantation index had corrected down soon thereafter. I believe that this time will not be an exception despite the many positive news for the Plantation sector (such as strong prices for CPO and rubber; bio-diesel potential; demand from China & India, etc).

Chart 4a: Plantation's daily chart as at August 3
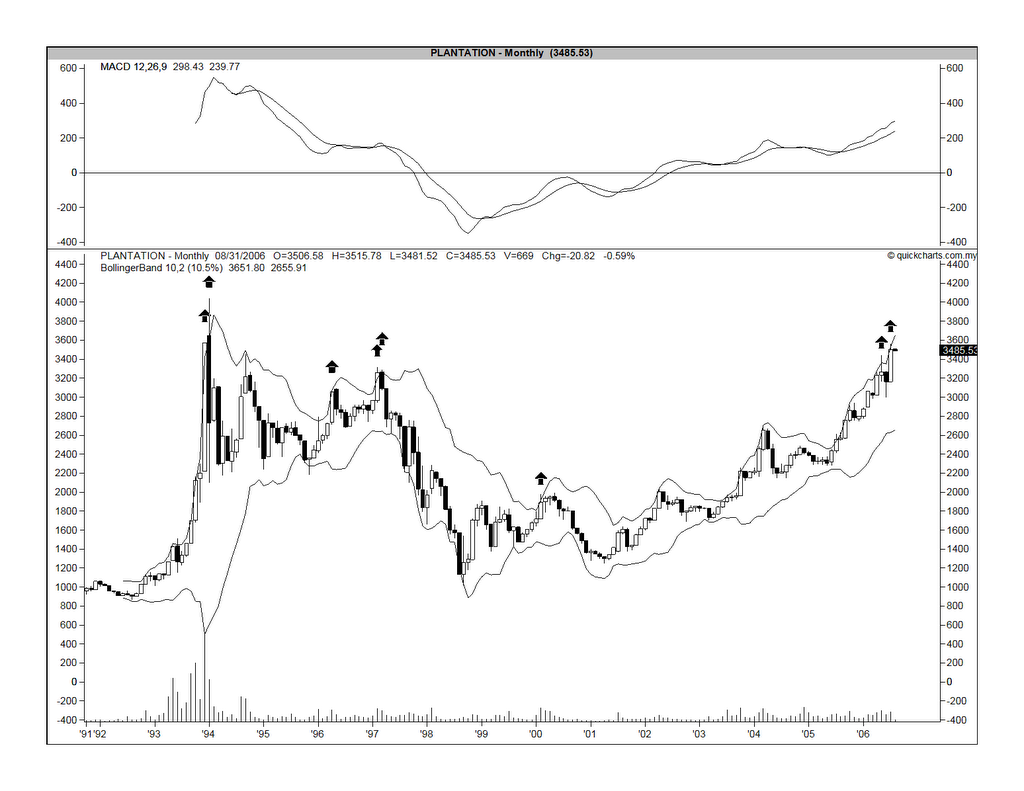
Chart 4b: Plantation's weekly chart as at August 3
No comments:
Post a Comment