Airasia has dropped to its short-term uptrend line support of RM1.45. Failure to hold at this level may see Airasia testing its strong horizontal of RM1.40. I think a good entry level will be somewhere between RM1.40 & 1.45.
This is a personal weblog, reflecting my personal views and not the views of anyone or any organization, which I may be affiliated to. All information provided here, including recommendations (if any), should be treated for informational purposes only. The author should not be held liable for any informational errors, incompleteness, or delays, or for any actions taken in reliance on information contained herein.
Monday, December 04, 2006
Airasia is testing its short-term uptrend line at RM1.45
Airasia has dropped to its short-term uptrend line support of RM1.45. Failure to hold at this level may see Airasia testing its strong horizontal of RM1.40. I think a good entry level will be somewhere between RM1.40 & 1.45.
Friday, December 01, 2006
Call Warrant updates as at December 1
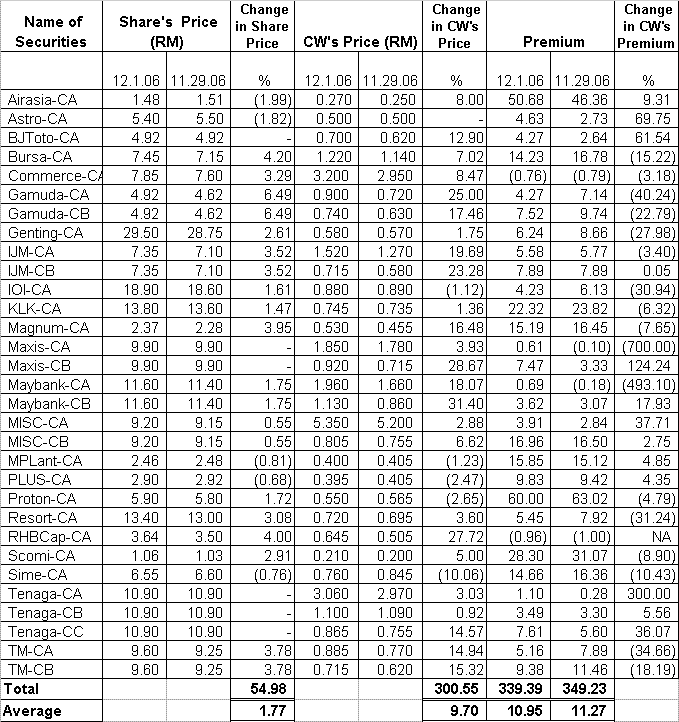
Call warrants have continued to rise. Their prices have increased by an average of 9.70% from November 29 while the underlying share prices have gained 1.77% during the same period (see Table 1 below).

Table 1: Changes in Call warrants' prices, underlying share prices & premium from Nov 29 to Dec 1
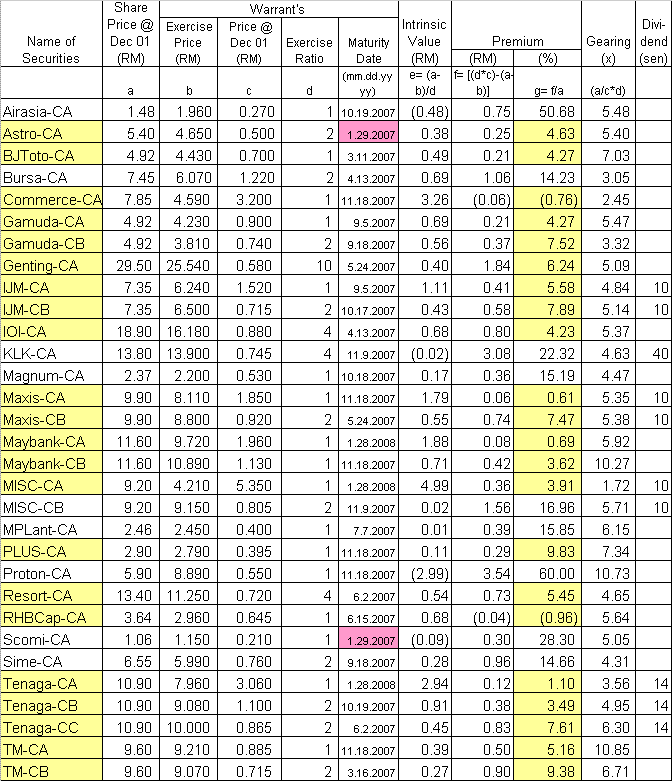
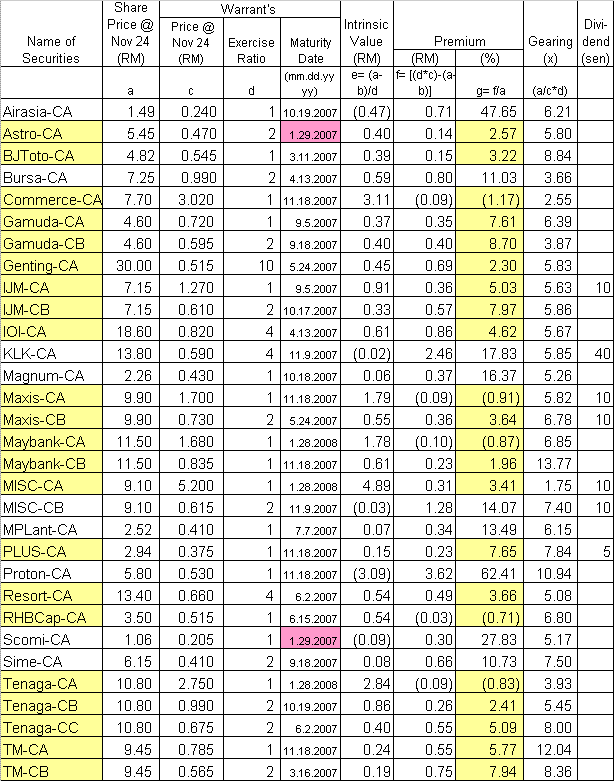
The usual Call Warrants update is posted here for your easy reference. The cheap call warrants are highlighted in yellow while 2 call warrants that due to expire in January 2007 (i.e. Astro-CA & Scomi-CA), have their expiry dates highlighted in pink.

Table 2: Call warrants' intrinsic value & premium as at Dec 1
TWSPlnt may have a bullish breakout

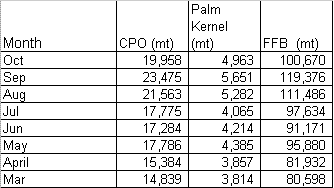
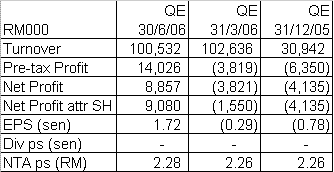
So far, we have only 3 quarterly result announcement from TWSPlnt. As the merger was completed in Feb, the only meaningful results is that of QE30/6/2006. In that quarter, the company recorded a net profit of RM9.08 million on the back of a turnover of RM100.5 million.

In a recent report in November, K&N Kenanga has projected net profit & turnover for FY2006 of RM75.3 million & RM476.5 million, respectively for TWSPlnt. EPS for FY2006 was estimated to be 12.0 sen.
Based on the closing price as at the end of the morning session of RM2.06, TWSPlnt is trading at a PE of 17.2 times. That's about the average PE for a plantation company, currently.
Chartwise, TWSPlnt appears to be in an ascending triangle, with breakout at RM2.03. Its recent high was RM2.08 recorded on May 8. The share has been pressing against the breakout level for the past few days. Today, it has broken above the breakout level of RM2.03 and it has gone as high as RM2.09 i.e. surpassing the recent high of RM2.08. It is very likely that a genuine breakout is in hand & TWSPlnt is now a trading BUY.
Hexza may have a bullish breakout
Hexza’s net profit for the last 4 quarters has dropped by 0.9% to RM11.4 mil when compared to the preceding 4 quarters. This was despite a 6.4%-increase in turnover to RM138 mil. EPS has consequently eased off by 0.9% to 8.84 sen from 8.92 sen.

Based on its closing price as at the end of the morning session of RM0.64, Hexza is now trading at a PE of 7.2 times.
Chartwise, Hexza has just broken above its ascending triangle at RM0.62 level. It has already reached its first resistance of RM0.64, with next resistance levels at RM0.67 & RM0.72.

Based on the technical breakout & reasonable financial performance, Hexza should be a good trading BUY.
Mesdaq may test its short-term uptrend line

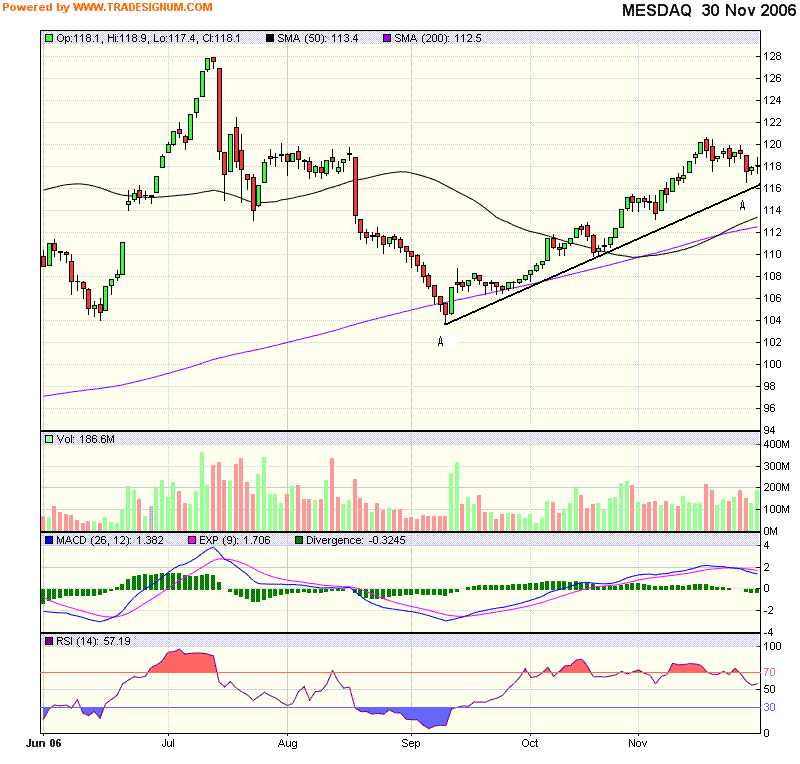
Chart 1: Mesdaq’s daily chart as at Nov 30

Chart 2: MTouche’s daily chart as at Nov 30

Chart 3: Green Packet’s daily chart as at Nov 30
TM, Tenaga & Maybank: Follow-up
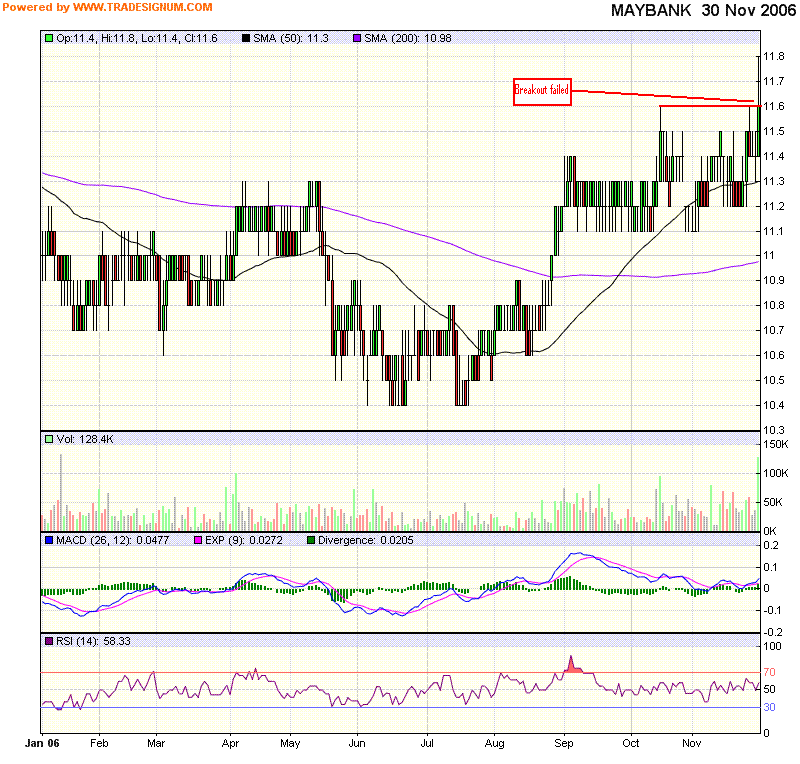
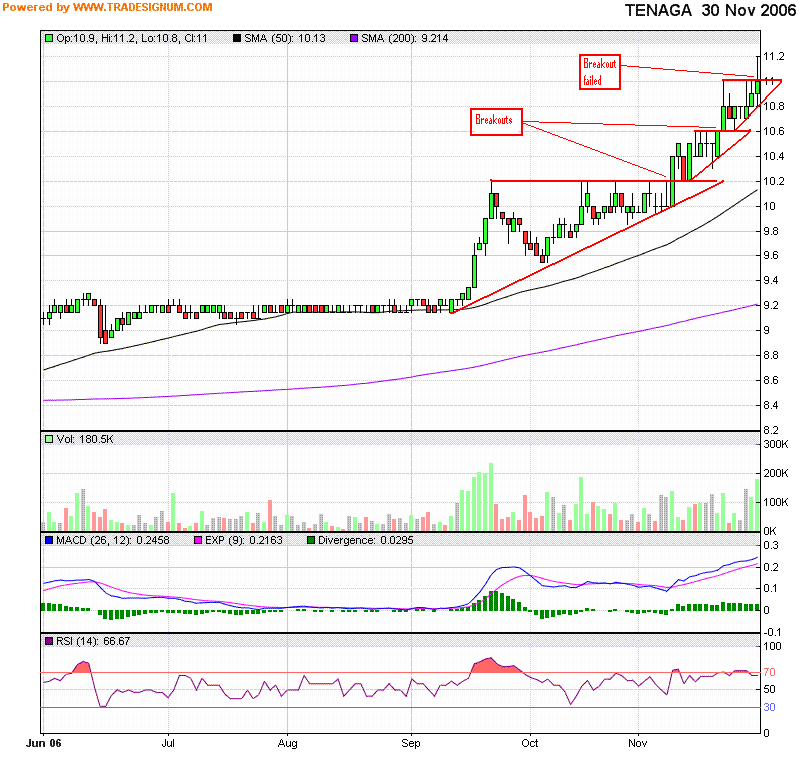
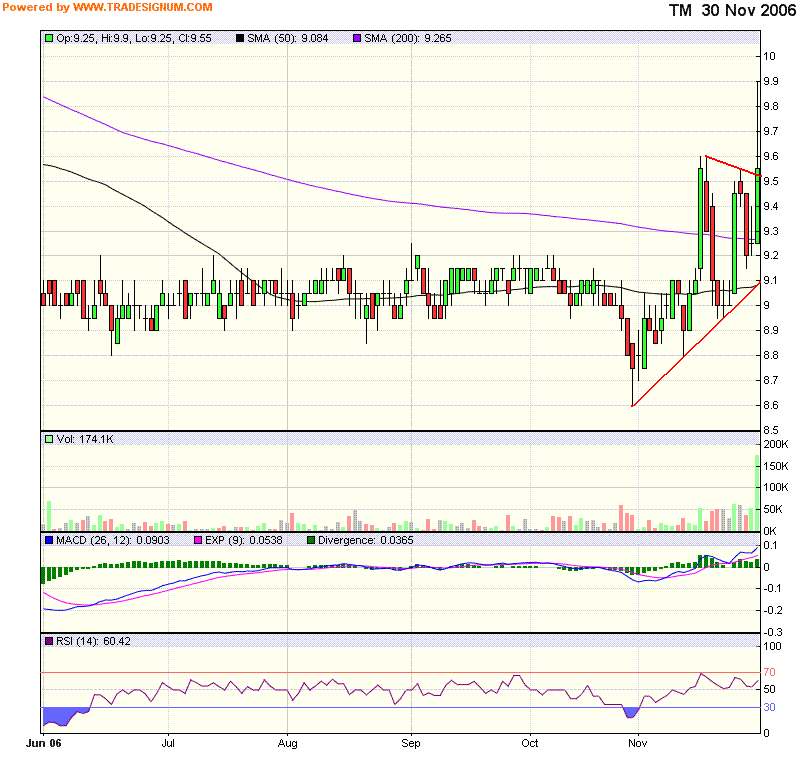
A failed breakout normally lead to more selling in the days ahead, especially from those who bought into the breakout yesterday. The next few days will be very interesting time for all market players, bulls & bears alike. Can the bulls absorb the upcoming selling from bears & trapped bulls? Only time will tell.

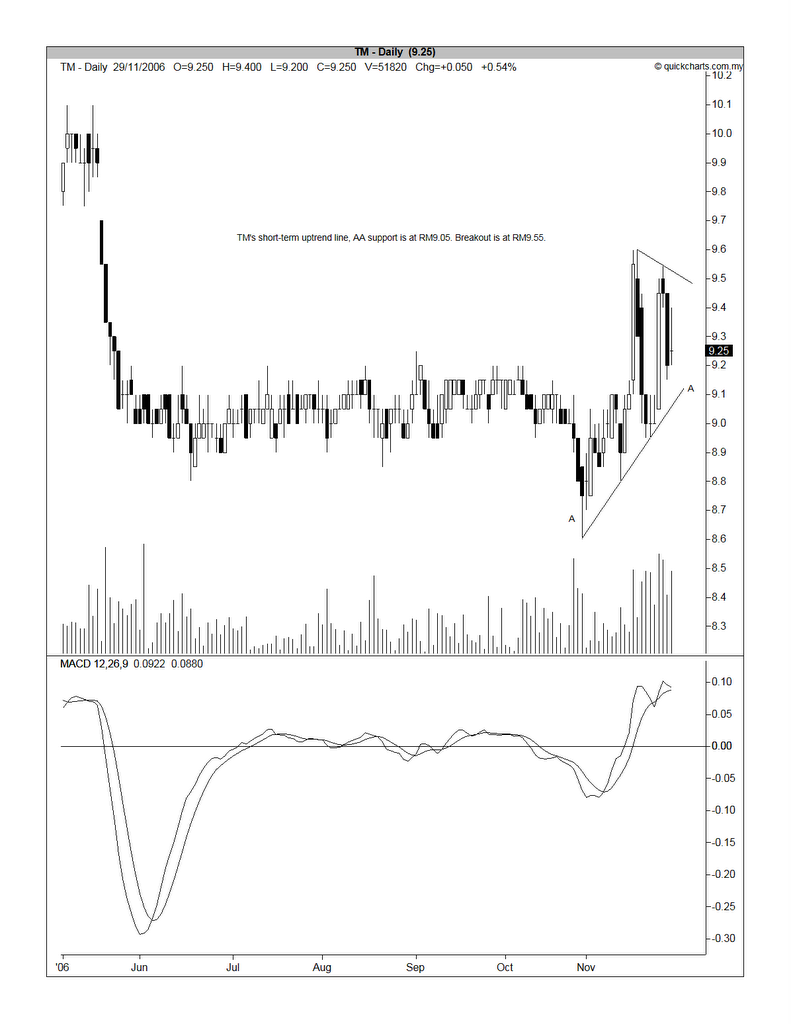
Chart 1: TM's daily chart as at Nov 30

Chart 2: Maybank's daily chart as at Nov 30

Chart 3: Tenaga's daily chart as at Nov 30
Thursday, November 30, 2006
TM, Tenaga & Maybank: These elephants are charging up!

Chart 1: Maybank's daily chart as at Nov 29

Chart 2: TM's daily chart as at Nov 29

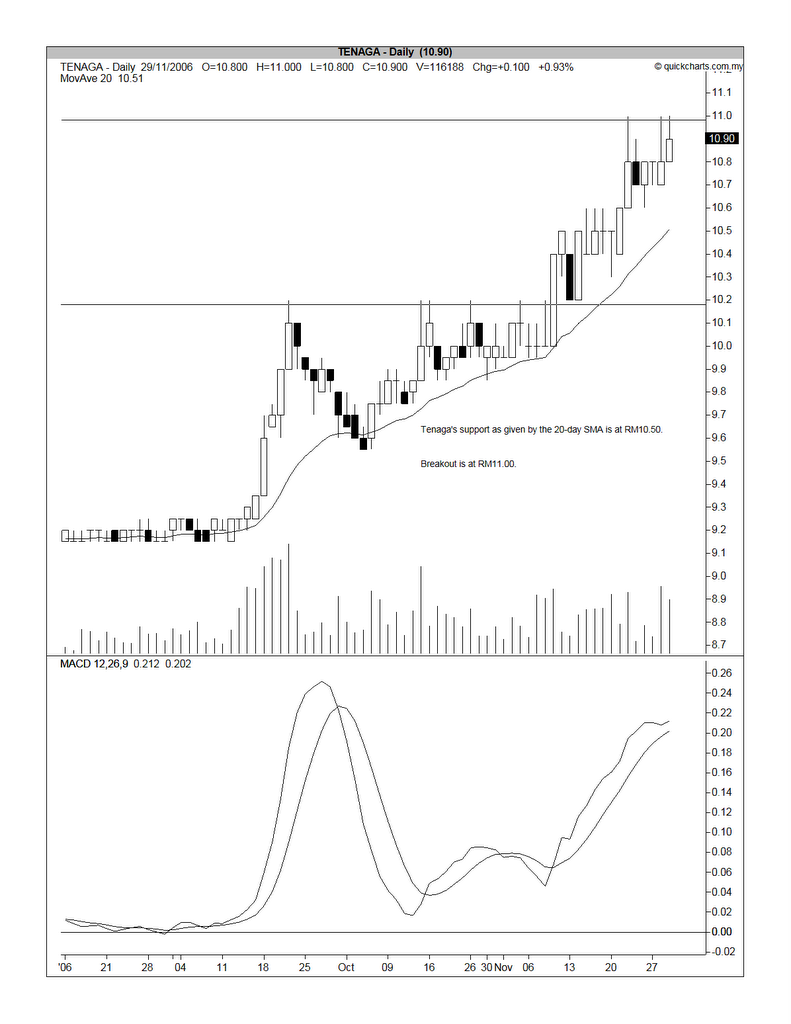
Chart 3: Tenaga's daily chart as at Nov 29
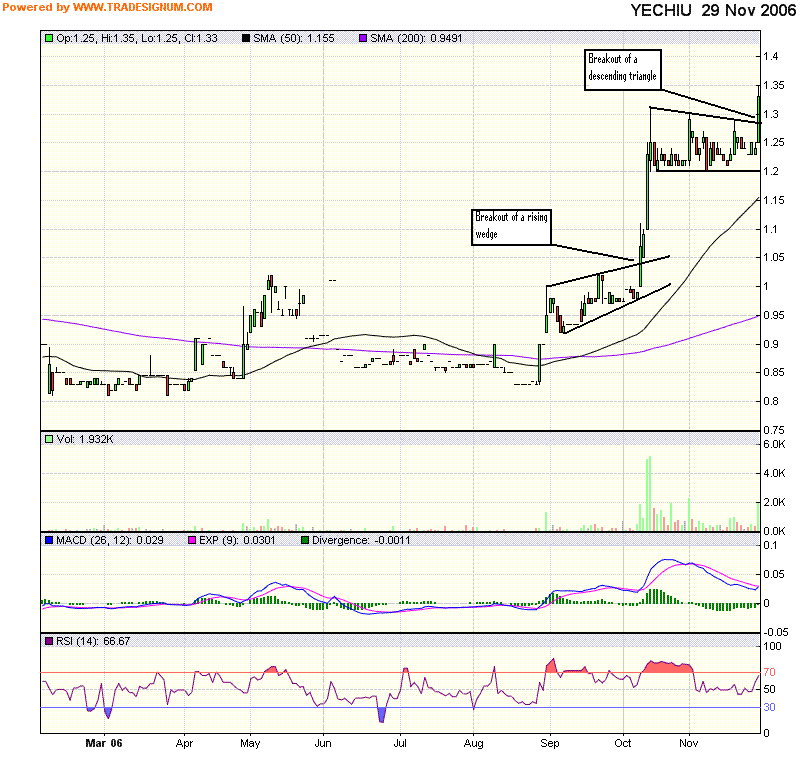
Ye Chiu Metal has a good quarter & a bullish breakout

Based on attractive valuation & bullish breakout, Yechiu is a BUY.
Wednesday, November 29, 2006
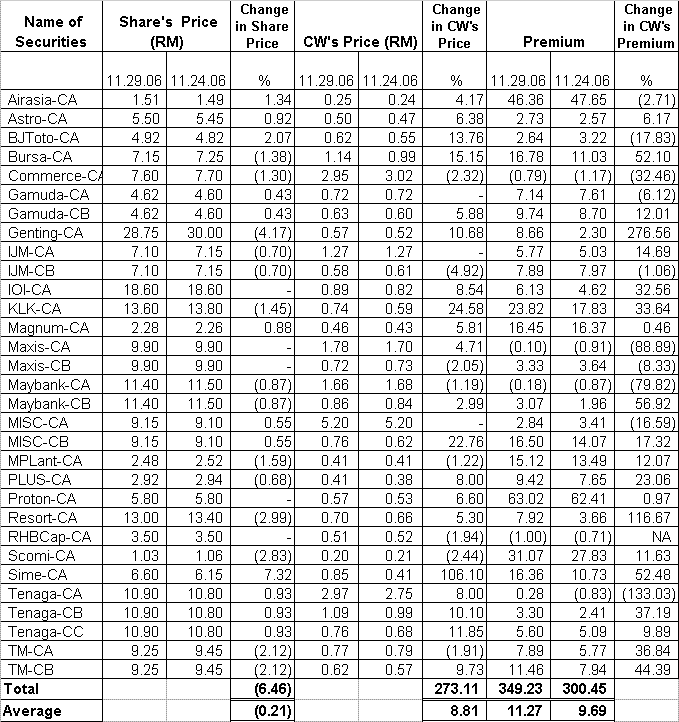
Call Warrant updates as at November 29

Table 1: Changes in Call warrants' prices, underlying share prices & premium from Nov 24 to 29
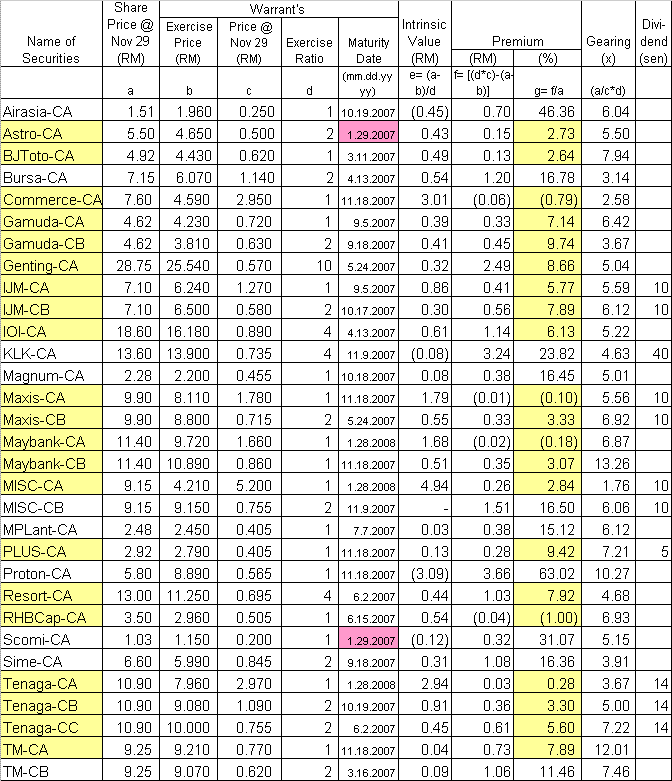
I have also posted below the usual Call Warrants update for your easy reference. The cheap call warrants are highlighted in yellow while 2 call warrants that due to expire in January 2007 (i.e. Astro-CA & Scomi-CA), have their expiry dates highlighted in pink. To be fair, I'm not too disturbed by the upcoming expiry of Astro-CA as it is trading within the money. It is Scomi-CA that you must avoid as it is trading outside the money.

Table 2: Call warrants' intrinsic value & premium as at Nov 29
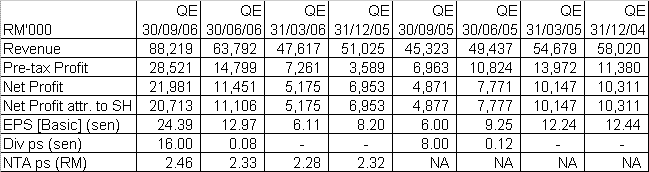
Tong Herr amazes with continued net profit growth

Due to the sharp rise in net profit, Tongher's EPS for QE30/9/2006 is at 24.39 sen. If this earning can be maintained going forward, Tongher's EPS for full-year could be as high as 97.56 sen. At 3.00 p.m. (November 29), Tingher is trading at RM4.00. At this price, Tongher's PE is about 4.1 times, which is still relative inexpensive.
From the weekly chart below, you can see that Tongher has broken out of its rising wedge at RM3.50 level in October. The next resistance was RM3.90, which was broken today. Tongher could revisit its high of RM4.30 recorded in December 2004.
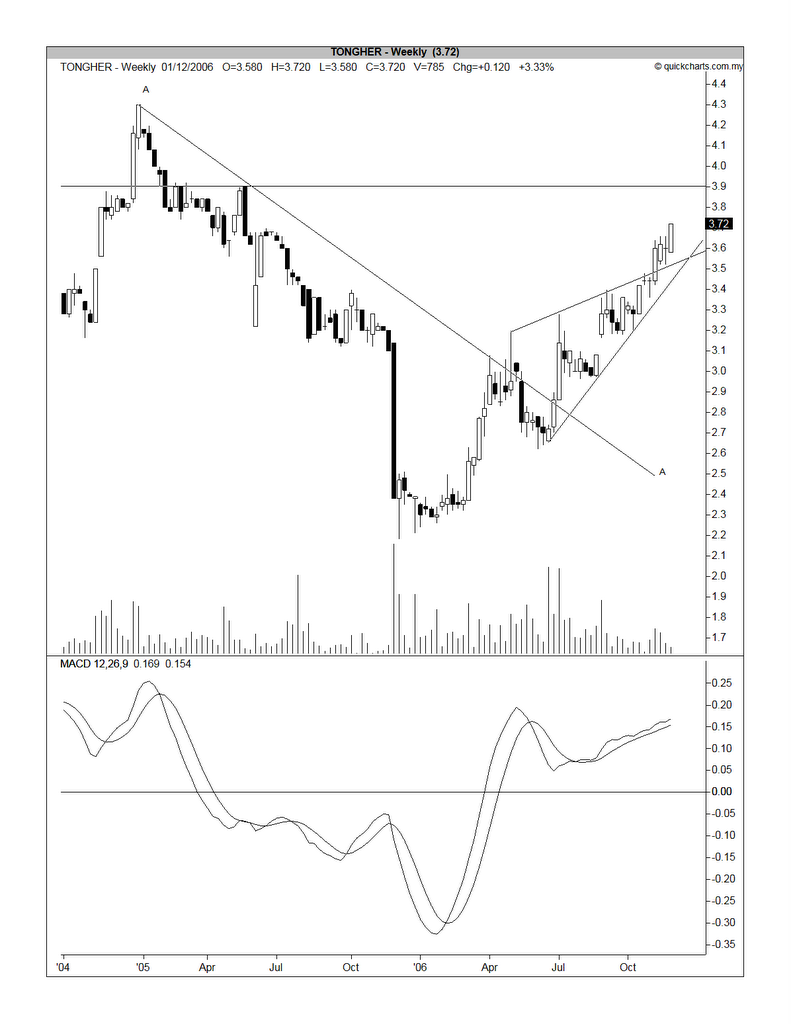
Based on cheap valuation, I believe Tongher is still attractive investment despite having risen by about 80% in the past 12 months (i.e. from RM2.20 in December 2005 to RM4.00 at 3.00 p.m. today).
CI may correct soon
On weakness, I believe the CI may pull back to test the horizontal support of 1050 & the 10-day SMA of 1045. These levels should be able to hold up the market as it corrects the excess of last Friday & this Monday.

Chart: CI's daily chart as at Nov 28
In view of the above, you may use this morning's improved prices to raise some cash in order to take advantage of any correction that may roll in later.
Tuesday, November 28, 2006
Maxtral's gradual move may accelerate
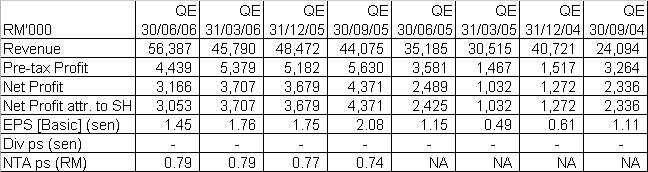
Maxtral’s last 4 quarters’ net profit amounted to RM14.9 million, which is double that of the preceding 4 quarters. Turnover has increased by 49% from RM130.5 million to RM194.7 million during the same periods. Consequently, its EPS for the last 4 quarters increased by 110% to 7.04 sen from 3.36 sen previously.
The technical picture for Maxtral is quite attractive. The stock has recently surpassed its April high of RM0.39. With this breakout, the stock may rally upward in line with the other timber stocks.

Based on inexpensive valuation & nice technical set-up, I believe Maxtral is a fairly safe timber stock to invest in.
Sunday, November 26, 2006
IJM has surpassed its all-time high

Chart 1: IJM's monthly chart as at Nov 23
Before we proceed further, let’s recap some outstanding significant corporate exercises that may have impact investors’ opinion on IJM. A few weeks ago, IJM has proposed to takeover of Road Builders in a deal which effectively swaps 2 Road Builders shares for 1 IJM new share. In addition, the market is also awaiting the confirmation of IJM’s acquisition of a stake in Kumpulan Euro, with the stumbling block being the finalization of the latter’s concession agreement with the State Government of Selangor regarding the development of the
As a technical rule, a stock that has made a new high has the tendency to continue to go higher. As such, IJM could be in for a very interesting time. Having said that, I like to introduce you to another technical rule; one that’s not so well-known. In the book, Trader Vic - Methods of a Wall Street Master, Victor Spenrandeo has made this observation: “In an uptrend, if a higher high is made but fails to carry through, and then prices drop below the previous high, then the trend is apt to reverse." That’s something that we must watch out for in the next few trading days- whether IJM share price may slide back below the RM7.05 level.
The big question is how do you gain entry into this developing play, besides buying into IJM. You can do anyone of the following:
- Buy Road Builders; or
- Buy IJM-CA or IJM-CB or IJM-WB.
Buying Road Builders to ride on IJM's rise is relatively safe since the IJM-Road Builders deal, being a friendly deal, is likely to be completed. As the Road Builders share shall be exchanged for IJM share at a ratio of 2:1, you should buy Road Builders at a price not exceeding RM3.55. In fact, you should build in a discount of 3 to 5% to take into account of the risk of the IJM-Road Builders deal may somehow falter.
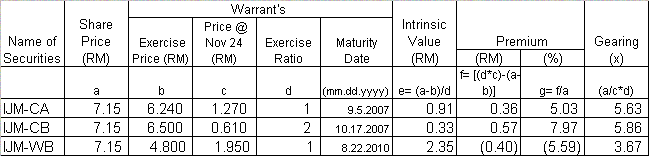
Here, we have a very strange situation of IJM-WB trading at a discount of 40 sen or 5.6%. This doesn’t seem right. It gives rise to a situation where one can simply buy IJM-WB & exercise the conversion option by paying the exercise price of RM4.80 & thereafter disposing off the share at a profit of RM0.40 [IJM price of RM7.15 less (IJM-WB price of RM1.95 plus exercise price of RM4.80)]. In fact, the volume traded last Friday of 76,245 lots (or, 7.6245 million units) indicates that some investors may have spotted this discount & were buying quite substantially. The question is why are the sellers so willing to sell at a discount? In the past, I have noticed that such anomalies could persist for sometime, say a few days or even a few weeks. The longer this discount persists, the greater is the chance that the share price will correct. This is only natural as demand (for the share) will eventually be fulfilled by unending supply as more shares are created due to the investors’ exercising their warrants (i.e, IJM-WB) for new shares.
So, over the next few days, watch out for IJM share price as well as IJM-WB price. If IJM share price drop below RM7.05 or the discount persist for IJM-WB, you are forewarned that this 'new high' may not sustain.Yoko may be poised for a bullish move
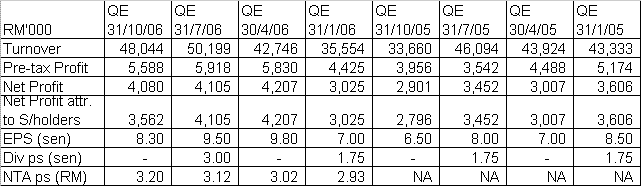
Yoko has just reported its results for QE30/9/2006 which shows a net profit of RM2.35 mil, which is a substantial improvement over a net loss of RM4.8 mil recorded in the previous corresponding quarter. Turnover for QE30/9/2006 of RM30.3 mil is 7.8% higher than turnover in QE30/9/2005. Current net profit is however 38.4% lower than the immediate preceding quarter’s net profit of RM3.8 mil. This is attributable to the recognition for the gain on disposal of a subsidiary in France of RM3.1 mil during the last quarter.
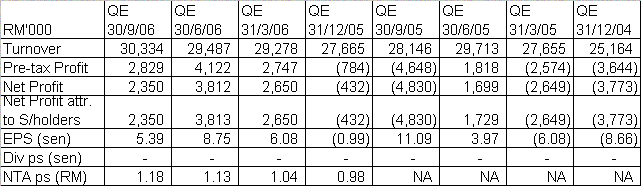
EPS for the first 3 quarters amount to 19.23 sen vis-Ã -vis an EPS of only 0.32 sen for the same periods last year. If we exclude the non-recurring exceptional gain of RM3.1 mil from the disposal of the subsidiary in France, the EPS would be lowered to about 12 sen. Annualizing this, we can arrive at a full year EPS of 16 sen for Yoko. Based on the clsoing price of RM0.555 as at November 24, Yoko is now trading at a PE of about 3.5 times only.
From Chart 1 below, you can see that Yoko may have just broken above its horizontal resistance of RM0.55. This followed the break above its 200-day Simple Moving Average (SMA) of RM0.48 at the end of October. You may also notice that the 50-day SMA has also crossed above the 200-day SMA. For a chart with a longer time frame, go to Chart 2 below.
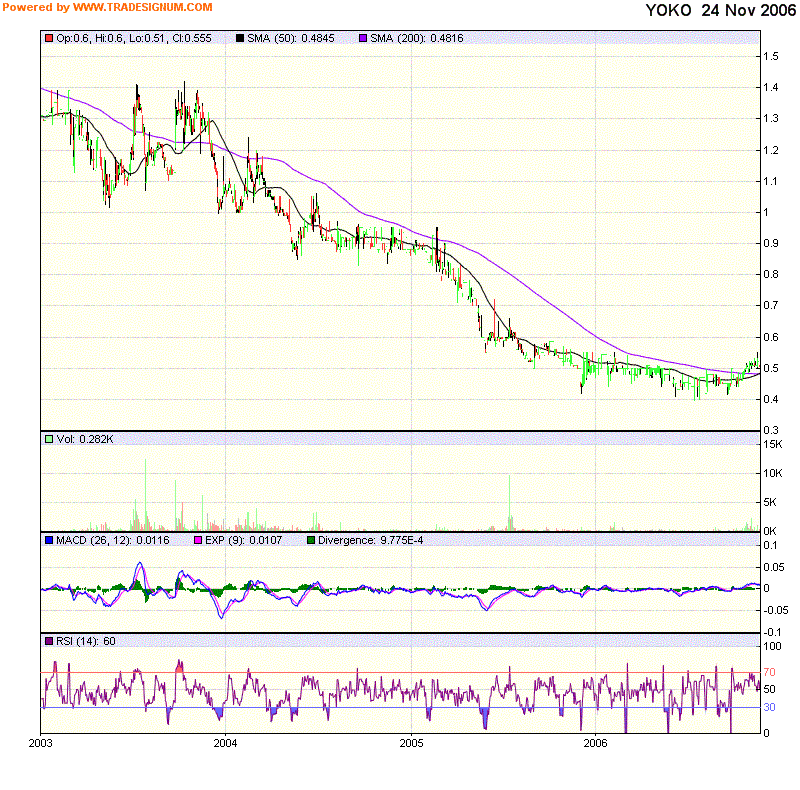
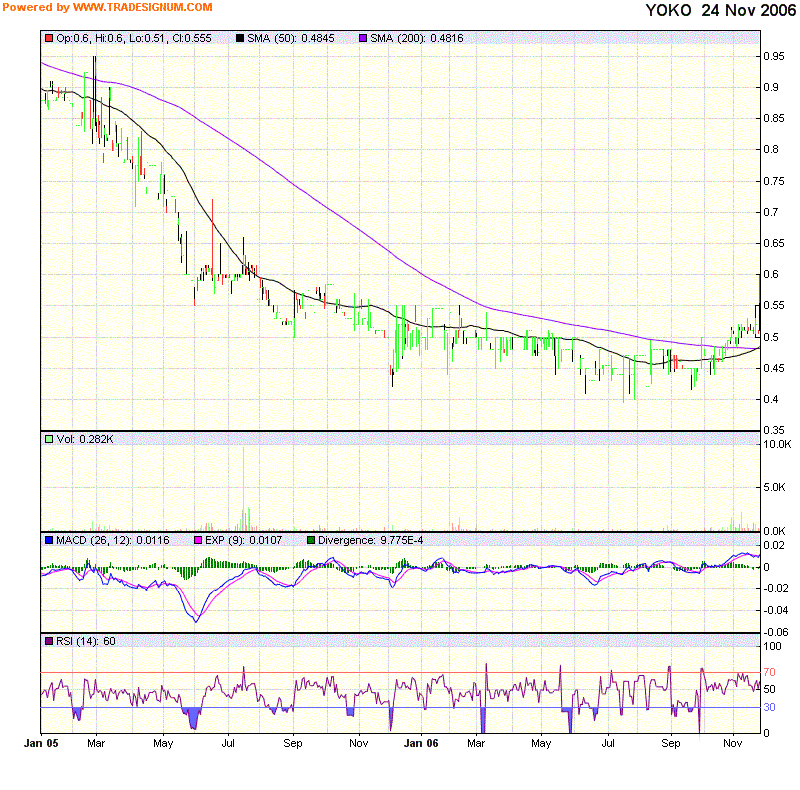
Chart 1: Yoko's daily chart from Jan 2005-November 2006

Chart 2: Yoko's daily chart from Jan 2003-November 2006
Based on attractive valuation & potentially bullish technical outlook, Yoko is a stock good for a medium-term trade or for the long haul.
Friday, November 24, 2006
Kesm
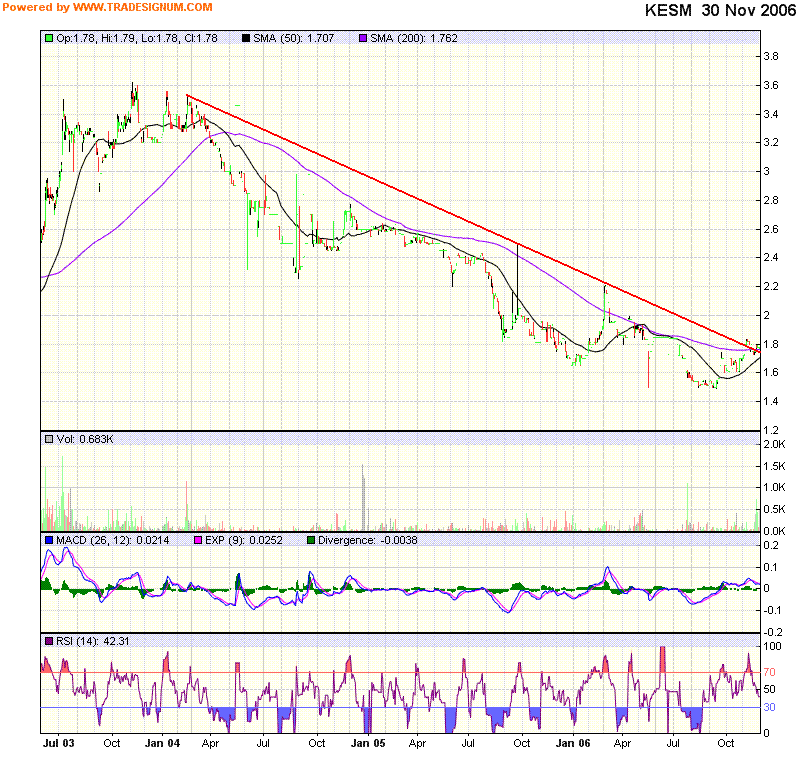
Kesm’s net profit for the last 4 quarters has increased by 18.9% to RM14.9 mil when compared to the preceding 4 quarters. This was achieved on the back of a 5.7%-increase in turnover to RM176 mil. EPS has also increased by 15.3% to 34.6 sen. Based on yesterday's closing price of RM1.78, Kesm is trading at a PE of 5.1 times.

Mycron may have a bullish breakout

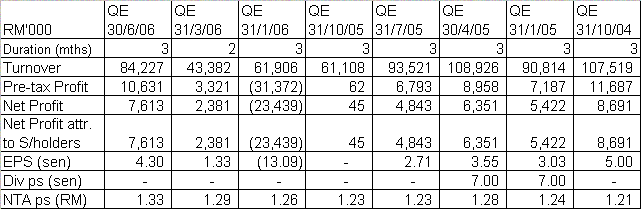
Mycron has achieved a net profit of RM7.6 million on a turnover of RM84.2 million for QE30/6/2006 (the latest available result). Its EPS fro that quarter amounted to 4.3 sen; giving a full year EPS of 17.2 sen. Based on its closing price of RM0.83 today, Mycron is trading at a PE of only 4.8 times.
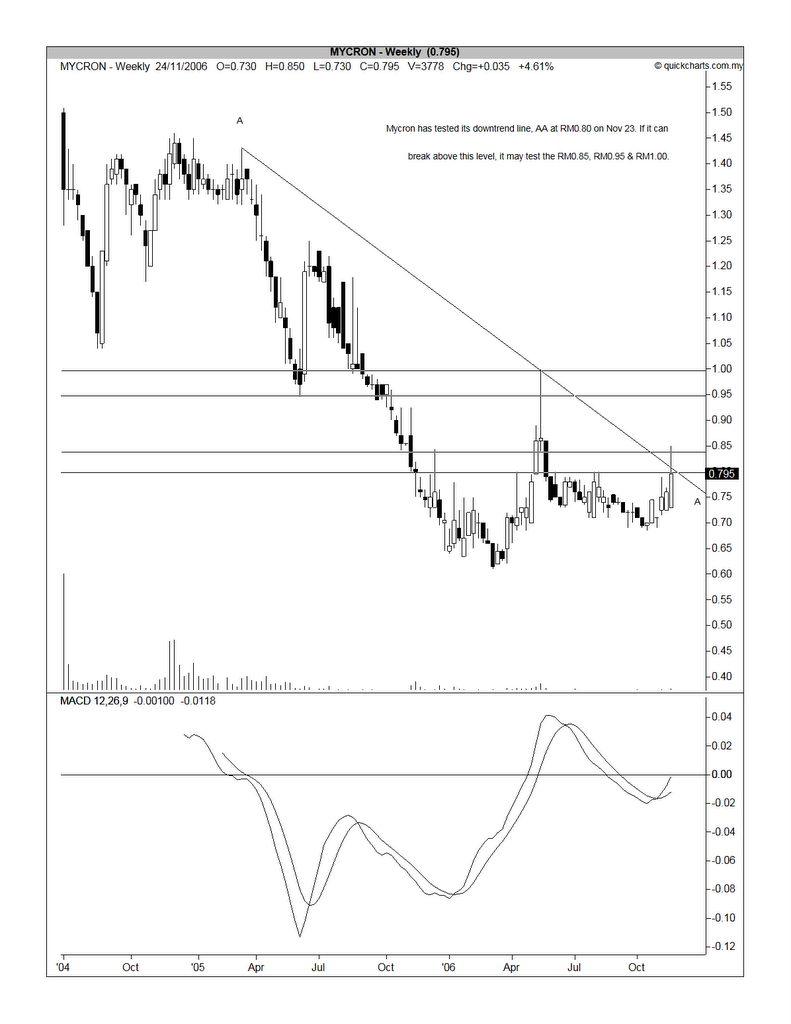
The weekly chart (Chart 1) shows that Mycron share price is in a downtrend with a possible breakout at RM0.80. It has tested that level yesterday (Nov 23) but failed to stay above the RM0.80 mark (see the daily chart, Chart 2). Today, Mycron has again broken above this level & closed at RM0.83. If this breakout can hold, the share price may go higher, with horizontal resistances at RM0.85, RM0.95 & RM1.00.

Chart 1: Mycron's weekly chart as at Nov 22

Chart 2: Mycron's daily chart as at Nov 22
Based on relatively cheap valuation & possible bullish breakout, Mycron could be a good trade.
Call warrants show their potency
Today, call warrants had a fantastic day. Amongst the top 20 stocks with the biggest volume, 8 of them are call warrants. Of the top 20 stocks with the highest percentage gain, 7 of them are call warrants. Of the total volume of stocks traded of 1.333 billion, 221 million were contributed by call warrants. The big question now is whether this increase can sustain.
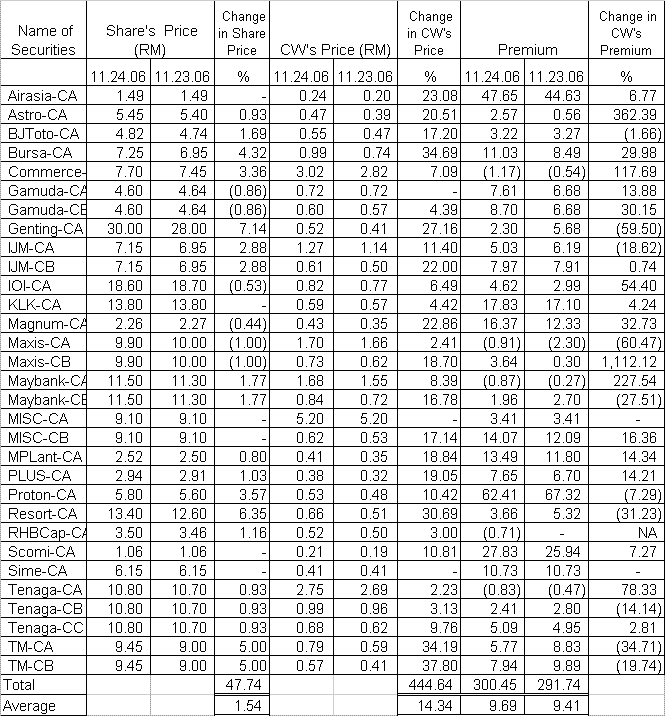
From Table 1 below, I have tabulated the percentage gain of the call warrants vis-a-vis the percentage gain of the mother shares (from yesterday i.e. November 23 to today). You can see that the call warrants had gained 14.34% as compared to a gain of 1.54% for their mother share. That may worry many but if you look carefully you will see that the increase is not unusual. You can see that the average premium of the call warrants had only increased from 9.41% to 9.69%. The only thing that I am concerned with is the huge volume, which may lead to some overhang next week.

Table 1: Comparison of Call Warrants' changes, Mother shares' changes & Call Warrants' premium.
In addition, I have tabulated below the latest list of call warrants' intrinsic value & premium for your perusal. As usual, call warrants with premium below 10% are highlighted in yellow & the two earliest call warrants to expire i.e. Astro-CA & Scomi-CA have their expiry date highlighted in pink.
Bursa-CA is running ahead of its mother share

Chart 1: Bursa-CA's daily chart as at Nov 24

Chart 2: Bursa's daily chart as at Nov 24
Bursa-CA, the call warrant of Bursa Malaysia, has been running up very strong since its breakout above RM0.46 at November 10 (see Chart 1 above). It gained 12 sen to close at RM0.855 at the end of the morning session today. Bursa share price has gained 5 sen to close at RM7.00 at the same time.
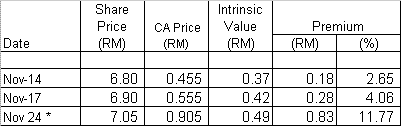
During the period of 10 days, Bursa-CA's premium has increased from 2.65% as at November 14 to 11.77% as at the end of this morning session. Is this a sign that something bullish is ahead for the mother share?
If you look at the mother share's chart (see Chart 2 above), you will see that the share has been pressing against the RM7.00 level. A break above this level could be the start of another bullish move that may bring Bursa to its recent high of RM7.65. At the time of writing this post, Bursa is at RM7.05.
Wednesday, November 22, 2006
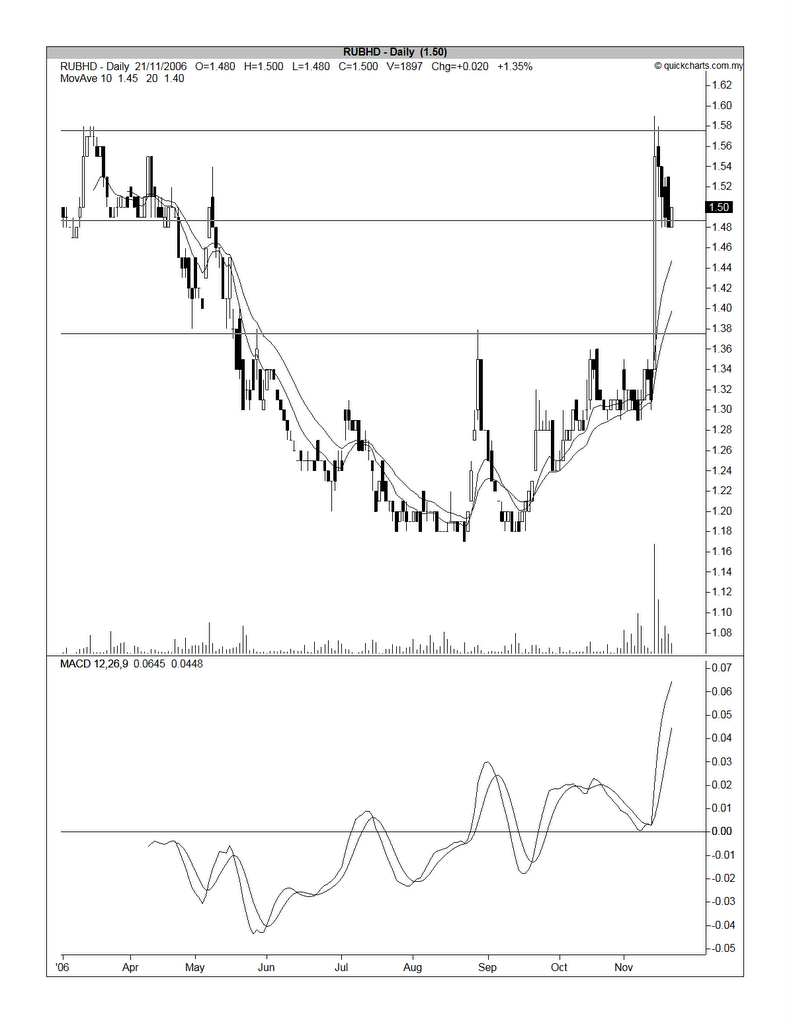
RUBhd had a big move

Chart 1: RUBhd's weekly chart as at Nov 21

Chart 2: RUBhd's daily chart as at Nov 21
After the big price move mentioned earlier, RUBhd share price has retraced back to RM1.48. Today, it has begun to move up again. The share closed at RM1.56 at the end of the morning session, gaining 6 sen on a volume of 4,276 lots. At this price & assuming a full year EPS of 79.52 sen, RUBhd is trading at a PE of 2.0 times only. Hard to believe…
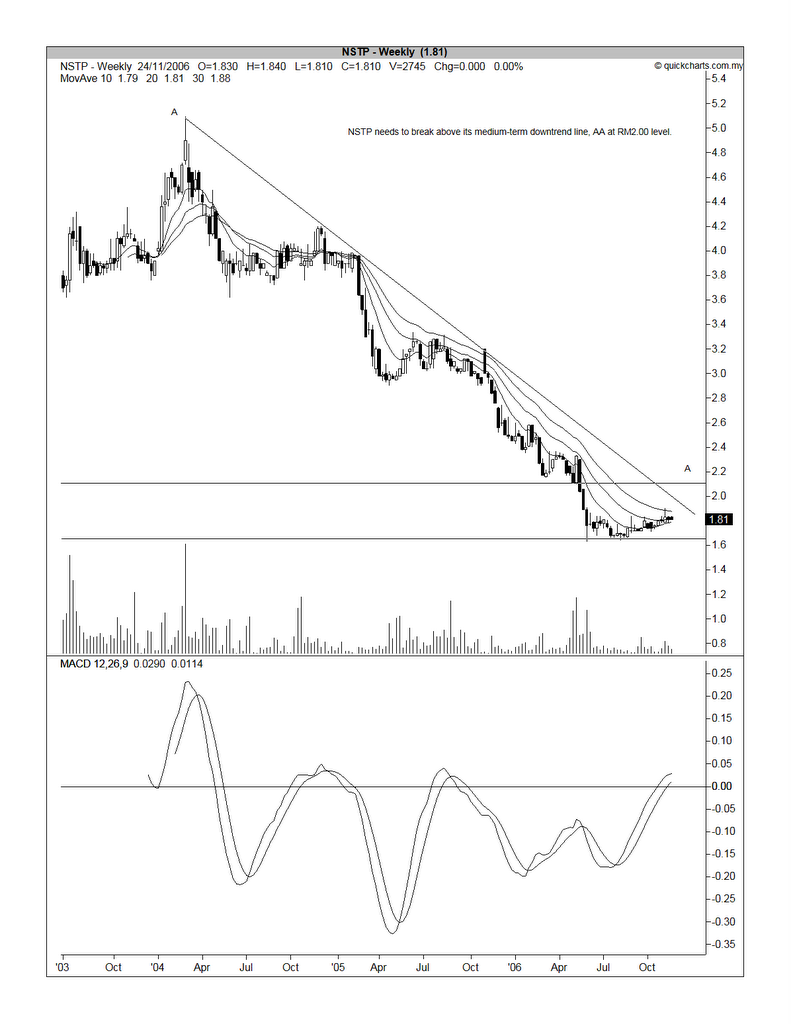
NSTP is testing its downtrend line at RM2.00

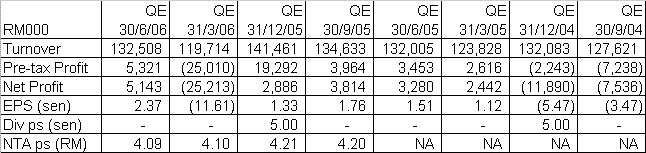
The share price also reflects NSTP's fortune. From a high of RM5.10 in Feb 2004, the share price has dropped to a low of RM1.63 in Jun 2006. Since then, the share price has been bottoming out with its rise capped at RM1.84. A recent attempt to break above this level went as high as RM1.91 on Nov 8 before succumbing to selling pressure. This morning, NSTP has again surpassed the RM1.84 level & also breaking above its medium-term downtrend line at RM2.00 level. At the close of the morning session, NSTP was trading at RM2.03. See the daily & weekly charts below.

Chart 1: NSTP's weekly chart as at Nov 21

Chart 2: NSTP's daily chart as at Nov 21
If NSTP can hold above the RM2.00 level, there is a good chance that the share can go higher. An entry at RM2.00 would be relatively safe.