dated September 7 that the Plantation index was about to test the short-term uptrend line (the critical level then was 3688) & it might break below the uptrend line. The index did just that (see Chart 1 below).
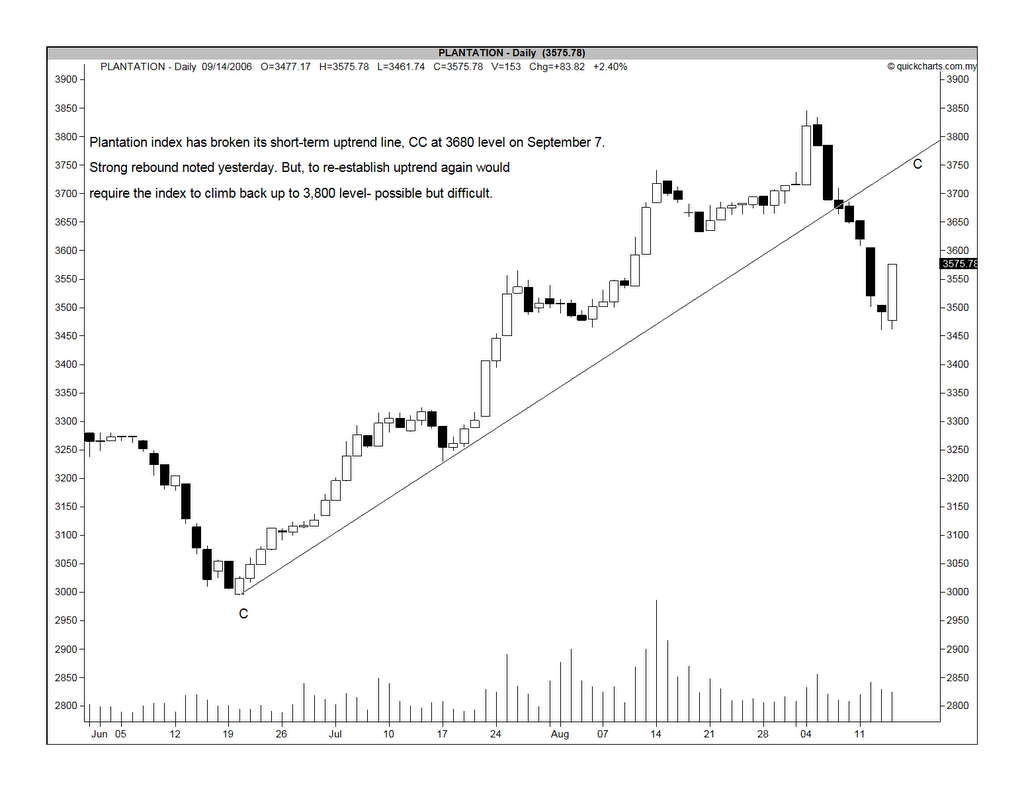
Chart 1: Plantation's daily chart as at Sep 14
I believe that the Plantation index has put in a temporary top. Despite yesterday (Sep 14)'s healthy rebound of 83.82 points to close at 3575.78, the next few weeks would likely to see the index drifting lower until it tests the medium-term uptrend line at the 3200 level (see the weekly chart, Chart 2 below). It is likely that a rebound would happen at this 3200 level but how strong would this rebound be? If this medium-term uptrend line were to be broken, then the next support would be at the 2600-2700 level, given by the long-term uptrend that dates back to Mar 2001 (see the monthly chart, Chart 3 below).
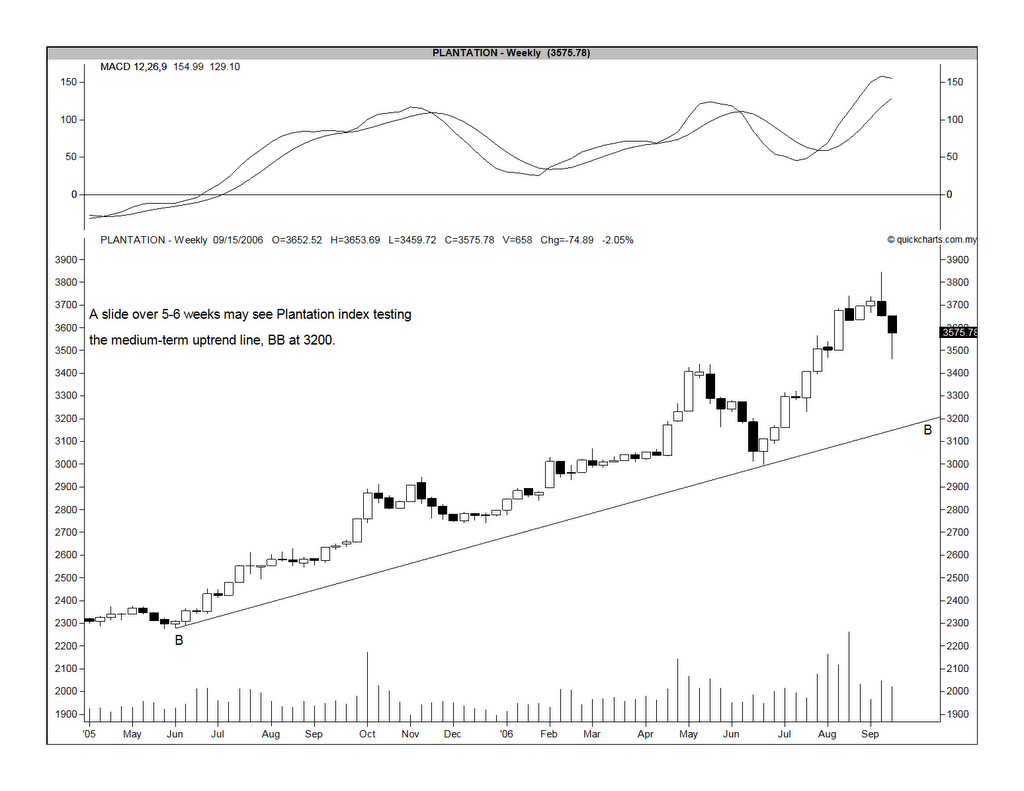
Chart 2: Plantation's weekly chart as at Sep 14
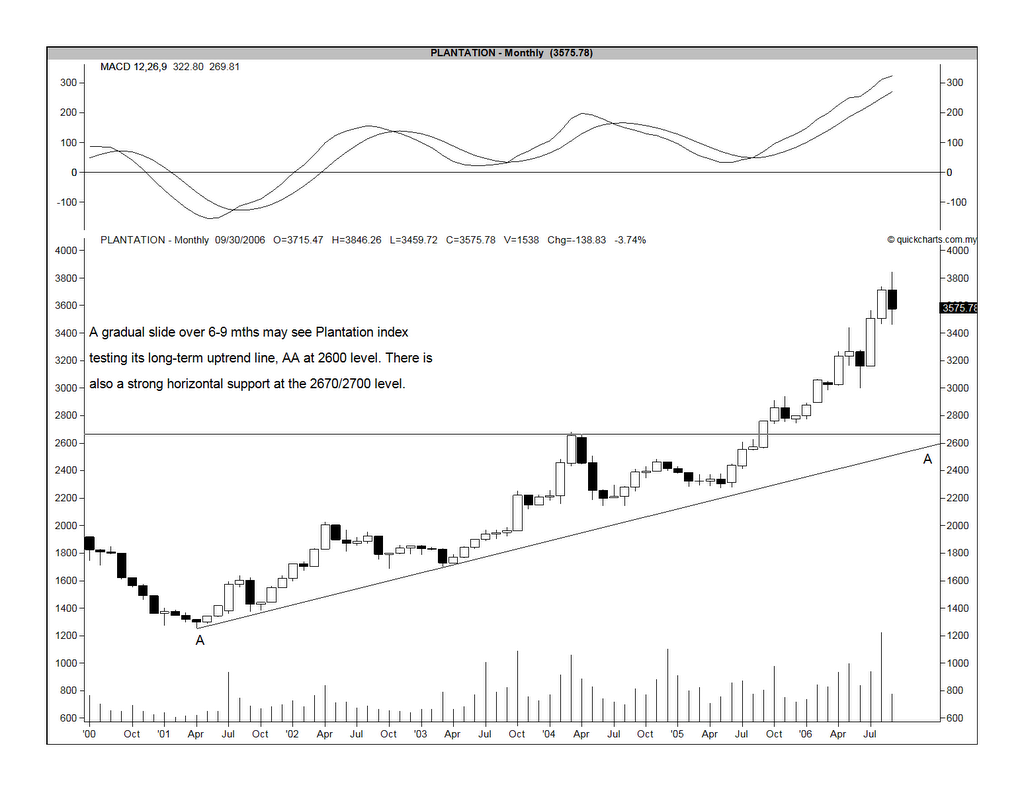
Chart 3: Plantation's monthly chart as at Sep 14
As the Plantation sector is dominated by palm oil companies and the current plantation rally is driven by a rally in the price of CPO, it is good to take a look at CPO Futures. In an OSK Securities report dated Sep 11, the technical analyst wrote:
The major breakout rally of CPO Futures from the giant “Ascending Triangle” was capped at the RM1660 / tonne level, which has been tested twice lately. A “Double Peak” formation has been constructed as a result of the market action. The market has been trending down since then. While it may look like the CPO Futures has been well supported by the RM1555 / tonne level, another bearish reversal pattern of “Tower Top” has just been detected.
It is the first time we bring up the “Tower Top” candlestick pattern in this column. “Tower Top” is a type of bearish formation which looks like a “V” shape tower. The formation has sharp rally on the left side of the tower and another sharp retracement on the other side. The bearish reversal pattern will be completed if the foundation of the tower is cracked, or the RM1,555/ tonne level is this case. We expect a quick breakdown from the RM1555 / tonne level which would provide a “swing trading” opportunity for the CPO Futures traders. Cut-loss point is pegged at above the RM1,555/ tonne level. Should the RM1,555/ tonne level is violated decisively, look for the RM1,500-RM1,520/tonne zone as the immediate strong support floor. The resistance zone was previously a formidable upside hurdle for the market.
All in, the immediate technical outlook of the CPO Futures is now aligned with a bearish bias. Nevertheless, mid-term outlook of the CPO Futures is still bullish as long as the market will not retrace back below the support line of the “Ascending Triangle”.
The critical RM1,555/ tonne level has in fact been violated. CPO Futures for the month of September closed yesterday at RM1,526/tonne.

Chart 4: CPO Futures as at Sep 8
Finally, the trend of CPO Futures is partly reflective of the trend for commodities as a whole. On that count, we can say that the medium-term outlook for commodities is not good. From Chart 5 below, you can see that CRB index's medium-term uptrend has been broken.
Chart 5: CRB's weekly chart as at Sep 14
In conclusion, you may want to use any rebound in the Plantation sector to reduce your position in that sector. Entry into this sector can be deferred until the Plantation index has found a convincing support at either the medium-term or long-term uptrend line. You should also look at the technical outlook for CPO Futures to confirm your technical reading of the Plantation index.
No comments:
Post a Comment