Thursday, August 24, 2006

Which is better- Magnum or Magnum4D? Part 2

This is the second part of a 2-part report.

Magnum’s Current Financial Performance

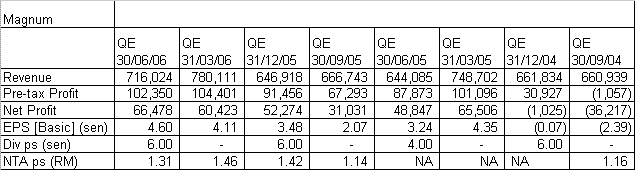
Magnum’s net profit increased 10.0% q-o-q or 36.1% y-o-y to RM66.5 mil. Turnover has increased 11.2% y-o-y from RM644 mil to RM716 mil. Like Magnum4D, Magnum’s 2Q turnover is normally lower than its 1Q’s turnover and it is no different for FYE2006. Turnover for 2Q2006 of RM716 mil is down 8.2% when compared to 1Q2006 of RM780 mil. This is much smaller than the 14.0% drop experienced in FYE2005.


Valuation

Using the EPS for 2Q2006 of 4.6 sen, we can arrive at an annualized EPS of 18.4 sen. Based on this & the share price of RM2.11 at the close of the closing session today, Magnum’s PE is about 11.5 times, much lower than Berjaya Sports Toto("BToto")’s PE of 15 times. As such, Magnum may be preferred over BToto.

Technical Picture

I have been quite fascinated with Magnum's technical outlook for quite sometime. You may recall that I have highlighted the possible reversal of Magnum's downtrend in July (go here). Magnum has in fact did a breakout of its diamond-shape bottoming formation on August 11 but that breakout could not hold. At the close of this morning session, Magnum has again broken above the RM2.08 level. I believe this time around, the breakout should be able to sustain. Other reason for my mildly bullish stance comes from the crossover of the 20-day MA by the faster 10-day MA. For better picture, take a good look at the chart below.


Chart: Magnum's weekly chart as at August 23

Recommendation

Based on improving financial & possible bullish reversal, I would recommend Magnum for a LT investment.

In the final comparison, I would prefer Magnum4D to Magnum because of cheaper valuation. There is some unconfirmed report (read: rumours) that Magnum may privatize Magnum4D in order to "capture" the entire earning of Magnum4D. This is not surprising and Magnum has the means to do so as it has a cash reserve of RM814 mil as at 30/6/06.

Which is better- Magnum or Magnum4D? Part 1

Background

Magnum is the operator of the 4-D numbers forecast betting games which is sold through its 64%-owned subsidiary, Magnum4D. In the past two years, Magnum’s 4D games had been plagued by high prize payout ratio, which has affected the profitability of Magnum & Magnum4D.

Magnum & Magnum4D have just announced their 2Q2006 results ended 30/6/06. The results show good improvement in the result of both companies. The run of “bad luck” may have ended. In addition, the 2 companies have also benefited the introduction of Mbox game on April 1, 2006.

In the first part of this 2-part report, I shall look at the result of Magnum4D & its potential.

Current Financial Performance

Magnum4D reported an improved performance for 2Q2006. It managed to chalk up a net profit of RM37.1 mil as compared to a loss of RM8.8 mil recorded in the corresponding quarter last year. Turnover has also increased by 17.8% y-o-y to RM577 mil from RM490 mil previously.

Comparison of second quarter and first quarter can often be misleading because Magnum, like other gaming companies, normally enjoys better sale during the lunar New Year period. Nevertheless, it’s encouraging to note that the turnover for 2Q2006 has dropped by only 3.0% q-o-q as compared to a 14.3% q-o-q drop in the turnover for 2Q2005. The main reason for this is the introduction of Mbox game on April 1, 2006. This coupled with a lower prize payout ratio has helped Magnum4D to report a net profit of RM37.1 mil vs. a loss of RM24.0 mil incurred in 1Q2006.


Valuation

Assuming prize payout ratio & turnover remain similar to that of 2Q2006, Magnum4D can be expected to report a pre-tax profit of RM176 mil for a full year i.e. 2Q2006 pre-tax profit of RM44 mil multiplied by 4. Net profit will work out to be about RM126.72 mil i.e. RM176 mil multiplied by a factor of 0.72. EPS will be about 76 sen!!!

As always, when confronted with such high number, I will discount it by 30% to arrive at the “final” EPS of 53.2 sen. Based on this morning session’s closing price of RM2.52 & an EPS of 53.2 sen, Magnum4D’s PE is now only 4.7 times. That’s very cheap for a gaming stock.

PS. I've decided to ignore the net profit figure for 2Q2006 because the effective tax rate of 16% is too low. There may be good reason for this but we cannot expect the same to prevail in other quarters.

Technical Picture

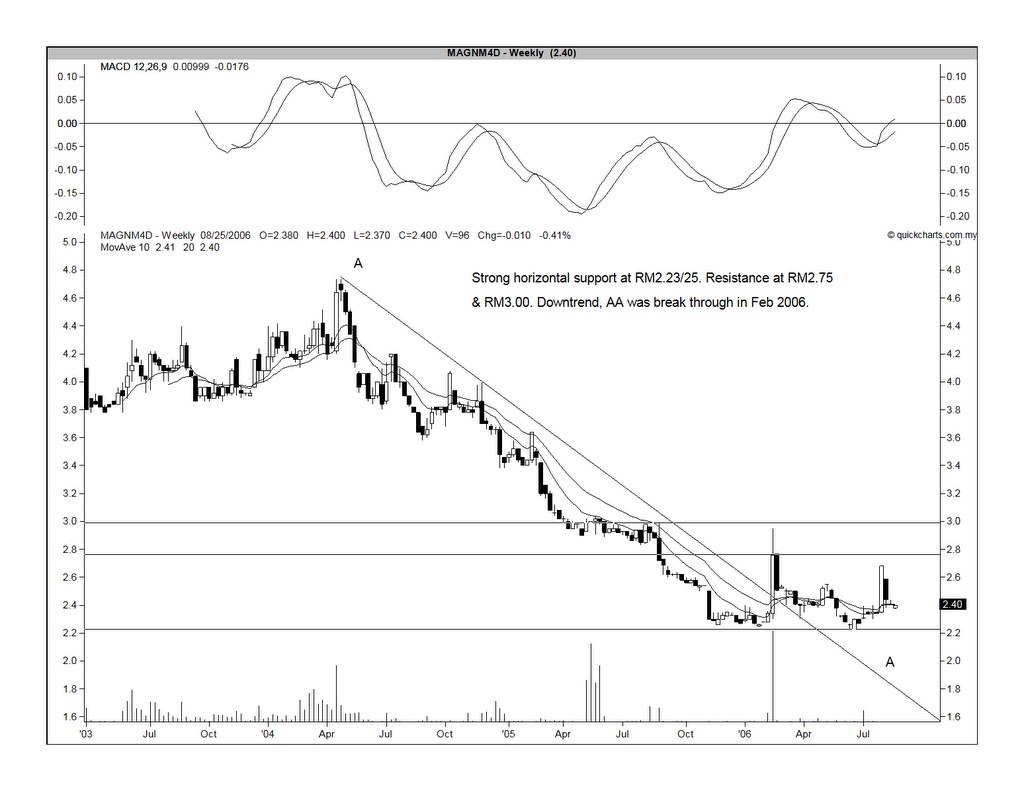
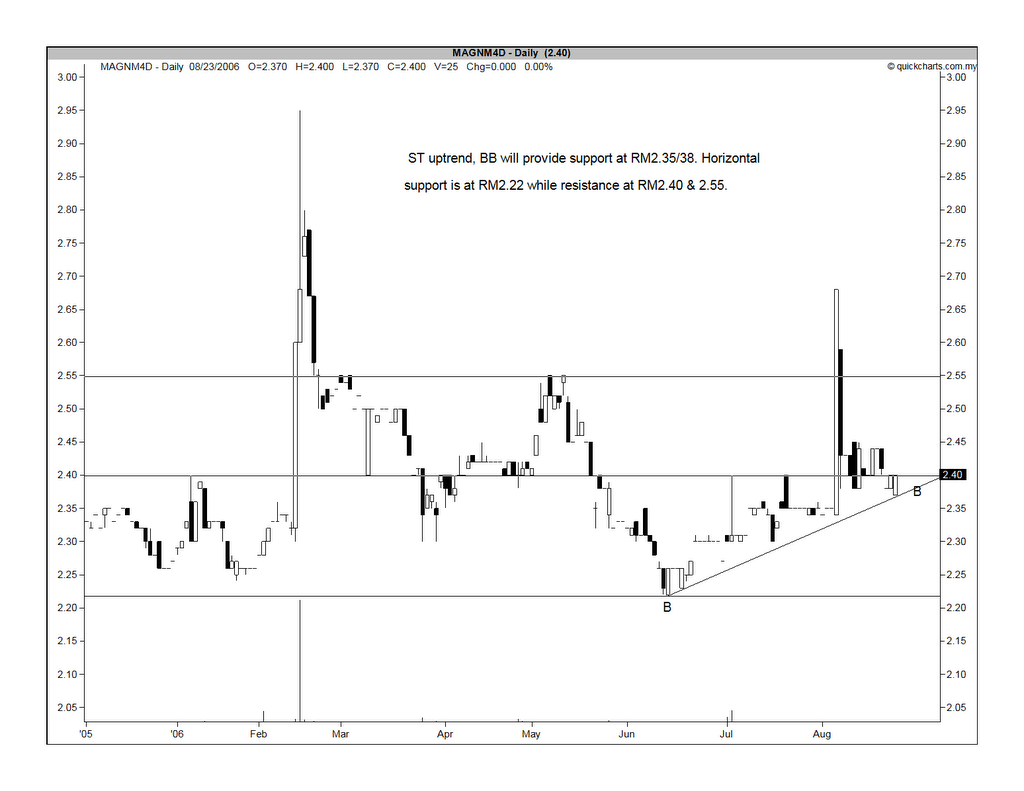
Magnum4D has broken out of its downtrend line at RM2.40 in w/e Feb 17, 2006. Since the breakout, it has been moving sideway (see Chart 1 below). From the daily chart (Chart 2), we can see that Magnum4D is in a ST uptrend, with support at RM2.38.


Chart 1: Magnum4D's weekly chart as at August 23


Chart 2: Magnum4D's daily chart as at August 23

Recommendation

Based on cheap valuation & good technical set-up, I believe Magnum4D to be an excellent investment choice.

Wednesday, August 23, 2006

Plenitude- a cheap property stock

Background

Plenitude Bhd (“Plenitude”) is involved in property development & investment. Its major projects include Taman Desa Tebrau in Johor Bahru, Taman Putra Prima in Puchong, Bandar Perdana in Sg. Petani and Changkat Kiara in Sri Hartamas. Its property development is likely to last for the next 10-15 years as it has a large landbank of about 2000 acres, located in Johor Bahru & the Klang Valley.

Current Financial Performance

It reported a poorer performance for 4Q2006. Its net profit dropped by 10.6% q-o-q or 25.9% y-o-y to RM 13.3mil. This was despite a higher turnover, which has increased by 15.8% q-o-q or 7.3% y-o-y to RM 63.9 mil. Nevertheless, we can take comfort in knowing that Plenitude's financial performance for 2006 is better than last year's performance. Its turnover for FYE 2006 is 14.0% higher than that of FYE 2005. Consequently, its net profit is 6.4% higher at RM 52.4 mil.


Valuation

S&P has forecast a 2007 EPS of 48.6 sen for Plenitude in its research report dated August 22, 2006. This is an increase of almost 10 sen from the 2006 EPS of 38.8 sen. If we average the unaudited 2006 EPS & S&P's 2007F EPS, it works out to be about 43.7 sen. Based on this figure & the share price of RM1.48 (today's closing price), Plenitude is now trading at a PE of 3.4 times.

Because of the cheap valuation, S&P has a STRONG BUY on Plenitude, with a 12-mth target of RM1.78.

Technical Picture

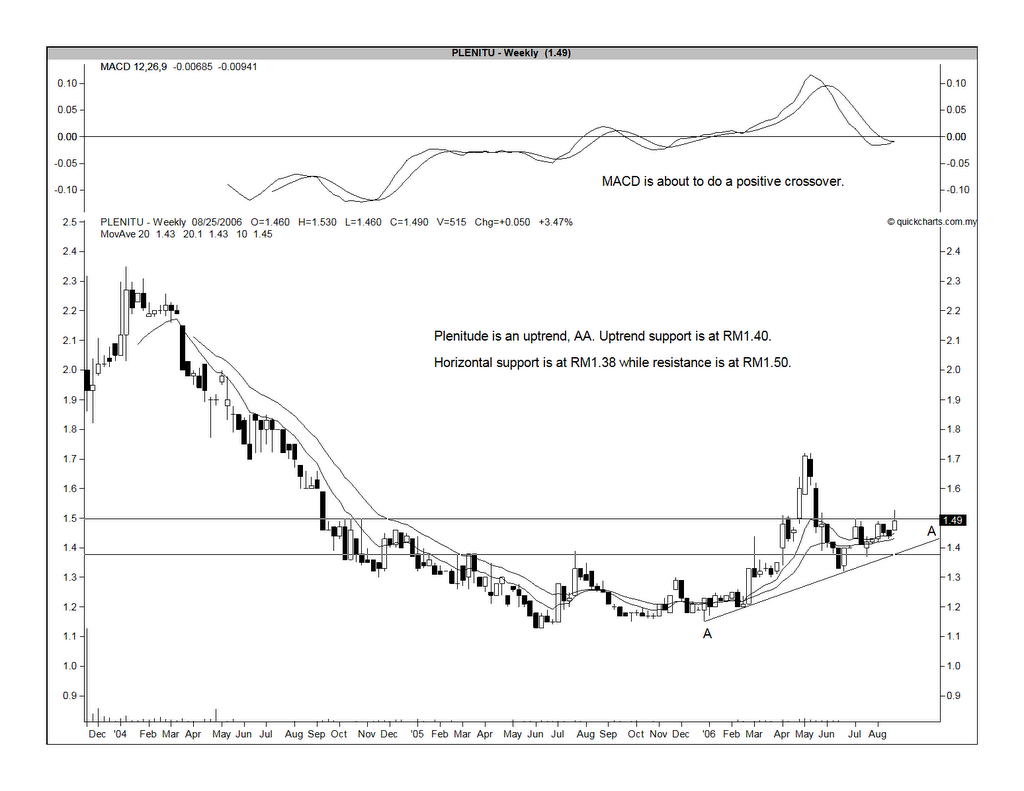
Plenitude is in an uptrend, with the support at RM1.40. Immediate horizontal support & resistance are at RM1.38 & RM1.50, repectively.


Chart: Plenitude's weekly chart as at August 22


Recommendation

I believe Plenitude is a very good property stock that is trading now at very undemanding valuation.

Choo Bee- a good LT investment

Background

Choo Bee Metal Industries Bhd (“Choo Bee”) is involved in the processing of steel coils into steel pipes & other related products and trading of hardware products.

Current Financial Performance

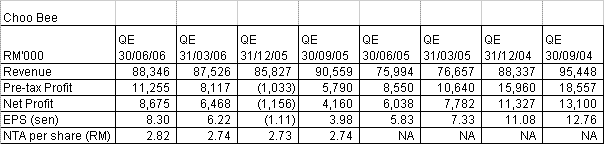
It reported an improved performance for 2Q2006. Its net profit increased by 34.1% q-o-q or 43.7% y-o-y to RM 8.7mil. Turnover has increased by a lesser quantum of 0.9% q-o-q or 16.2% y-o-y to RM 88.3 mil.

The latest 4 quarters’ cumulative turnover is 4.7% higher than the preceding 4 quarters’ turnover. Despite the higher turnover, net profit for the same periods is lower by 52.6% from RM 38.2 mil to RM 18.1 mil. The drop in net profit was due substantially to the writing down of inventory totaling RM 13.4 mil, which were carried out in QE 31/12/2005 & QE 30/09/2005.

Going forward, Choo Bee may benefit from the greater demand for its pipes, both from the water sector as well as from the oil & gas sector.


Valuation

Based on the EPS for QE 30/06/2006 & QE 31/03/2006 totaling 14.52 sen, the annualized EPS of Choo Bee is estimated to be about 29.04 sen. This is slightly higher than S&P's forecast of 2006 EPS of 26.2 sen in its report dated August 22, 2006. S&P has rated Choo Bee as a STRONG BUY with a 12-mth target of RM1.98.

Based on EPS of 29 sen & share price of RM1.56 (today closing price), Choo Bee is now trading at a PE of 5.4 times.

Technical Picture

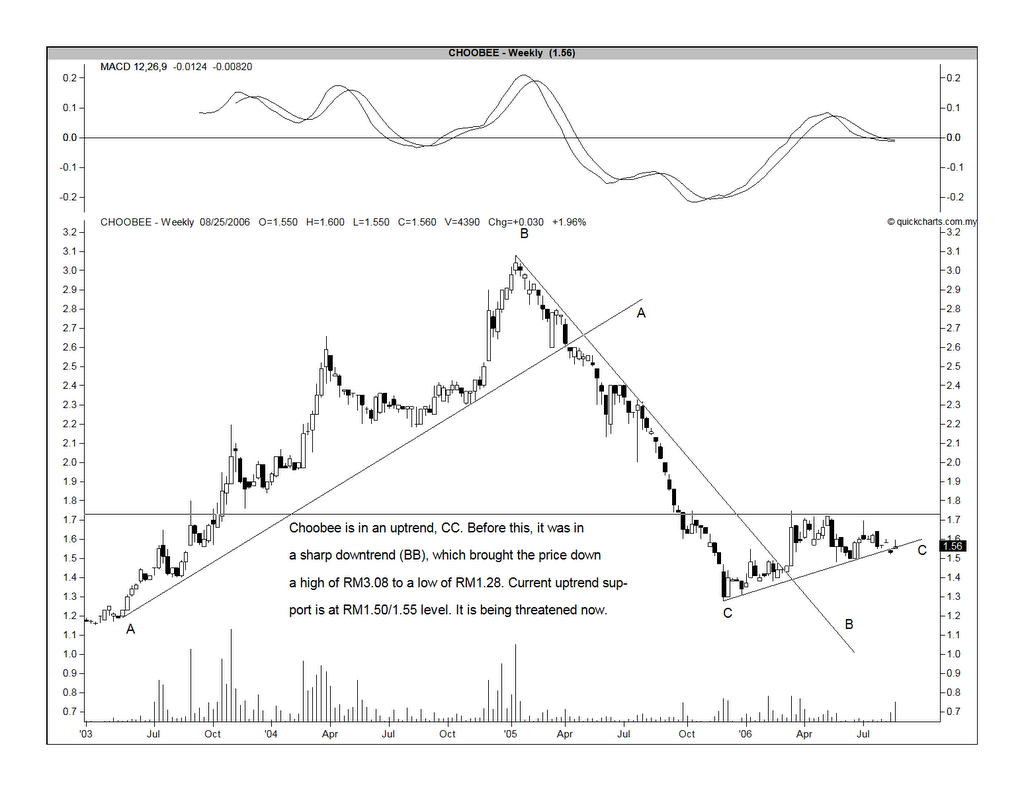
As noted below, Choo Bee is in a ST uptrend, with support at RM1.50/1.55. Overhead horizontal resistance is at RM1.73.


Chart: Choo Bee's weekly chart as at August 22

Recommendation

Based on fairly cheap valuation, Choo Bee is considered a good LT investment.

WWE- a very good set of results for 3Q2006

Background

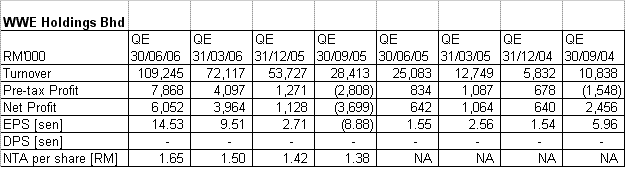
WWE is mainly involved in the undertaking of water, wastewater and other related environmental projects. Yesterday (August 22), it has announced a very good set of financial results for 3Q2006. The net profit increased by 52.7% q-o-q or more than 7-fold y-o-y to RM6.1 mil. Turnover has also jumped by 51.5% q-o-q or more than 2-fold y-o-y to RM109 mil. The cumulative latest 4 quarters' net profit increased by 55% to RM 7.4 mil from RM 4.8 mil in the preceding cumulative 4 quarters. This is on the back of an almost 3-fold jump in turnover from RM 55 mil to RM 264 mil.

The improved performance is due to the booking in of the jobs done for the Jelutong Sewage Treatment Plant and Central Sludge Facility Phases 1 and 2 in Penang Island (contract sum: RM468,260,693 & contract period: 36 months from December 1, 2004).

In addition, WWE has also been awarded an overseas contract via Letter of Award dated December 11, 2004 for the Construction Of Branch Sewer Networks in North Central Districts of Jeddah by Civil Works Company Ltd (CWC) of the Kingdom of Saudi Arabia (contract sum: Saudi Riyal 408,000,000 [RM417million] & contract period: 32 months from June 4, 2005).


Valuation

In the latest 4 quarters, WWE booked in EPS totaling 17.87 sen but the latest 2 quarters' EPS is actually higher at 24.04 sen. This is because of WWE registered a loss in QE30/9/2005 of RM 3.7 mil, partly due to impairment loss of RM 1.58 mil & higher operating expenses. If we compute the full year's EPS basing on the latest 2 quarters' EPS of 24.04 sen, it will come to an amazing figure of 48 sen. While this maybe more reflective of the current performance of WWE, I would discount it by 30% to take into account some risks that we have overlooked. So, the "final" EPS is 33 sen.

Based on this & WWE price of RM 0.83 now (at 9.30 a.m. Aug 23, 2006), the PE is a very low 2.5 times.

Technical Picture

The weekly chart (Chart 1) shows WWE to be in a downtrend line with a bullish breakout at RM0.80. At the opening bell this morning, WWE has already done a breakout. From the daily chart ( Chart 2), you can see that the support given by the current ST uptrend line at RM0.70 would be an ideal entry to this stock.


Chart 1: WWE's weekly chart as at Aug 22


Chart 2: WWE's daily chart as at Aug 22

Recommendation

Based on the above, WWE looks like a very good investment. Since the share has jumped this morning, you may choose to stagger your buying in case the share price were to retrace the current bullish spur.

Tuesday, August 22, 2006

PLUS could be a good buy if it can break above RM2.72.

Recent Development

PLUS Expressway Bhd ("PLUS") has been affected by a stagnant traffic growth for the past 3 months. Its flagship concession, the North South Expressway ("NSE") has registered a traffic growth rate of 0.4% in March, 0.6% in April and 0.4% in May. This is well below the forecast furnished in its prospectus issued in 2001 when PLUS applied for its listing on KLSE. In that forecast, traffic for NSE is projected to grow at 5.4% for 2006.

The drop in the traffic growth rate is attributed to the unexpected 30 sen hike in petrol price in March this year. This has caused some commuters to seek alternative means of transport or even cutting back on long-haul/outstation trip.

Current Financial Performance

The latest available quarterly result is for QE 31/3/2006. The results for QE 30/6/2006 is likely to be announced in the 3rd week of this month. Since the traffic on the expressway was still growing, albeit at a much slower rate, I expect the result for QE 30/6/2006 to be in line with the past few quarters' performance. As such, PLUS' EPS is likely to be about 17 sen.


Valuation

Based on this morning (August 22)'s closing price of RM2.70 & EPS of 17 sen, this will give you a PE of about 15.9 times.

An old CIMB's research report dated Nov 25, 2005 (the only one that I've managed to get my hands on) has computed a DCF-based target price is RM3.96 for PLUS. This target price may have to be revised downward since the overnight policy rate (OPR) have been revised upward from 2.7% in November 2005 to 3.5% today.

Technical Outlook

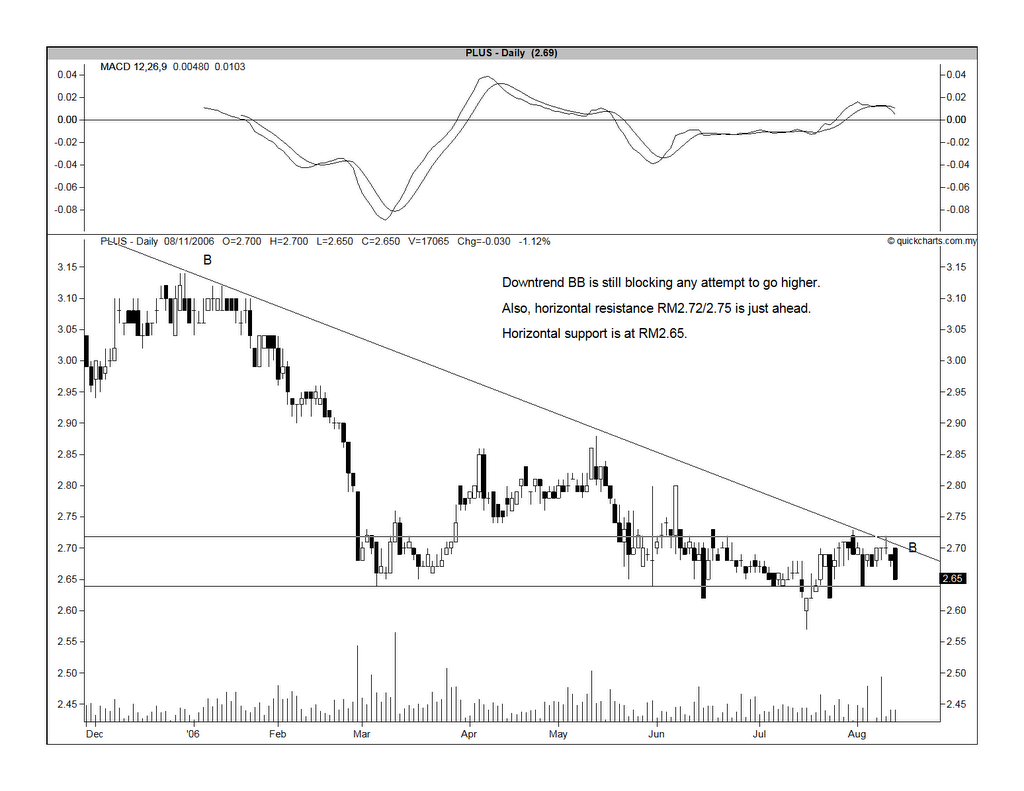
PLUS made a high of RM3.42 in August 2005 & since then, it has been drifting down. The recent low was RM2.57 in July. If PLUS' share price can surpass the downtrend line at RM2.72, the current downtrend could be over. See Chart 1 & 2 below.


Chart 1: PLUS' weekly chart as at August 21


Chart 2: PLUS' daily chart as at August 21

Recommendation

Based on the above, PLUS could be a good LT investment if the share price can break above RM2.72 convincingly.

Monday, August 21, 2006

Megan Media- too cheap to ignore

Business Activities

Megan Media Corp Bhd ("Megan”) is involved in the production of CDs, DVDs & Video Tapes. The group has undertaken a fair extensive expansion program in the past 2 years, which saw it taking over another company within the same business from its parent company.

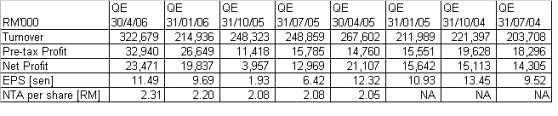
Past & Future Financial Performance


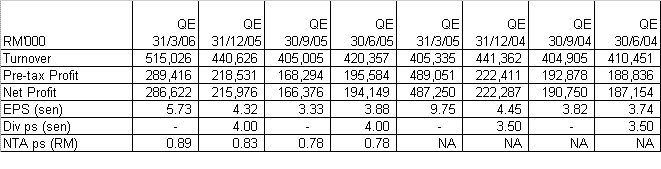
From the above, we can see that Megan's turnover has grown from RM 98.8 mil in FYE 2001 to RM 1.034 billion in FYE 2006. During that period, its net profit had tripled from RM 18.3 mil to RM 60.2 mil. Based on S&P's research report dated July 4, Megan is expected to report a net profit of RM 83.0 mil for FYE 2007 on the back of turnover of RM 1.062 billion. 2007 EPS is forecast to be about 40.4 sen.

Current Financial Performance


If you compared the last 4 quarterly results with the preceding 4 quarterly results, you can see that net profit has declined by 9.0% from RM 66.2 mil to RM 60.2 mil. EPS has dropped by 36.1% from 46.2 sen to 29.5 sen. The poorer net profit came about despite a 14.4%-increase in turnover from RM 904.7 mil to RM 1.035 billion.

Valuation

Based on the closing price today (Aug 21) of RM 0.61 & trailing EPS of 29.5 sen, the stock is trading at a PE of 2.1 times. This is very cheap. It is equally cheap when you compare the share price to its book value; giving a price to book of only 0.25 times.

Technical Outlook

Megan made a high of RM2.36 in w/e Jan 9, 2004. Since then, it has been in a downtrend. There are 3 levels where the stock has some good supports i.e. RM1.25, RM1.00 & RM0.56/0.57. It broke through the first 2 supports & it has just tested the third support, which appears to be holding up (see Chart 1 below).


Chart 1: Megan's weekly chart as at July 26

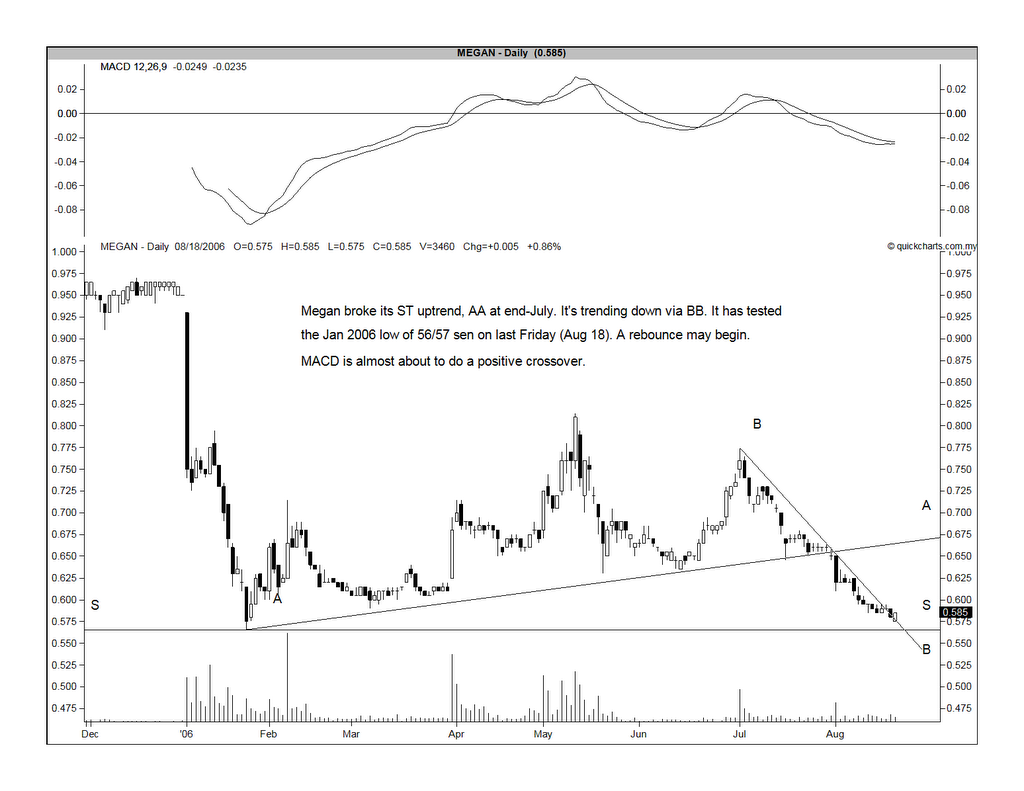
From the daily chart (Chart 2 below), we can see that the stock has tested the RM0.56/0.57 support last Friday (Aug 18). As expected, Megan put in a rebound today & has managed to close at RM0.61. This means that it has broken abouve its immediate downtrend as well as the 10-day MA; both at the RM0.60 level. There is a good chance that the stock may recover from this level.


Chart 2: Megan's daily chart as at July 26

Future Prospect

In the aforementioned July report, S&P has called a SELL on Megan because the optical disc industry is experiencing severe overcapacity (due to over-expansion in China & Taiwan). The situation is so bad that Megan has opted to outsource some of its production rather than expanding its in-house capacity. Out-sourced products only enjoyed a margin of 2-3% as compared to 25-30% margin for in-house products.

In addition, SJ Securities in its July 4 report has upgraded its rating of Megan to a HOLD from a SELL (which is based on its report dated Apr 6). SJ Securities is still uncomfortable with the high gearing of Megan.

Weakness noted

The weaknesses are as noted in the 2 research reports i.e. over-capacity in the industry & high gearing. After looking through its balance sheet as at April 30. 2006, I've ascertained that the group's bank borrowings totaled RM838.7 mil as compared to its shareholders' funds of RM470.7 mil. This gives a gearing ratio of 1.78 times.

Recommendation

Based on cheap valuation, I would believe that Megan to be a good long-term investment. The negative news is probably all priced in at this level. While the technical picture has yet to turn positive, I feel that the downside risk is very low.

Landmark- Greenmail & White Knight.

I've read this piece of news with mixed feeling. As reported, Syed Yusof and parties close to him has sold off their 17% stake in Landmarks at RM2 apiece. The buyer is reportedly gaming and power group, Genting Bhd.

The report states that Syed Yusof has successfully completed a greenmail. A greenmail refers to a maneuver in which the buyer of a block of shares (commonly known as the raider) has agreed to sell his shares (normally at a big profit) to the existing owner of a listed company (commonly known as the management). The management offered to buy the block of shares in order to retain control of the listed company.

The Landmark saga could have ended there if the buyer of the block is the management of Landmark. As reported, it is not but instead it is a third party, Genting Bhd. The question that immediately springs to mind is whether Genting is merely acting as a conduit to complete the buyback by Landmark's management or has Genting acted independently. If it is the latter case, has Genting made a similar arrangement with Landmark's management? If so, Genting could end up with Syed Yusof’s 17% stake plus the management’s stake of 18.65% (or, 26.7% if you include in the stake held by Dynaura Trading Sdn Bhd, a party deemed friendly to the management). If so, Genting would have ended up with a stake of between 35.65% & 43.7% in Landmark & would have to make a general offer for Landmark at RM2.00 apiece. So, which is it?

Over the next few days, I expect uncertainty to rule the share price of Landmark. If the management has bought back the shares via Genting, the share price will drop back. You may want to take profit as soon as possible, in that scenario. If Genting were to announce latter that it has done a similar deal with Landmark’s management, Genting will have to offer to takeover Landmark at RM2.00 apiece. In this scenario, you have to weigh the opportunity cost of going for the GO as compared to sell into the market now (the price at 10.00 a.m. is RM1.86).

The one thing that you can safely rule out is that Genting has stepped into Syed Yusof's shoes & pursue a hostile takeover of Landmark. Genting, which makes its money from the sensitive casino business, will not go down that route.

Saturday, August 19, 2006

Linkfest

Linkfest time, again.

1. Trader Feed explains why it’s so easy to lose money in the market. He also looks at what can contribute to profitability. If nothing works, you can take some consolation in knowing that trading can teach you a thing or two about life.

2. Bill Miller is quite a legend in the world of funds management. He is the manager of the Legg Mason Value Trust, the only mutual fund to beat the Standard & Poor's 500 index for each of the last 15 years. The fund is probably related to Legg Mason Inc, which has acquired 12 million Green Packet shares at RM2.625 per share in July 4 this year.

Anyway, the fund managed by Miller was in the news recently for the wrong reason. It was off 5.67% in the second quarter; it has lost nearly 9% this year, making it pretty much the worst large-cap stock fund out there in 2006. Miller admitted that the fund’s under-performance might be due to it being over-weight on big-name Internet stocks and under-weight on the high-flying energy sector. But Barron has offered an alternative theory why Miller is flagging: This summer he bought a humongous yacht.

3. How to earn Warren Buffet-like returns? Invest like Warren Buffet.

4. One theory why the market is inefficient?

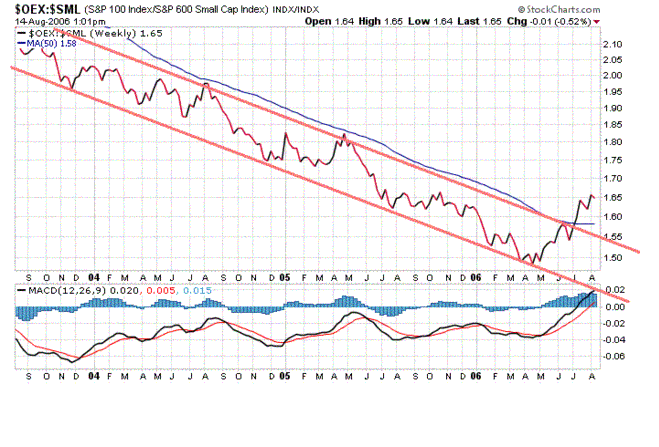
5. Big Picture’s Barry Ritholtz thinks 2007 may be the year of the big cap. How did he come to this conclusion? Well, Barry has been tracking the ratio of Big Caps (S&P100) to Small Caps (S&P600) for sometimes. "When that ratio is trending lower, the small caps are outperforming the big caps. When its trending higher, the big caps are doing well... It's apparent that, after 3 years, the downtrend ("Channel") of this relationship has been in has been broken, as has the 50 week moving average." See the chart below.


6. Roubini talks about the similarities between 2006 & 1987.

7. Some really scary forecasts from some big-time Wall Street analysts.

8. Mark Leibovit, who was ranked the top intermediate—term market timer for the 10- year period through year-end 2002 by Timer Digest, thinks otherwise.

9. From Humblemoney, we have 11 Trading lessons:

(1) invest in your business
(2) question orthodox thinking
(3) be patient
(4) be flexible
(5) be consistent
(6) network
(7) trade small
(8) have the courage to win
(9) analyze your results
(10) maintain perspective
(11) walk your own path

Read all about them here.

10. 8 principles of strategic wealth management from GARP, the Global Association for Risk Professionals.

(1) Take charge and do it early.
(2) Align family and business interests around wealth-building goals and strategies.
(3) Create a culture of accountability.
(4) Capitalize on your family's combined resources.
(5) Delegate, empower, and respect independence.
(6) Diversify but focus.
(7) Err on the side of simplicity where possible.
(8) Develop future family leaders with strong wealth management skills.

Read all about them here

Friday, August 18, 2006

MPI reported good profit for QE 30/6/2006 but Unisem is cheaper

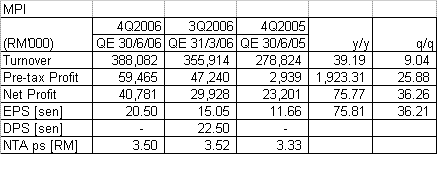
MPI's net profit increased by 36.3% q-o-q or 75.8% y-o-y to RM40.8 mil on the back of an increased turnover of RM388 mil. Turnover has increased by 9.0% q-o-q or 39.2% y-o-y (see Table 1 below).

As such, MPI's EPS for the 2H2006 amounts to 35.55 sen while its full year's EPS is 53.86 sen. Using only the 2H2006 EPS as a base, we can arrived at an EPS of 71.10 sen for FYE2007. Based on yesterday (Aug 17)'s closing price of RM10.10, MPI is now trading at a PE of 14.2 times its 2007 EPS.


Table 1: MPI's Financial Results for QE 30/6/2006

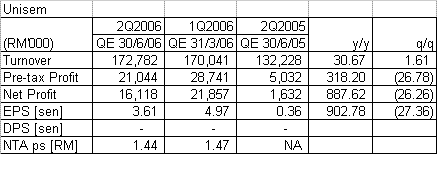
On the other hand, Unisem's net profit increased by almost 9 folds y-o-y to RM16.1 mil on the back of a 30.7%-increase in turnover of RM173 mil. Net profit has, however, dropped by 26.2% q-o-q while turnover has only increased by 1.6% from the immediately preceding quarter (see Table 2 below).

Unisem's EPS for the 1H2006 amounts to 8.58 sen. Based on this, we can arrived at an annualised EPS of 17.16 sen for FYE2006. Based on yesterday (Aug 17)'s closing price of RM1.50, Unisem is now trading at a PE of 8.74 times its 2006 EPS. Based on PE comparison, Unisem looks like a cheaper stock than MPI.


Table 2: Unisem's Financial Results for QE 30/6/2006

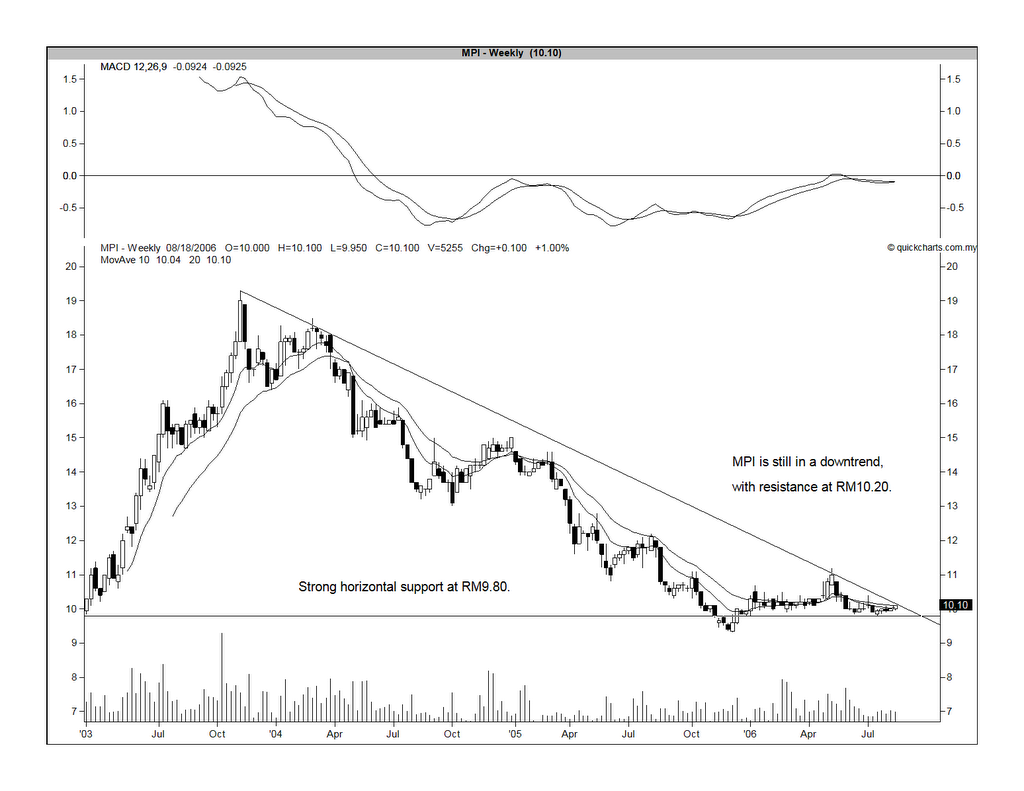
The technical picture of MPI & Unisem are quite similar. Both have yet to break above their respective downtrend lines (RM10.20 for MPI & RM1.65 for Unisem). A break above this level would make each stock a BUY. Their charts are appended below.


Chart 1: Unisem's weekly chart as at August 17


Chart 2: MPI's weekly chart as at August 17

Suiwah dipped below RM2.00

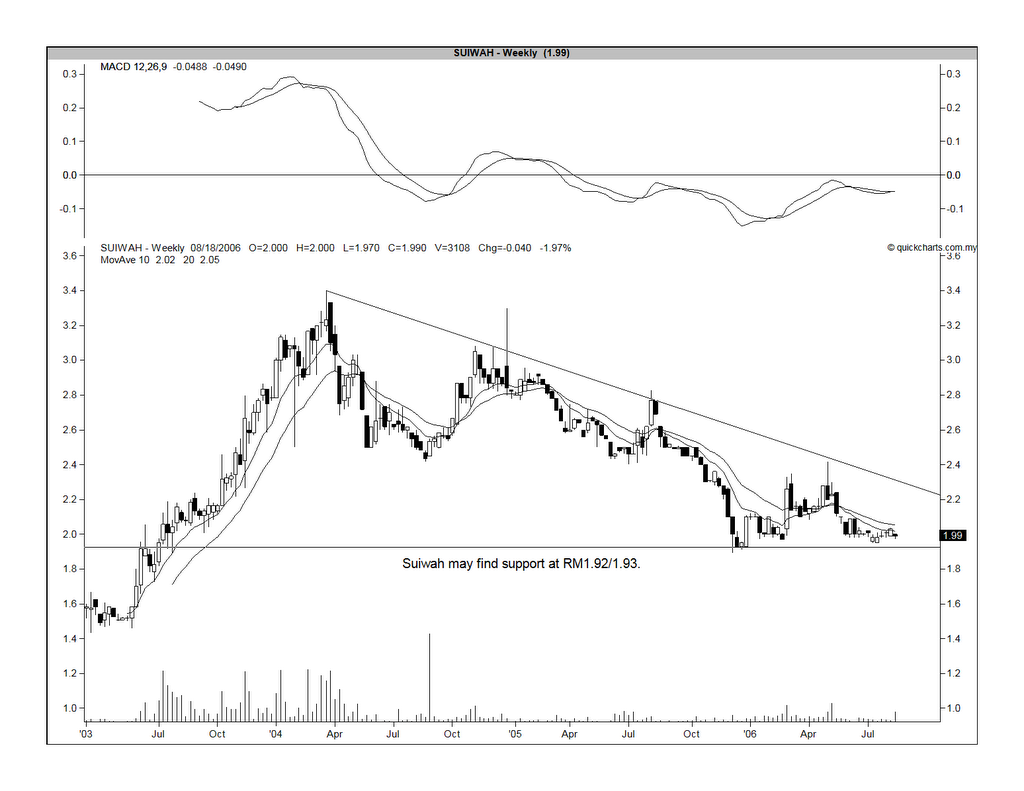
On July 13, I have recommended a BUY on Suiwah based on fundamental consideration. The share has recently dipped below the psychological level of RM2.00. After further studies, I've discovered that the RM1.90-2.00 level for Suiwah is a congested support area. Until it broke below the RM1.90, I would not be too unduly worry about the recent technical weakness in this share.


Chart 1: Suiwah's daily chart as at August 17


Chart 2: Suiwah's weekly chart as at August 17

Courts broke its recent low of RM 0.82

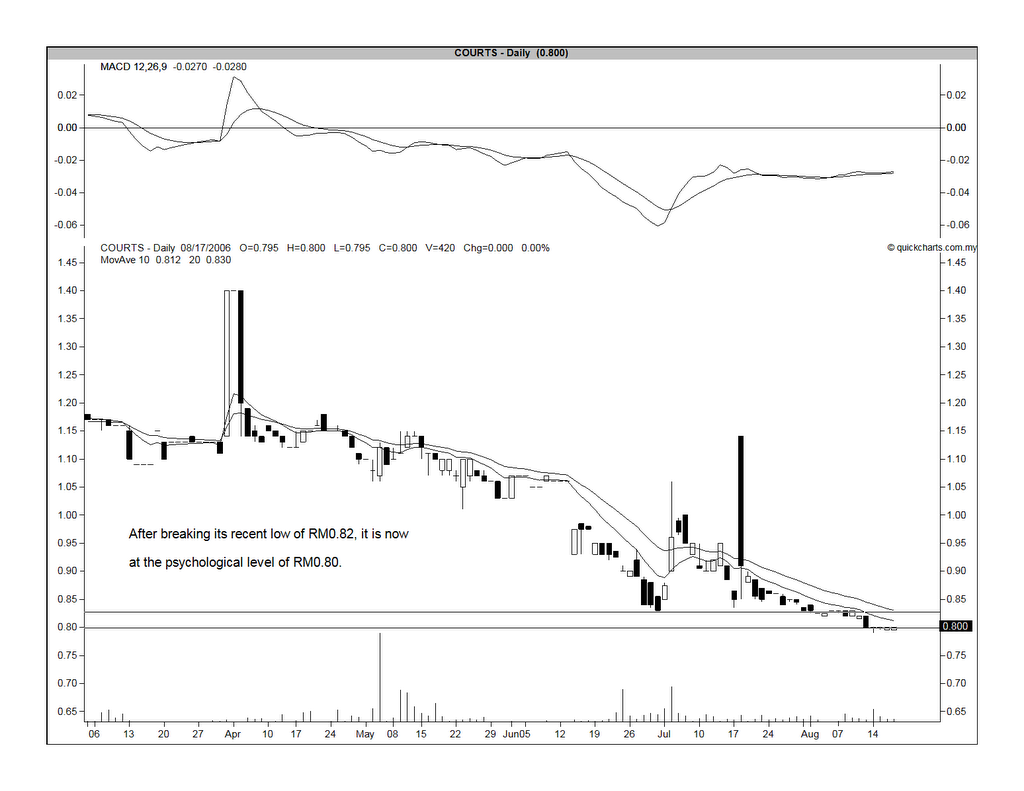
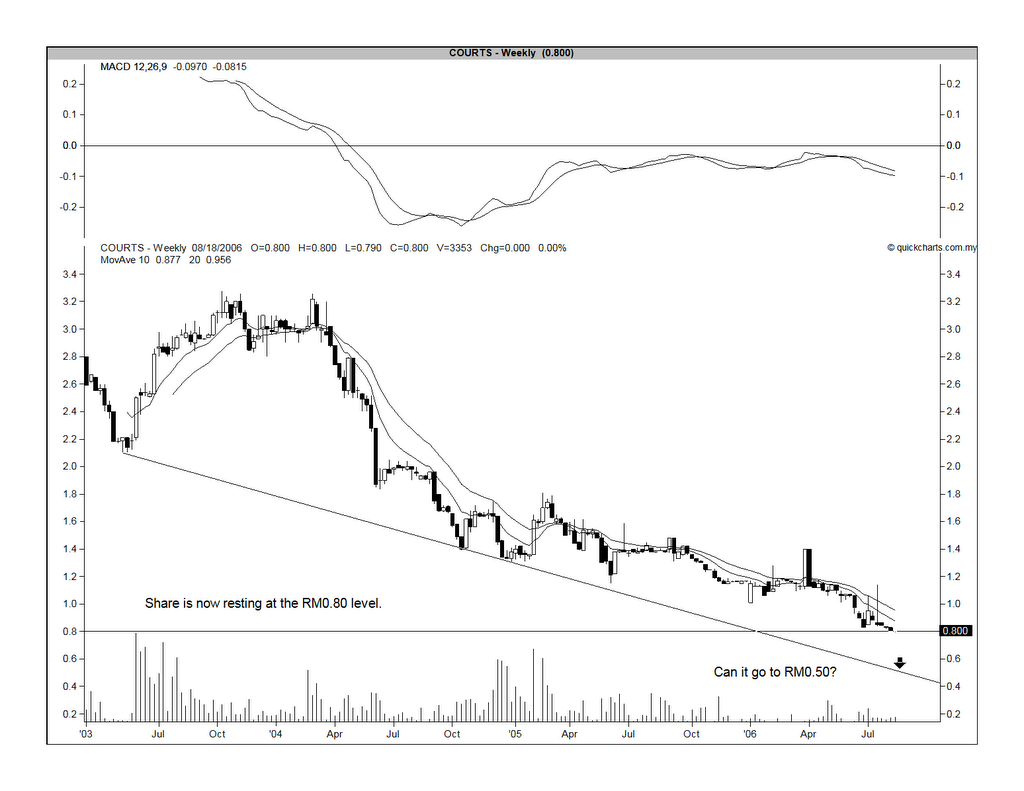
On July 21, I've recommended Courts as a Long Term BUY based on break-up valuation at RM1.12. The stock has recently made a new low of RM0.79/0.80, which is marginally lower than the recent low (support) of RM0.82. As Courts was not a BUY call based technical consideration, I shall maintain my recommendation for this stock. Nevertheless, I like to point out that a break below RM0.80 may bring forth further selling.


Chart 1: Courts' daily chart as at August 17


Chart 2: Courts' weekly chart as at August 17

More results announcement from Steel players

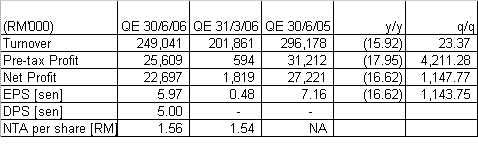
Onasteel, Lion Industries ("Lion Ind") & Lion Corp had reported their results for QE 30/6/06. The result for Onasteel is very encouraging. Net profit increased 11 folds to RM22.7 mil q-o-q on the back of a 23%-increase in turnover to RM249 mil. On a y-o-y comparison, net profit & turnover are off by 16.6% & 15.9% , respectively (see atble 1 below).


Table 1: Onasteel's Financial Results for QE 30/6/06.
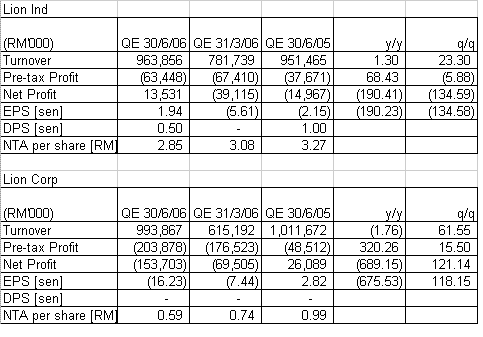
The results for Lion Ind & Lion Corp are harder to analyse because they are both conglomerates. From a study of the notes to the account, Lion Ind reported a 29%-drop in the operating loss for the Steel division to RM14.7 mil on the back of 30%-increase in turnover to RM807 mil for QE 30/6/2006 when compared to the immediately preceding quarter. For Lion Corp, the Steel division has also reported a 41%-drop q-o-q in its operating loss to RM43.8 mil on the back of a 66%-increase in turnover to RM973 mil for the same period. I have appended the results for QE 30/6/06 for these companies for your viewing.


Table 2: Lion Ind & Lion Corp's Financial Results for QE 30/6/06.
So, we are still awaiting more results that may confirm the recovery in the steel sector is for real.

APM reported a decent 2Q2006

Despite the slowdown in the auto sector, APM reported a decent result for 2Q2006. Net profit increased 7.6% q-o-q to RM16.3 mil on the back of a 2.0%-increase in its turnover of RM234.5 mil. But, the bottomline & topline were lower than the corresponding quarter in 2005 by 6.2% & 1.3% , respectively. See the Table below for the result for 2Q2006.


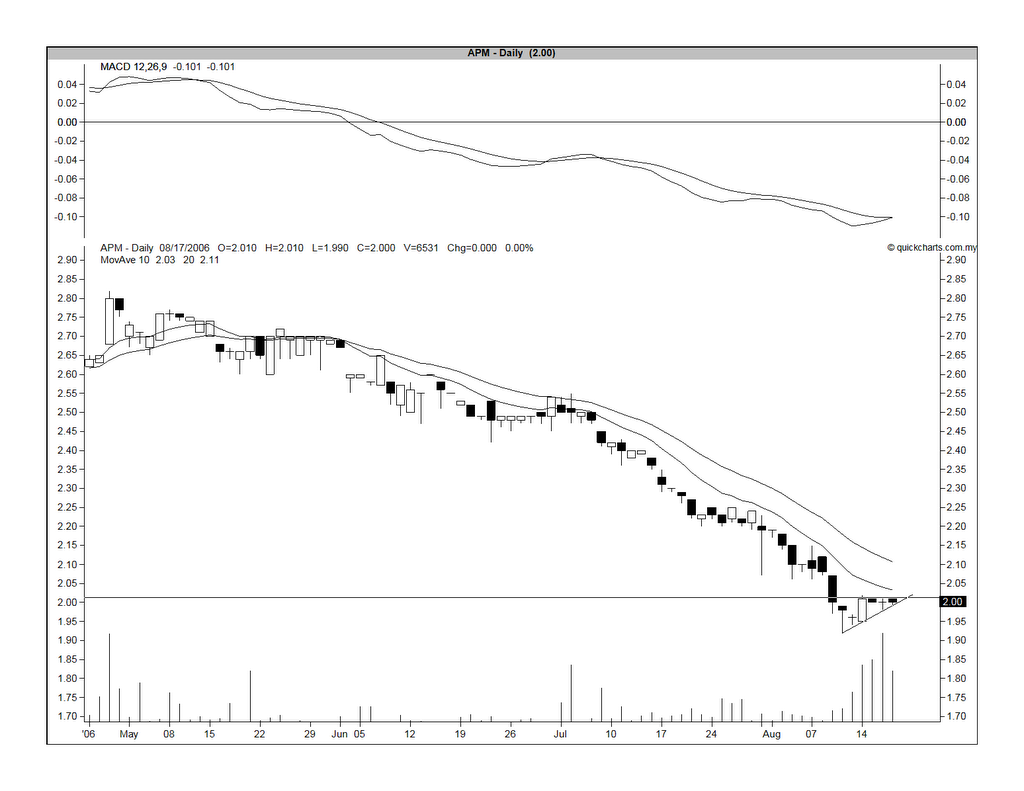
Recently, APM has broken below its strong horizontal support of RM2.20 (see Chart 1 below). It has dropped to a low of RM1.92 before recovering to stay above the RM2.00 mark. A bottoming process has begun & an ascending triangle can be seen. A break above RM2.02/2.03 could lead to further recovery in the share price in the short-term (see Chart 2 below).
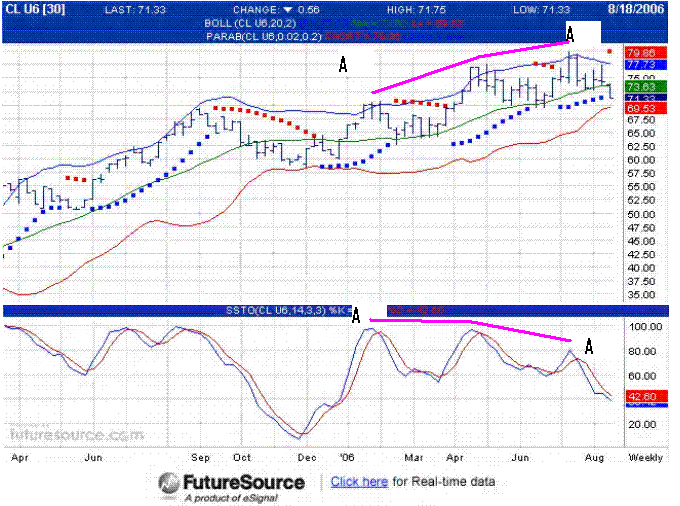


Chart 1: APM's monthly chart as at August 17


Chart 2: APM's daily chart as at August 17

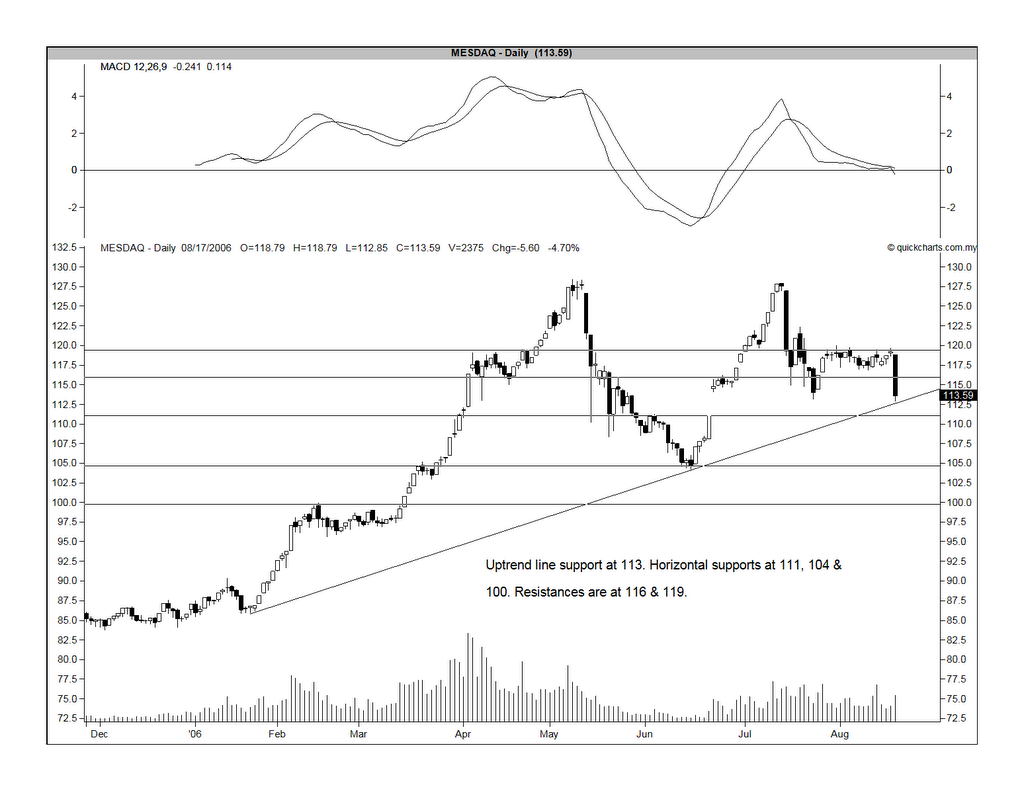
Mesdaq at the uptrend line support of 113

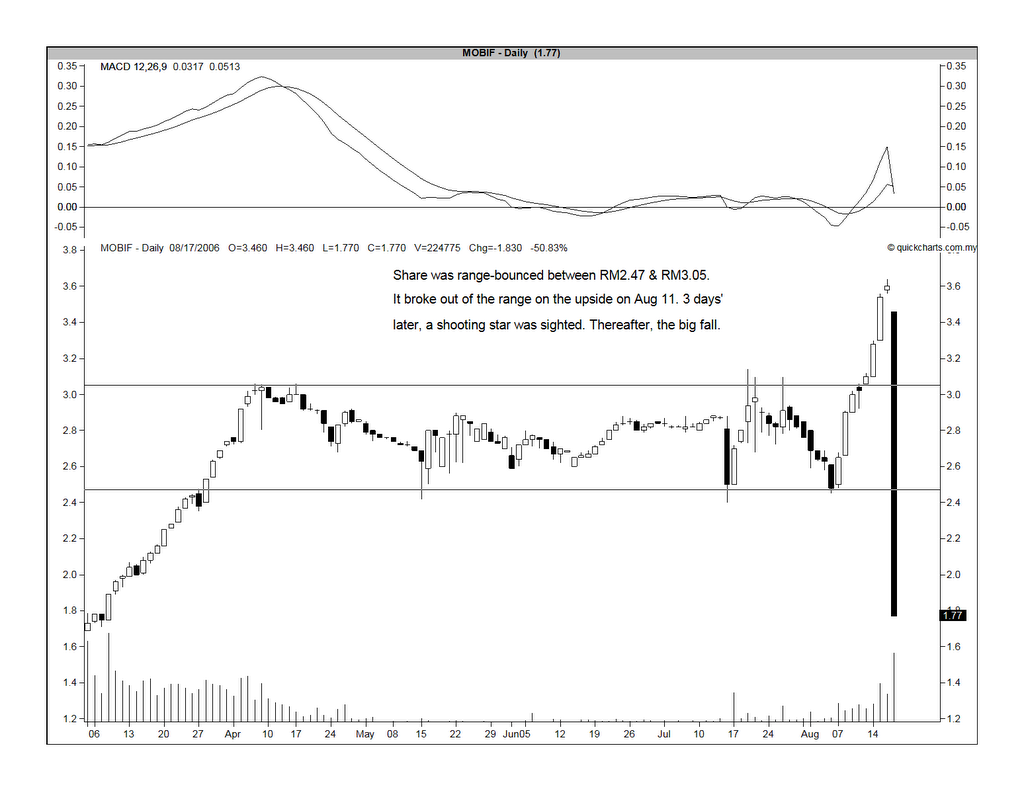
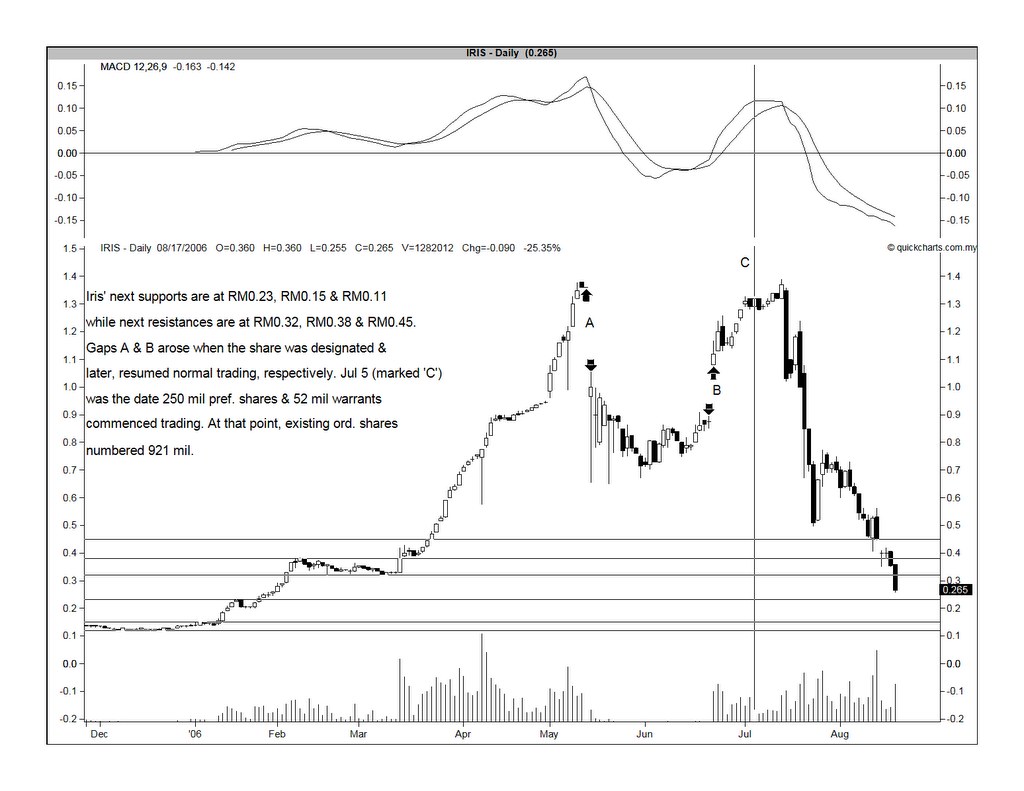
Yesterday, the Mesdaq had one of its worst days when 2 of its outstanding performers i.e. Iris & Mobif came down sharply. Iris, the rise of which epitomizes the rise of the Mesdaq in the past 6 months, continues its steady decent after making its double top at RM1.39 on July 13. Yesterday, Iris dropped 9 sen or 25% to 26.5 sen (see Chart 1 below). Mobif has dropped by an even bigger margin of 51% or RM1.83 to RM1.77 yesterday (see Chart 2 below). Unlike Iris, Mobif’s drop yesterday was its first day of selldown and its shareholders will likely to have many more anxious days ahead.


Chart 1: Iris' daily chart as at August 17


Chart 2: Mobif' daily chart as at August 17

How did these affect the Mesdaq? From Chart 3 below, you can see that Mesdaq is now nearing its uptrend line support of 113. A break below 113 would signal further consolidation ahead. At lower level, horizontal supports can be seen at 111, 104 & 100.


Chart 3: Mesdaq' daily chart as at August 17

Crude Oil just tested the USD70 level!

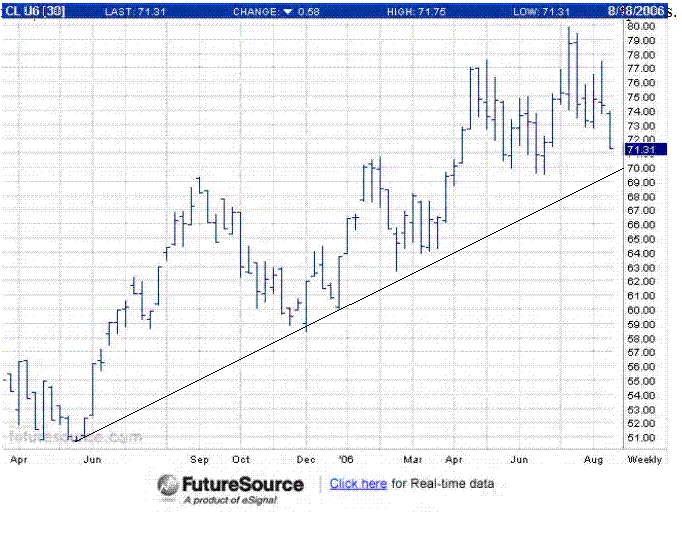
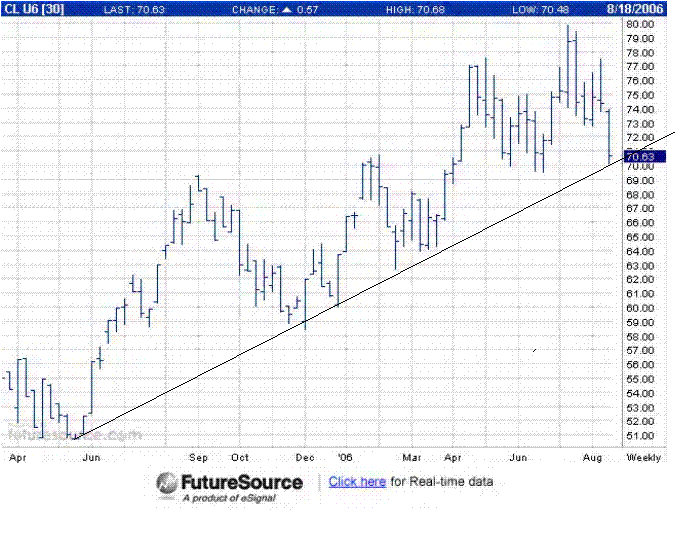
Last night, the Crude Oil has tested the uptrend line at USD70 level & rebounded! See Chart 1 & 2 below.


Chart 1: NYMEX Crude Future's 60-minute chart as at 20.30 GMT August 17


Chart 2: NYMEX Crude Future's weekly chart as at August 17


Before going further, I like to point out that the crude oil price in all the charts here refers to the price of Light Crude Oil that is traded as NYMEX Crude Future. The quote for this future contract can be easily obtained from Bloomberg (go here). The charts used here are obtainable from FutureSource's iFC Marketcenter.

Some of you may wonder why I am tracking the price of crude oil. Crude oil's recent price rise has contributed significantly to the rise in inflation rate. There are obviously other reasons for the spike in inflation rate, such as easy monetary policies adopted by the Fed & other central banks throughout the world from 2002-2004, etc. But, the accelerating price of crude oil has been the most watched phenomenon & if the crude oil rally were to weaken substantially (or, better still, to reverse downward), the positive implication of a less restrictive monetary policy that follows, would be most welcomed by equity investors.

Thursday, August 17, 2006

Crude Oil about to test its uptrend line at USD70

Recently, the crude oil was spooked by a series of negative news. These include the war in Lenanon and pipeline leaks in Russia and, later on, in Alaska. All these were happening as the US was about to enter the Hurricane season and, as expected, it helped to push up the price of crude oil to almost USD80.

However, if we compare the price movement with one of the indicators i.e. the Slow Stochastic, we could see that as the price of crude oil was making new highs in the past 7 months, the Slow Stochastic is actually making lower highs (see Chart 1 below). I have highlighted the 3 highs of the crude oil price and the 3 accompanying highs of its Slow Stochastic in pink & marked as "AA". The bearish divergence is indicating to us that the internal of the crude oil rally is weakening.


Chart 1: Crude Oil overlaid with Bollinger Bands(20,2); Parabolic(20,20,200); & Slow Stochastic(14,3,3,3)

The crude oil is now coming down, reacting to the ceasefire in Lebanon. Other concern for the oil crowd may include slowdown in US & global economy. From Chart 2, we can see that crude oil is clearly in an uptrend line, with the support at USD70. The big question is whether this uptrend line will hold? A break of this uptrend line could be the end of the crude oil rally.


Chart 2: Crude Oil overlaid with uptrend line.

Wednesday, August 16, 2006

CI is going nowhere soon.

The CI appears to be in an upward channel since recovering from the May/June selldown. It has been pushing against the upper channel since Jul 27 but it has not been able to break above it. A re-test of the lower channel could happen if the market corrects over the next few days as it adjusts for the upcoming school holidays from August 19 to 27 (see Chart 1 below).


Chart 1: CI's daily chart as at August 15

The only excitement is in the Plantation sector. The Plantation index is well-supported by its ST uptrend line at 3500 level (see Chart 2 below). The Plantation theme play is starting to broaden out to include some second- & third-liners. One such share is Unico-Desa, which I have made a trading call on Unico-Desa on August 3 when it broke above the RM0.53 horizontal resistance.

Eventhough I am optimistic about the current prospect of the plantation sector, I'm also very cautious as a lot of good news has already been factored into the price, especially amongst its leaders such as IOI, KLK & PPB Oil. The rise of the cheaper stocks could signal the blow-out stage of the plantation theme play. The rewards at this stage are high, as are the risks. As usual, my advice is to have protective stop loss whenever you open a position in this kind of market. Good luck.


Chart 2: Plantation's daily chart as at August 15

Tuesday, August 15, 2006

MISC's 1Q2007 net profit down 29% y-o-y

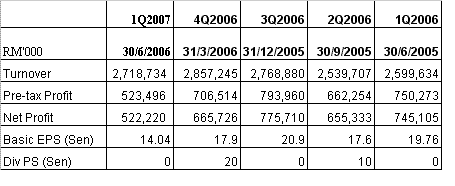
MISC's net profit dropped 29.9% y-o-y to RM522 mil while turnover increased 4.6% to RM2.718 billion (see the Table below). The drop in profitability is attributed to lower freight rates in the container shipping business while the core business of energy shipping is fairly stable. In addition, net profit was also negatively impact by higher bunker expenses due to rising price of fuel from US$260 (RM975) a tonne to US$325 a tonne.


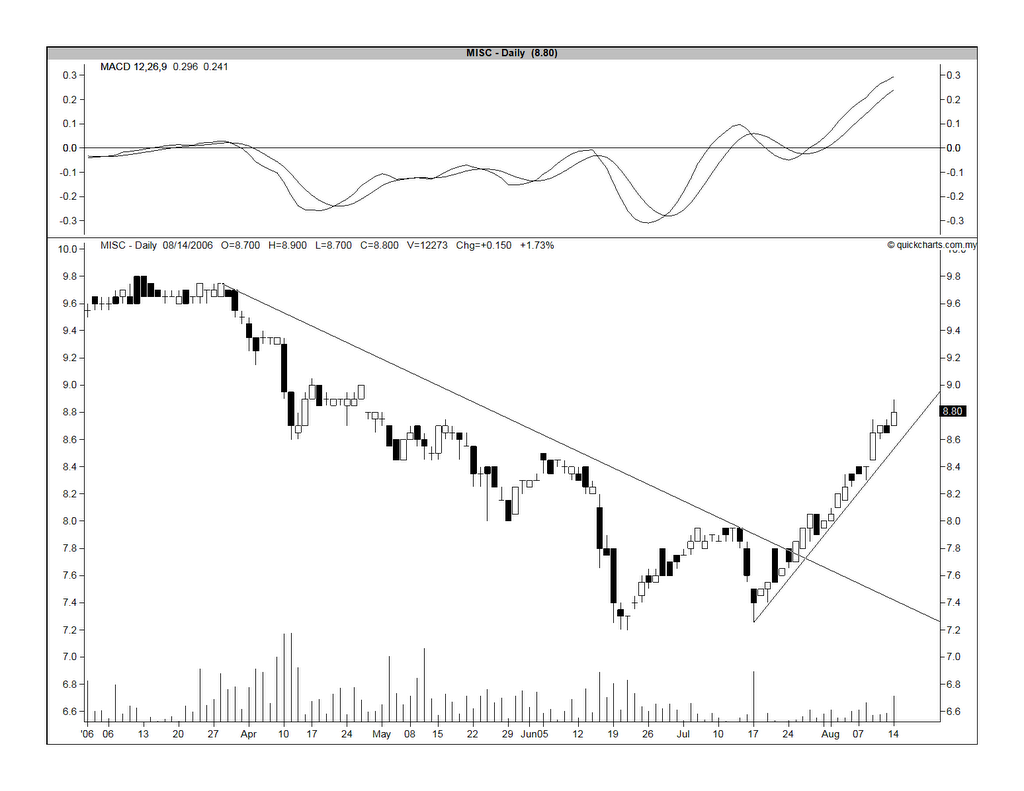
Since my bullish call on August 1, the share price of MISC has gained about 9% to RM8.80, based on yesterday (August 14)'s closing price. The share is in a steep ST uptrend line with support at RM8.60. A break of this uptrend would lead to correction with support seen at RM8.50 and then RM8.00 (see Chart below).


Chart: MISC's daily chart as at August 14

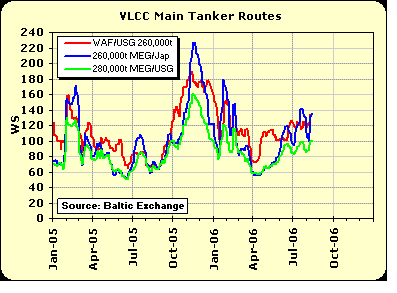
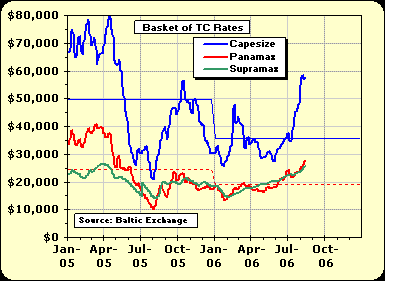
The latest charts on the movement of freight rates for tankers & bulk carriers, which are appended below, are supportive of my view that the rates have probably bottomed.


Chart for VLCC/ULCC Markets w/e 11th August 2006


Chart for Dry Bulk Markets w/e 11th August 2006

Monday, August 14, 2006

From the Edge for w/e 8/20/06

From the current issue of the Edge, we have the following interesting articles:

1. IMP3 to sharpen our edge

The 3rd Industrial Master Plan ("IMP3"), which will be unveiled soon, will deal with the problem of how to broaden our export base as well as how to move from our heavy dependence on the Electronic & Electrical sector to high technology & knowledge intensive activities with high value added content. This is very relevance given the recent lagging performance of our export vis-a-vis other Asian countries, which gave rise to concern about our competitiveness.

2. CPO: How high will it go?

Whenever you read a headline like this, you have asked yourself whether it is time to be a contrarian. Money is never made with information that is openly available to everybody. Some stocks may be worth a trade but on the whole, one has to be very cautious at time like this. When things are too good to be true, normally they are.

3. Mesdaq: A fair share of the Gems

This week's cover story is on Mesdaq. While 38% of the companies listed in this Board reported a negative growth in their net profit, it is heartening to see that 35% managed to report more than 50% growth. The star performers are Green Packet, mTouche, Dreamgate, REDtone, GHL System & AKNMtech. AKNMtech??? A little story is in order here...

AKNMtech was a stock that I had recommended as a BUY in April 2004 when it was trading at RM2.60. The share price has been dropping ever since I've made that call and as at last Friday, it closed at only RM0.285! From this, I've learned an important lesson: Investing in Mesdaq shares is not easy. Some of the technologies involved are beyond our ability to fully comprehend and even if you do, the technologies & the regulations can change very rapidly that a good stock today can turn out to be a lame duck tomorrow. In this sector, technical analysis & protective stop loss are a must!!!

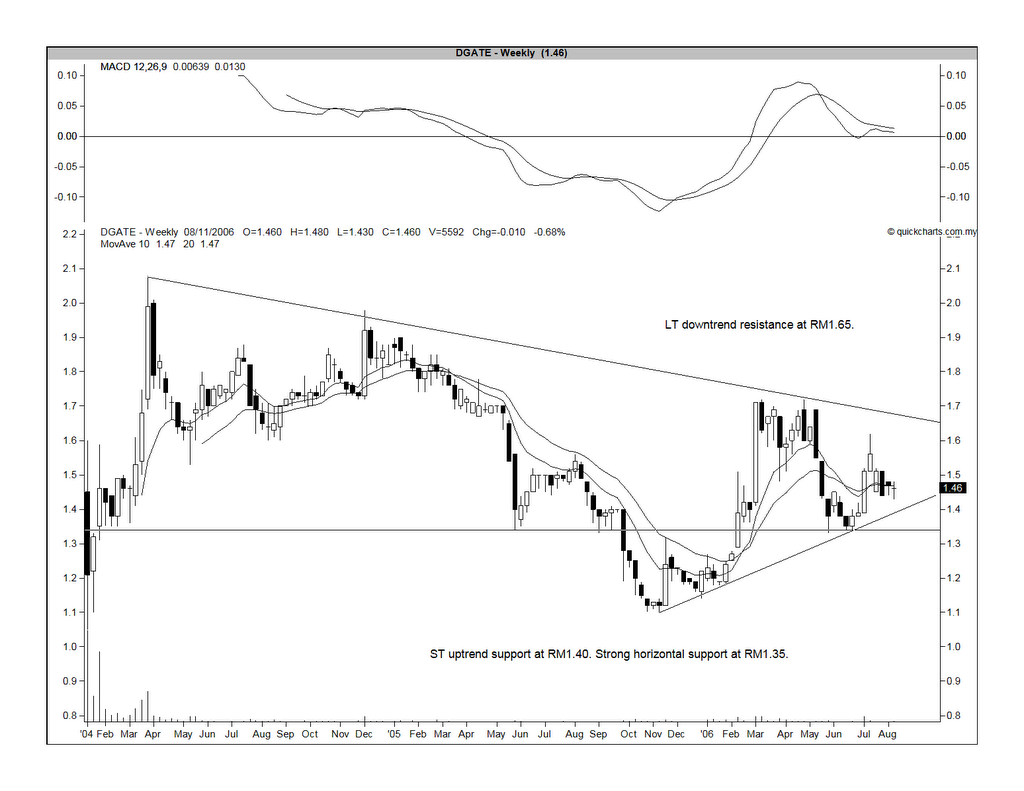
Having said that, one of the star performer i.e. Dreamgate is a stock that I am comfortable to recommend as a Long Term BUY. It supplies slot machines & casino games equipment. The casino scene in Asia is definitely picking up & Dreamgate is likely to get a big slice of the action. Based on CIMB's report dated 20060731, Dreamgate is expected to record an EPS of 12.4 sen & 14.4 sen for 2006 & 2007, respectively. This is a decent jump from only 10.0 sen for 2005. Based on the closing price as at August 11 of RM1.46, the share is trading at a PE of 14.6 times its 2005 earning.

From the chart below, we can see that the stock is in a ST uptrend but its upside is impeded by an overhead downtrend line. It is a good BUY at RM1.40 but a break above RM1.65 could signal the upside rally for the stock. It has a very strong horizontal support at RM1.35, so buying at RM1.40 is fairly safe.


Chart: Dreamgate's weekly chart as at August 11

Konsort also has a bullish breakout

Konsortium Logistik ("Konsort") was in a downtrend, which was only broken when the share price surpassed the RM0.49 level in w/e Jan 13, 2006 (see Chart 1 below).

Thereafter, the share price went sideway for about 3 months. Since May this year, the share price has been fairly volatile with strong resistance set at RM0.845 level. Its trading resembles an ascending triangle (see Chart 2 below) with a breakout at the RM0.845 level. This morning, the share price has broken above that level & hit a high of RM0.89, just before 10.30 a.m. At the time this post is written, the share price has eased back to RM0.85/0.855. If the share closed at RM0.845 (or, higher) today & can maintain above the RM0.845 level over the next day or two, I believe a bullish break of the ascending triangle has been achieved. The outlook for this stock would be positive.


Chart 1: Konsort's weekly chart as August 11


Chart 2: Konsort's daily chart as August 11

MEMS has a bullish breakout

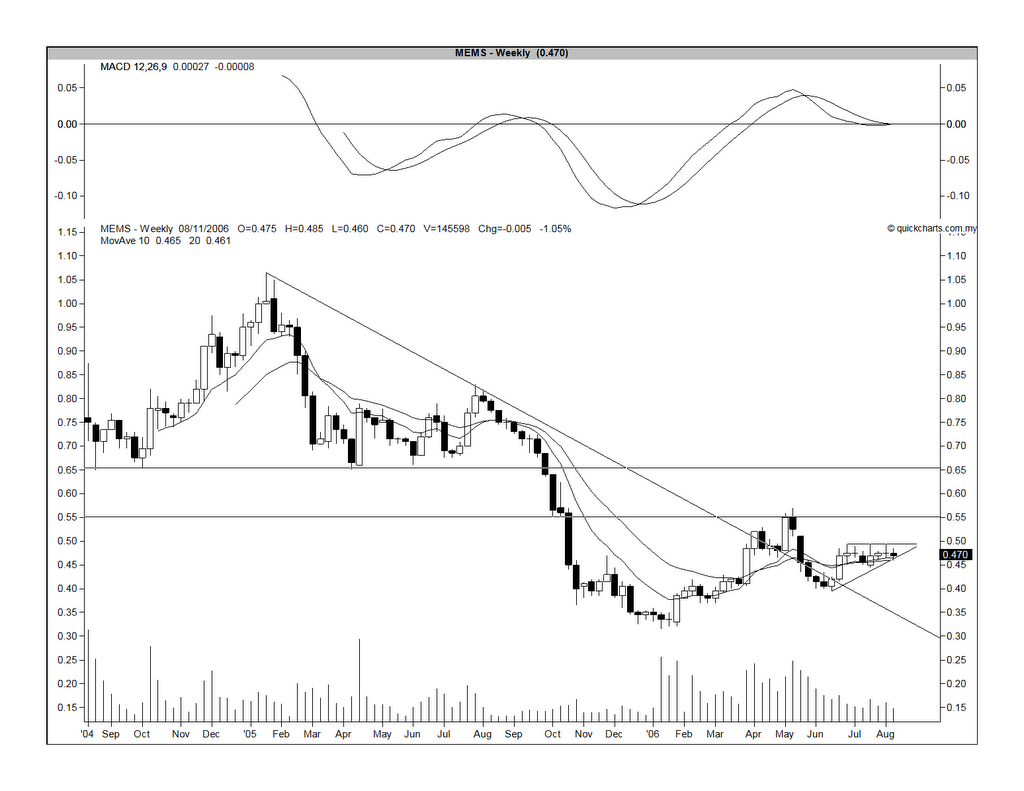
Mems was in a downtrend since making a high of RM1.06 in w/e Jan 21, 2005. The downtrend line was only broken when the share price broke above the RM0.50 level in w/e Apr 7, 2006 (see Chart 1 below).

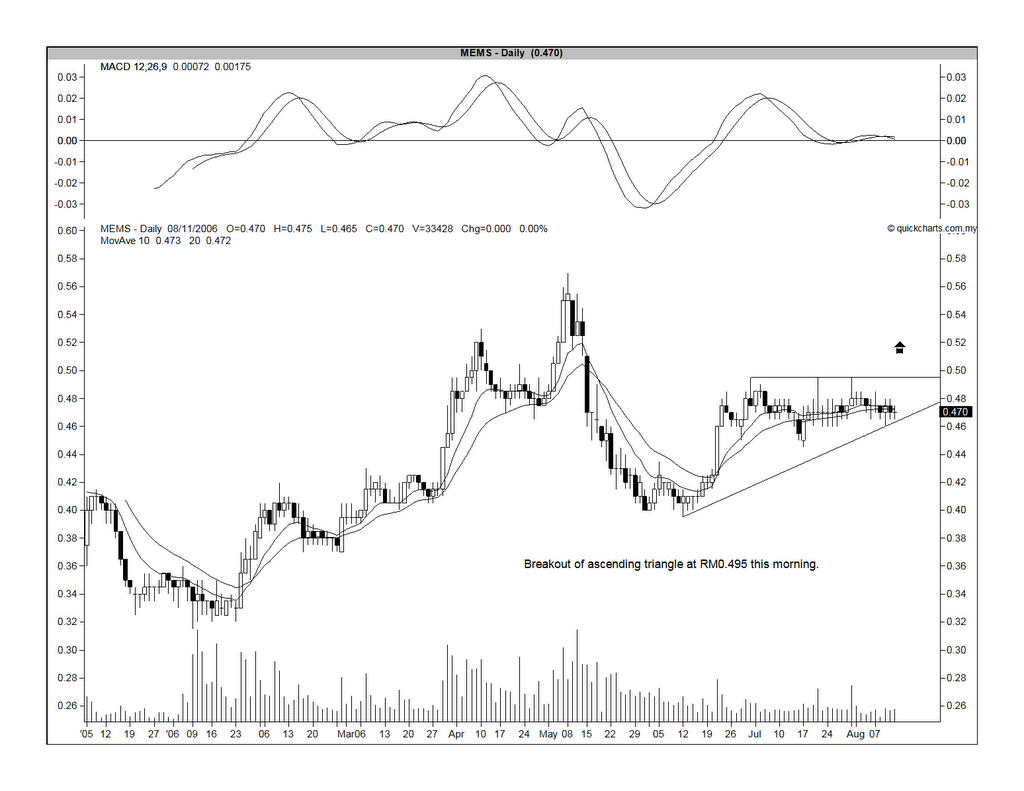
Thereafter, the share price slided back & has been trapped in an ascending triangle for the past 1 to 2 months (see Chart 2 below). A break above the RM0.495/0.50 level could signal the beginning of an uptrend for this stock. This morning, the share price has broken above RM0.50 level & hit a high of RM0.52, just before 11.00 a.m. At the time this post is written, the share price has eased back to RM0.49/0.495. If the share closed at RM0.495/0.50 today & can maintain at this level over the next day or two, I believe a bullish break of the ascending triangle has been achieved. The outlook for this stock would be positive.


Chart 1: Mems' weekly chart as at August 11


Chart 2: Mems' daily chart as at August 11

Friday, August 11, 2006

Linkfest

It's linkfest time again.

1. Last week, a lot of people were surprised by Malayawata's excellent results for QE 30/6/2006. Other steel players have yet to report their results for the same period but going by the Malayawata numbers, I believe their results should be just as good. Here is a look at one of the world-class steel-maker from Korea.

2. Recently, one of the research house upgraded their BUY call for UPA because "recent weakness in the share price, which retraced to a 52-week low, is a good entry point to UPA". Some people believe that buying a stock that has just made a 52-week low is a bad idea. Read more about it here.

3. You may have read about the recent cancellation of the WIMAX tender in Malaysia. WIMAX is viewed by some as the next great disrupter. If you like to know more about WIMAX, go to here and here.

4. A very good piece from Paul McCulley of PIMCO about Fed rate hike & the direction of bond yield. Read about it here.

5. Jeffrey Saut asks whether you are investing with the best?

6. Finally, if you want to get your hand on some research reports before making that decision to invest in some stocks, go to Bursa Malaysia's e-Research vault. You need only to register with them & the reports are there for your viewing for free.

Happy reading & have a good weekend.