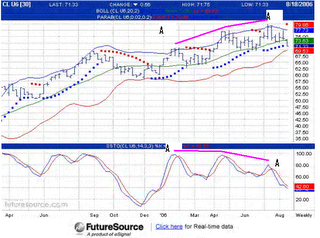
However, if we compare the price movement with one of the indicators i.e. the Slow Stochastic, we could see that as the price of crude oil was making new highs in the past 7 months, the Slow Stochastic is actually making lower highs (see Chart 1 below). I have highlighted the 3 highs of the crude oil price and the 3 accompanying highs of its Slow Stochastic in pink & marked as "AA". The bearish divergence is indicating to us that the internal of the crude oil rally is weakening.

Chart 1: Crude Oil overlaid with Bollinger Bands(20,2); Parabolic(20,20,200); & Slow Stochastic(14,3,3,3)
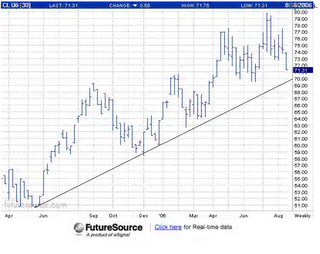
The crude oil is now coming down, reacting to the ceasefire in Lebanon. Other concern for the oil crowd may include slowdown in US & global economy. From Chart 2, we can see that crude oil is clearly in an uptrend line, with the support at USD70. The big question is whether this uptrend line will hold? A break of this uptrend line could be the end of the crude oil rally.

Chart 2: Crude Oil overlaid with uptrend line.
No comments:
Post a Comment