From the daily charts of these 4 sectors (see Chart 1 to 4 below), we can see that all the 4 sectors have recovered substantially from their recent lows but are now coming up against either a strong horizontal resistance (in the case of the Finance sector) or their short-term downtrend (for the other 3 sectors). The big question is whether they can surpass these resistances. I believe that they may not be able to break above these resistances and consequently, the CI is likely to pull back to the congestion area of 920-935 levels.
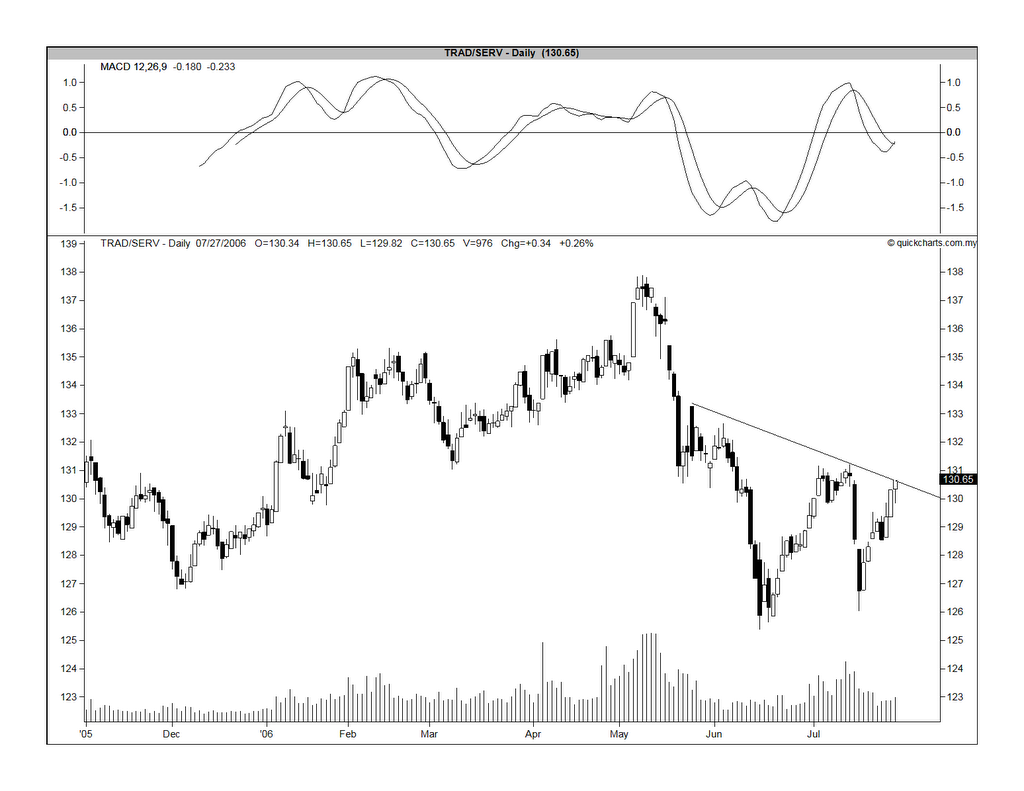
Chart 1: Trading Services' daily chart as at July 27
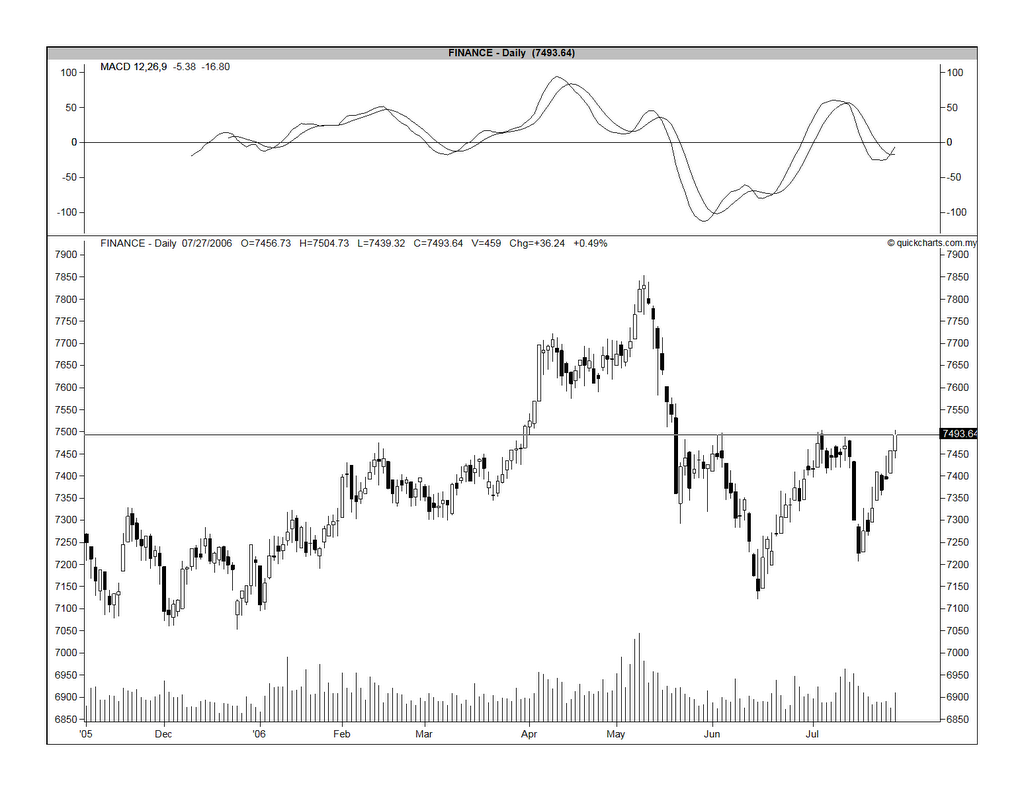
Chart 2: Finance's daily chart as at July 27

Chart 3: Industrial's daily chart as at July 27
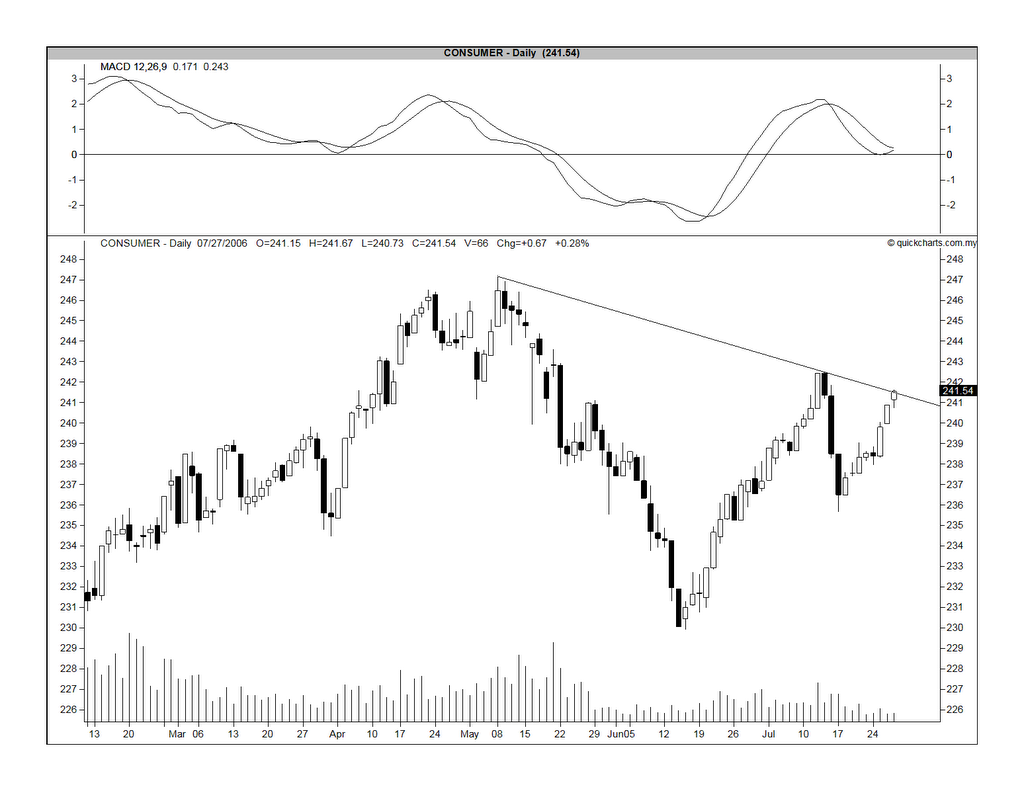
Chart 4: Consumer's daily chart as at July 27
No comments:
Post a Comment