From the table below, you can see that Maybulk's past 3 quarters' result, which is free from extraordinary gain from the sale of vessel, has been rising steadily from RM49.9 mil for QE 30/9/05 to RM58.5 mil for QE 31/12/05 to RM67.5 mil for the QE 31/3/06. The result for QE 30/6/06 has yet to be announced but, based on these 3 quarterly results, Maybulk's annualised EPS is computed to be 29.3 sen. At yesterday (Aug 7)'s closing price of RM2.18, the stock is trading at a PE of 7.44 times only.

Maybulk gained 11 sen to close at RM2.29 at the end of the morning session. The volume traded is fairly big at 14944 lots as was the volume traded in the past 2 days (8099 lots yesterday & 10546 lots on last Friday). With this morning's price gain, Maybulk has broken above its strong horizontal resistance of RM2.20 (see Chart 1 below). The stock may rise to test the downtrend line resistance of RM2.33 soon (see Chart 2 below). A break above this downtrend line could be the beginning of a new uptrend for the stock. Some horizontal resistances may test this stock at the RM2.35/2.40 level but the critical level to look out for is the RM2.33 level.

Chart 1: Maybulk's daily chart as at August 7
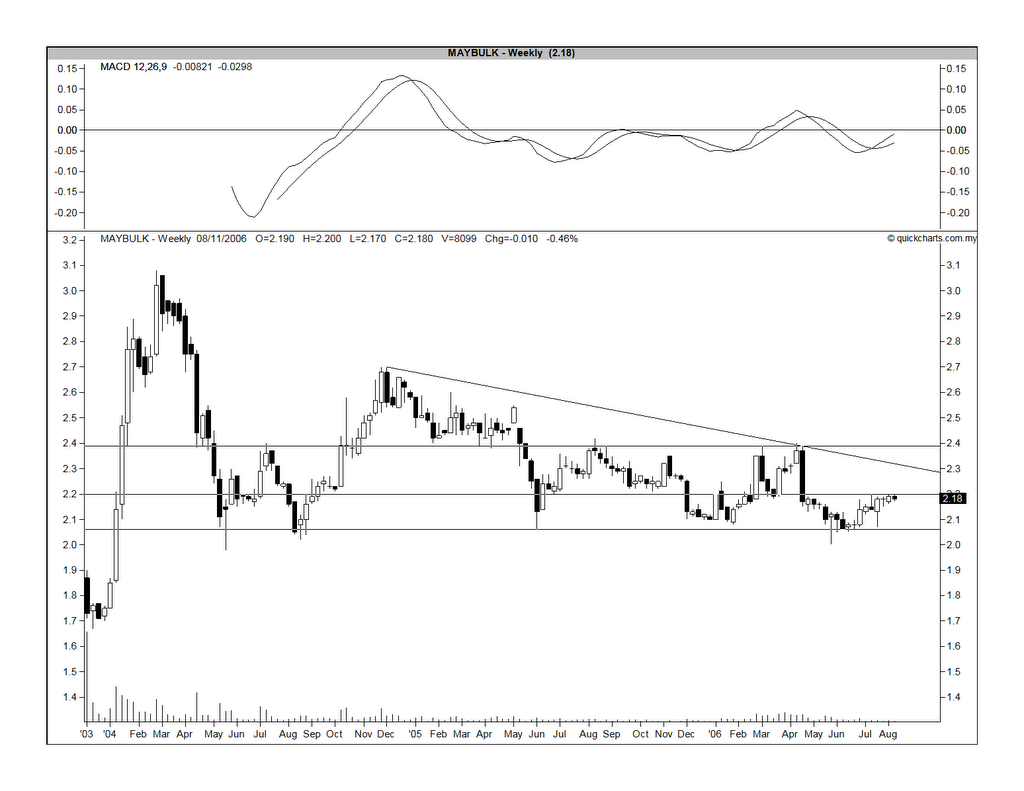
Chart 2: Maybulk's weekly chart as at August 7
No comments:
Post a Comment