Yoko has just reported its results for QE30/9/2006 which shows a net profit of RM2.35 mil, which is a substantial improvement over a net loss of RM4.8 mil recorded in the previous corresponding quarter. Turnover for QE30/9/2006 of RM30.3 mil is 7.8% higher than turnover in QE30/9/2005. Current net profit is however 38.4% lower than the immediate preceding quarter’s net profit of RM3.8 mil. This is attributable to the recognition for the gain on disposal of a subsidiary in France of RM3.1 mil during the last quarter.

EPS for the first 3 quarters amount to 19.23 sen vis-à-vis an EPS of only 0.32 sen for the same periods last year. If we exclude the non-recurring exceptional gain of RM3.1 mil from the disposal of the subsidiary in France, the EPS would be lowered to about 12 sen. Annualizing this, we can arrive at a full year EPS of 16 sen for Yoko. Based on the clsoing price of RM0.555 as at November 24, Yoko is now trading at a PE of about 3.5 times only.
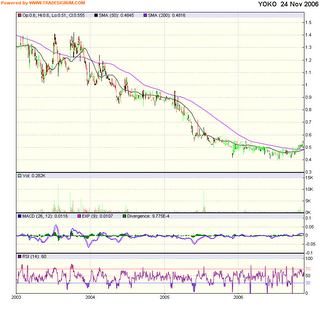
From Chart 1 below, you can see that Yoko may have just broken above its horizontal resistance of RM0.55. This followed the break above its 200-day Simple Moving Average (SMA) of RM0.48 at the end of October. You may also notice that the 50-day SMA has also crossed above the 200-day SMA. For a chart with a longer time frame, go to Chart 2 below.

Chart 1: Yoko's daily chart from Jan 2005-November 2006

Chart 2: Yoko's daily chart from Jan 2003-November 2006
Based on attractive valuation & potentially bullish technical outlook, Yoko is a stock good for a medium-term trade or for the long haul.
No comments:
Post a Comment